GUI Overview

Overview

The Nexus Dashboard Orchestrator (NDO) GUI is a browser-based graphical interface for configuring and monitoring your Cisco APIC, Cloud APIC, and DCNM deployments.

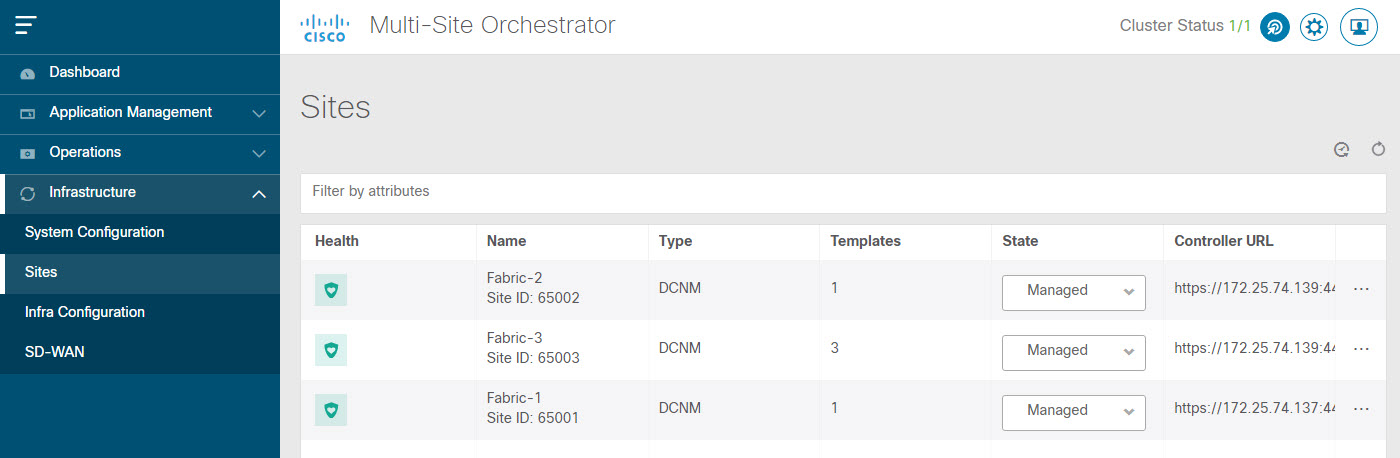
The GUI is arranged according to function. For example, the Dashboard page contains an overview of your fabrics and their health, the Sites page provides information on each site and allows you to add sites, the Schemas page allows you to create and configure schemas, and so on. The functionality of each NDO GUI page is described in the following sections.

The top of each page shows the controller status indicating how many controllers are operational, the Get Started menu icon, the Settings icon, and the User icon.

The Get Started menu provides easy access to a number of common tasks you may want to perform, such as adding sites or schemas, configuring specific policies, or performing administrative tasks.

The Settings icon allows you to access overview information about your Nexus Dashboard Orchestrator, such as the currently running version, what's new in the current release, API documentation, and system status:

  • The About NDO link displays information about the version of the Nexus Dashboard Orchestrator currently installed.

  • The What's New in This Release link displays a short summary of the new features in your release, as well as links to the rest of the Nexus Dashboard Orchestrator documentation.

  • The API Docs link gives you access to the set of Swagger API object and method references. Using the Swagger API is described in more detail in the Cisco Multi-Site REST API Configuration Guide.

  • The System Status link provides you with the status and health of all running services that are used by the NDO.

The User icon allows you to view information about the currently logged in user, preferences and bookmarks. It also allows you to log out of the Orchestrator GUI.


Note


Starting with Release 3.2(1), user management has moved to the common user and authentication management in the Nexus Dashboard where your NDO service is running.


  • The Preferences link allows you to change a few GUI options.

  • The Bookmarks link opens the list of all the bookmarked schemas you save while using the Orchestrator. You can bookmark a schema by clicking the bookmark icon in the top right corner of the screen while viewing or editing the schema.

When working with fabric objects, a Display Name field is used throughout the Orchestrator's GUI whenever the objects are shown. You can specify a display name when creating the objects, however due to object naming requirements on the site controllers, any invalid characters are removed and the resulting Internal Name is used when pushing the objects to sites. The Internal Name that will be used when creating the tenant is typically displayed below the Display Name text box.

Dashboard

The Nexus Dashboard Orchestrator dashboard displays the list of all of your site implementations in addition to their current functionality and health.

The Dashboard has the following functional areas:

  • Site Status: The site status table lists your sites according to name and location. The table also indicates the current health status for your implementation according to a descriptive color code.

    • The Controller State column indicates the number of controllers available and running. You can have a maximum number of 3 controllers in your Multi-Site implementation. For example, if one out of the 3 controller is down it is represented as 2/3.

    • The Connectivity column provides an operational status of the BGP sessions and the dataplane unicast and multicast tunnels that are connected to the peer sites for each site in the dashboard.

      When one or more BGP sessions or tunnels fail to establish, Multi-Site provides the information about which exact local spines and remote spines failed to establish the BGP session or the tunnel. Multi-Site should be enabled in the site in the infrastructure configuration, for the BGP sessions and the dataplane unicast and multicast tunnels to be established to the peer sites.

      BGP Sessions

      • When the BGP peering type is full-mesh in Infra-> General Settings, the spine node in a site with the BGP peering enabled will establish the BGP sessions to all the spine nodes with the BGP peering enabled in all the peer sites.

      • When the BGP peering type is route-reflector in Infra-> General Settings, the spine node in a site with both BGP peering enabled and route-reflector enabled, will establish the BGP sessions to all the spine nodes with the BGP peering enabled in all the peer sites. In the route-reflector mode, at least the local spine node or the remote spine node or both should have the route-reflector enabled. Otherwise, the BGP session is not established between them.

      • If the local and the remote ASNs are different, then it is eBGP. Therefore, the sessions between those sites are always full-mesh, irrespective of the BGP peering type and the route-reflector configuration.

      Unicast and Multicast Tunnels: A spine node in a site that is connected to ISN and has infrastructure configuration, will establish a tunnel to all the spine nodes that are connected to ISN in the peer sites.

    The color codes indicate the following conditions:

    • Critical (red)

    • Major (orange)

    • Minor (yellow)

    • Warning (green)

    The numbers in the color indicator columns indicate the number of faults per site.

  • Schema Health: provides a listing of your schemas with locales and health.

    • You can click the magnifying glass icon and enter a schema name to search for a subject schema.

    • You can click the + sign to start adding a new schema to your site.

    • You can click the site locale in the Schema Health table to view the schema details and status for a template.

      The Schema Health table provides a heat map type of display; that is, the health of the subject schema is displayed according to color. Schemas that span two columns (i.e, locales) indicate a stretched condition.

      • Click the color highlighted table cell to further discover what policies are incorporated into the subject schema. On the schema details page, you can click the arrow to go into the schema builder and update the policy details in the subject schema.

      • The color coded slider enables you to select a range for identifying schemas whose health require further review. For example, you can adjust the slider value to between 80 and 100. Then all of your schema implementations that fall within that specific range are displayed on the accompanying Schema Health table.

Application Management > Tenants Page

The Multi-Site Tenants page lists all of the tenants that comprise your implementation.

The table on the Tenants page displays the following:

  • Tenant Name

  • Assigned to Sites

  • Assigned to Users

  • Assigned to Schemas

  • Actions

The features and functionality on this page include the following:

  • Name: click a tenant name to access the Tenant Details settings page. On the Tenant Details page you can edit or update the following sections:

    • General Settings: change the Display Name and Description as required.

    • Associated Sites: view the sites associated with the subject tenant.

    • Associated Users: view the users associated with the subject tenant - you can associate a user with the subject tenant by checking the empty box next to the user name.

  • Associated Schemas: click the Associated Schema listing to view the schemas associated with the subject tenant.

  • Actions: click the Actions listing to edit the subject tenant's details sites or to create a new network mapping.


    Note


    You can delete the Tenant object by selecting Delete on the Actions drop down menu.
  • Add Tenant: click Add Tenant button to add an existing tenant to your implementation. On the proceeding Tenant Details page, you can add the tenant name, description, security domain, and associated users.

Audit Logs

Click the Audit Log icon next to the Add Schema tab to list the log details for the Schemas page. The Audit Logs: Tenant List page is displayed.

The table on the page displays the following details:

  • Date

  • Action

  • Details

  • User

Click the Most Recent tab to select the audit logs during a particular time period. For example, when you select the range from November 10, 2019 to February 14, 2020 and click Apply, the audit log details for this time period are displayed on the Audit Logs page.

Click the Filter icon next to the Most Recent tab to filter the log details using the following criteria:

  • User: Select one username or all users and click Apply to filter the log details using the username.

  • Action: Select the action, for example, created, updated, or deleted, and click Apply to filter the log details according to the action.

For more information, see the Tenants chapter.

Application Management > Schemas Page

The Schemas page lists all schemas that are associated with your deployment.

Use the magnifying glass and associated field to search for a specific schema. Use schemas to configure or import tenant policies, including the VRF, application profile with EPGs, filters and contracts, bridge domains, and external EPGs.

The Schemas table shows the following information:

  • Name: click the schema name to view or update the settings for the subject schema.

  • Templates: displays the name of the template that is used for the schema. Templates are analogous to profiles in the ACI context, which group policies. You can create templates for stretched objects or site-specific objects.

  • Tenants: displays the name of the tenant that is used for the subject schema.

  • Actions: click the Action field with the associated schema to either edit or delete the subject schema.

You can use the Add Schema button to add a new schema, which is described in more details in later sections of this document.

Audit Logs

Click the Audit Log icon next to the Add Schema tab to list the log details for the Schemas page. The Audit Logs: Schemas List page is displayed.

The table on the page displays the following details:

  • Date

  • Action

  • Details

  • User

Click the Most Recent tab to select the audit logs during a particular time period. For example, when you select the range from November 10, 2019 to February 14, 2020 and click Apply, the audit log details for this time period are displayed on the Audit Logs page.

Click the Filter icon next to the Most Recent tab to filter the log details using the following criteria:

  • User: Select one username or all users and click Apply to filter the log details using the username.

  • Action: Select the action, for example, created, updated, or deleted, and click Apply to filter the log details according to the action.

Application Management > Policies Page

The Nexus Dashboard Orchestrator Policies page displays all policies you have configured for your fabrics.

The Policies page contains a table of all policies along with the summary of their types, tenants they're associated with, descriptions, and usage. You can use this page to add new policies or edit existing ones.

You can configure the following policies:

Infrastructure > Sites Page

The NDO Infrastructure > Sites page displays all of the sites in your implementation, for example:

Figure 1. Multi-Site Sites Page

The Sites page includes the following:

  • Site Health indicates the status of the site's overall health according to the following color coded identifiers:

    • Critical (red)

    • Major (orange)

    • Minor (yellow)

    • Warning (green)

  • Site Name shows the display name of the site as you defined it when adding the site.

  • Site Type displays the fabric type, for example ACI or DCNM.

  • The Templates column indicates the number of templates associated with the site.

  • The State column indicates whether or not this particular fabric is managed by NDO.

    You add and manage sites and their properties in the Nexus Dashboard GUI. The NDO Sites page displays all the sites available in the Nexus Dashboard GUI and allows you to define which specific sites you want to be managed by the NDO.

  • The Controller URL column displays the in-band IP address of the site's controller.

  • The actions menu (...) allows you to import the site's tenants (ACI fabrics only) or open the site's controller UI.

If you click a specific site, a right Properties sidebar opens and you can view additional information about the site.