Introduction to AIOps Insights

About AIOps Insights

Firewalls are a critical component of any organization's network security architecture. However, as organizations expand and the threat landscape evolves, managing these firewalls becomes complex. Staying updated with the continuous changes and rules to adapt to new threats, network changes, and compliance requirements presents significant challenges. Improper management can lead to security gaps and vulnerabilities, posing risks to the organization's network security.

To effectively address these challenges, a new approach to firewall management is required. This is where AIOps becomes essential.

AIOps for firewalls leverages artificial intelligence (AI) and machine learning (ML) to streamline and enhance the management and security of network firewalls. By using dynamic baselines and advanced forecasting models, AIOps can detect policy anomalies and predict potential issues before they escalate, ensuring proactive maintenance and stability.

The key features include:

  • Real-Time Traffic and Capacity Monitoring: Monitors network traffic and system capacity in real-time and detects anomalies such as elephant flows, ensuring resources are optimized for peak performance.

  • Policy Anomaly Detection: Analyzes firewall policies, detecting misconfigurations or anomalies before they impact performance or security.

  • Feature Adoption Insights and Best Practice Recommendations: Provides insights into the adoption of features and suggests best practices to optimize security configurations.

  • Predictive Forecasting for Network Issues: Predicts potential future network issues, allowing you to address them proactively and minimize downtime.

  • Critical Alerts: Filters and prioritizes the most urgent security events helping you focus on critical issues.


Note


Currently, the AIOps features are available only for threat defense devices that are managed by cloud-delivered Firewall Management Center.


AIOps provides the following functionalities:

  • Summary Insights: Provides detailed information on all Active Insights and Insights Trend. You can view a list of all anomalies that are categorized by severity and type.

  • Policy Analyzer and Optimizer: Analyses security policies, detects anomalies, and provides recommendations on remediations that can be performed to optimize the policies, thereby improving the firewall performance.

  • Feature Adoption: Provides insights into the features that are adopted and the percentage of adoption to modify the usage pattern and achieve optimal security. By analyzing the adoption rate of different features, you can make decisions on how to improve the usage pattern and enhance security measures.

  • Configuration Settings: Provides the ability to configure thresholds for AIOps features and enable or disable insight preferences. You can customize these settings to suit your specific needs.

AIOps Licensing Requirements

If you have licenses for the Secure Firewall Management Center, you can gain access to AIOps capabilities by enabling AIOps Insights on your tenant. The initial version of AIOps is included as part of your firewall license and is granted on a per-device basis.

Prerequisites to Use AIOps

  • Ensure you have access to a Security Cloud Control tenant where AIOps Insights is enabled and cloud-delivered Firewall Management Center is provisioned.

  • Ensure that you have configured the thresholds and preferences for AIOps features.
Enable AIOps Insights

To take advantage of AIOps' benefits, you must Enable AIOps Insights. Only with Super Admin or Admin user roles you can enable AIOps Insights for your tenant.

Procedure


Step 1

On the welcome screen, click Start Onboarding.

Step 2

In the AIOps Insights for Cisco Firewall window, click Setup.

Step 3

On the Setup AIOps page, check the Confirm AlOps activation check-box.

Step 4

Click Get Started.

The onboarding process begins, and it takes a few minutes to fetch the data that is required to provide the insights. When completed, the AIOps > Summary page is displayed.


View Summary Insights

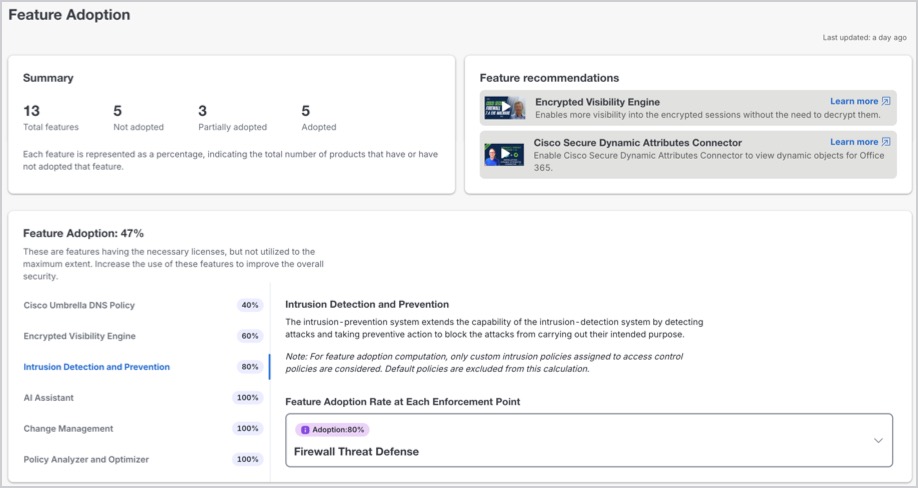
The AIOps Summary page provides detailed information on all Active insights, including a categorized list of detected anomalies.

Procedure


Step 1

In the left pane, click Insights & Reports > Summary.

Step 2

View the total number of Active Insights.

Insights are classified by:

  • Severity: Insights are classified by their severity levels such as Critical, Warning, and Info.

  • Category: Insights are classified by their categories such as Configuration, Traffic & Capacity, Health & Operations.

Categories

Subcategories

Configuration

Access control policy anomaly detection

Traffic & Capacity

  • Elephant flow detection

  • RA VPN capacity assessment

Health & Operations

  • High data plane CPU usage

  • Snort high CPU usage

  • High data plane memory usage

  • Snort high memory usage

Step 3

Insights Trend displays a timeline showing the trend of insights over a specific duration of time. You can set the duration to 1, 6, 12, or 24 hours, and 2 or 7 days. The default view is set to 24 hours.

Step 4

In the All Insights section, details of each insight are displayed, such as:

  • Time: Time at which the insight was detected or updated.

  • Severity: Severity of the insight such as Critical, Warning, and Info.

  • Insight: Insight title and a short summary about the issue.

  • Category: Insight category such as Health & Operations, Traffic & Capacity, and Configuration.

  • Impacted Resources: Impacted resource for the insights, which can be a device, host, or policy. Currently, only threat defense devices and FMCs are supported.

  • Duration: Duration of the issue since it was first detected until it was resolved.

  • Status: Status of the insight such as Active and Resolved.

Step 5

You can filter insights by factors such as Time Range, Severity, Category, Impacted Resources, Duration, and Status.

Step 6

Click the gear icon to select which columns to display in the All Insights table.

Figure 1.

Assess and Improve Feature Adoption

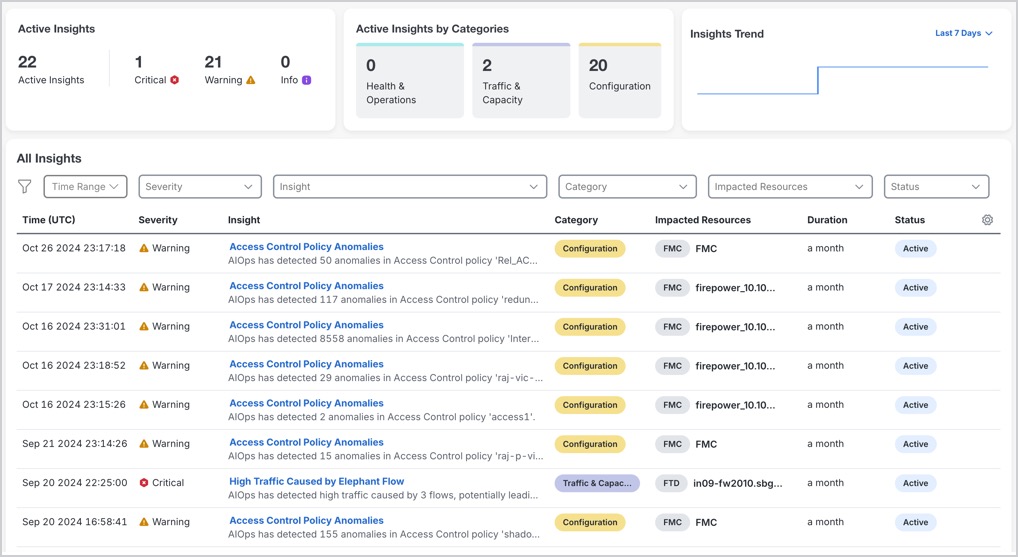
Feature Adoption provides insights into the features that are adopted and the percentage of adoption. This information helps you modify your usage patterns to achieve optimal security. By analyzing the adoption rate of different features, you can make decisions to enhance security measures.

Procedure


Step 1

In the left pane, click Insights & Reports > Feature Adoption.

Step 2

In the Summary tile, you can view the total number of features available, including how many are Not Adopted, Partially Adopted, and Adopted.

Step 3

In the Feature Recommendation tile, you can watch short videos about recommended features that will help enhance your organization’s security.

Step 4

In the Feature Adoption section, you can view the percentage of adoption of a particular feature . The feature adoption rate can vary between 0% and 100% depending on the usage.

Note

 
  • The feature adoption data is refreshed every 24 hours.

  • We recommend increasing the usage of these features to improve overall security.

Step 5

Click on a feature name to view more details, such as:

  • A short description of the feature

  • Feature adoption rate

  • Steps to improve your feature adoption rate efficiency

Figure 2. Feature Adoption

Configure Settings for AIOps

You can configure thresholds for the following AIOps features and enable or disable insight preferences for your tenant:

Enable Traffic and Capacity Insights

You can modify preferences for traffic and capacity-related insights.


Note


  • The settings for Elephant Flow Detection and RAVPN Capacity Assessment are enabled by default.

  • The RA VPN Capacity Assessment runs every 24 hours, with changes applied in the subsequent assessment cycle.


Procedure


Step 1

In the left pane, click Insights & Reports > Settings > Traffic & Capacity.

Step 2

Enable the toggle to detect the elephant flows that transfer large amounts of data and lead to system performance issues. Click Submit.

For more information, see Elephant Flow Detection.

Step 3

Enable the toggle to forecast the trajectory of RA VPN user sessions using the current data, and determine the anticipated time until maximum system capacity is reached.

For more information, see Remote Access VPN.

  1. Choose the Accuracy from the drop-down. This determines the accuracy of the forecast based on the Root Mean Squared Error (RMSE) value.

  2. Enter the Max Session Threshold value.

    • The default value is 90%.

    • The minimum value is 1%, and the maximum value is 100%.

  3. Enter the Forecast Duration in Days.

    • The default duration is 90 days.

    • The minimum duration is 1 day, and the maximum duration is 90 days.


When you have enabled the features for the tenant, you can view the detected anomalies on the Summary page, and the respective widgets are displayed on the dashboard.

Enable Feature Adoption Insights

You can modify preferences for Feature Adoption-related insights.


Note


The settings for Feature Adoption is enabled by default.


Procedure


Step 1

In the left pane, click Insights & Reports > Settings > Feature Adoption.

Step 2

Enable the toggle to gain insights into feature adoption and the percentage of adoption.

Step 3

Click Submit.


When you have enabled the feature for the tenant, you can view the detected anomalies on the Summary page, and the respective widget is displayed on the dashboard.

Enable Health and Operations Insights

You can modify your preferences for health and operations-related insights.


Note


The settings for Health & Operations are enabled by default.


Procedure


Step 1

In the left pane, click Insights & Reports > Settings > Health.

You can enable the following health-related insights:

Step 2

Enable the Data Plane High CPU Usage toggle to monitor data plane CPU usage and detect when thresholds are exceeded.

  1. Enter the CPU Threshold value.

    • The default value is 80%

    • The minimum value is 0% and the maximum value is 100%

  2. Choose the Insight Severity from the drop-down.

Step 3

Enable the Snort High CPU Usage toggle to monitor snort CPU usage and detect when thresholds are exceeded.

  1. Enter the CPU Threshold value.

    • The default value is 80%

    • The minimum value is 0% and the maximum value is 100%

  2. Choose the Insight Severity from the drop-down.

Step 4

Enable the Data Plane High Memory Usage toggle to to monitor data plane memory usage and detect when thresholds are exceeded.

  1. Enter the Memory Threshold value.

    • The default value is 80%

    • The minimum value is 0% and the maximum value is 100%

  2. Choose the Insight Severity from the drop-down.

Step 5

Enable the Snort High Memory Usage toggle to to snort memory usage and detect when thresholds are exceeded.

  1. Enter the Memory Threshold value.

    • The default value is 80%

    • The minimum value is 0% and the maximum value is 100%

  2. Choose the Insight Severity from the drop-down.

Step 6

Click Submit.


When you have enabled the feature for the tenant, you can view the detected anomalies on the Summary page, and the respective widget is displayed on the dashboard.

Frequently Asked Questions About AIOps

What is AIOps?

AIOps for firewalls leverages artificial intelligence (AI) and machine learning (ML) to streamline and enhance the management and security of network firewalls. By using dynamic baselines and advanced forecasting models, AIOps can detect policy anomalies and predict potential issues before they escalate, ensuring proactive maintenance and stability.

Are AIOps features available for all types of FMC-managed threat defense devices?

AIOps features are available only for cloud-delivered Firewall Management Center-managed threat defense devices. Currently, there is no on-premises management center support.

Can enabling AIOps fail?

In case of onboarding failure open a support ticket with Cisco Technical Assistance Center (TAC).

Can AIOps Insights be disabled?

Yes, open a support ticket with Cisco Technical Assistance Center (TAC) to disable AIOps Insights.