Monitor Faults

This chapter describes the tasks to view alarms and create alarm profiles.

Fault Monitoring

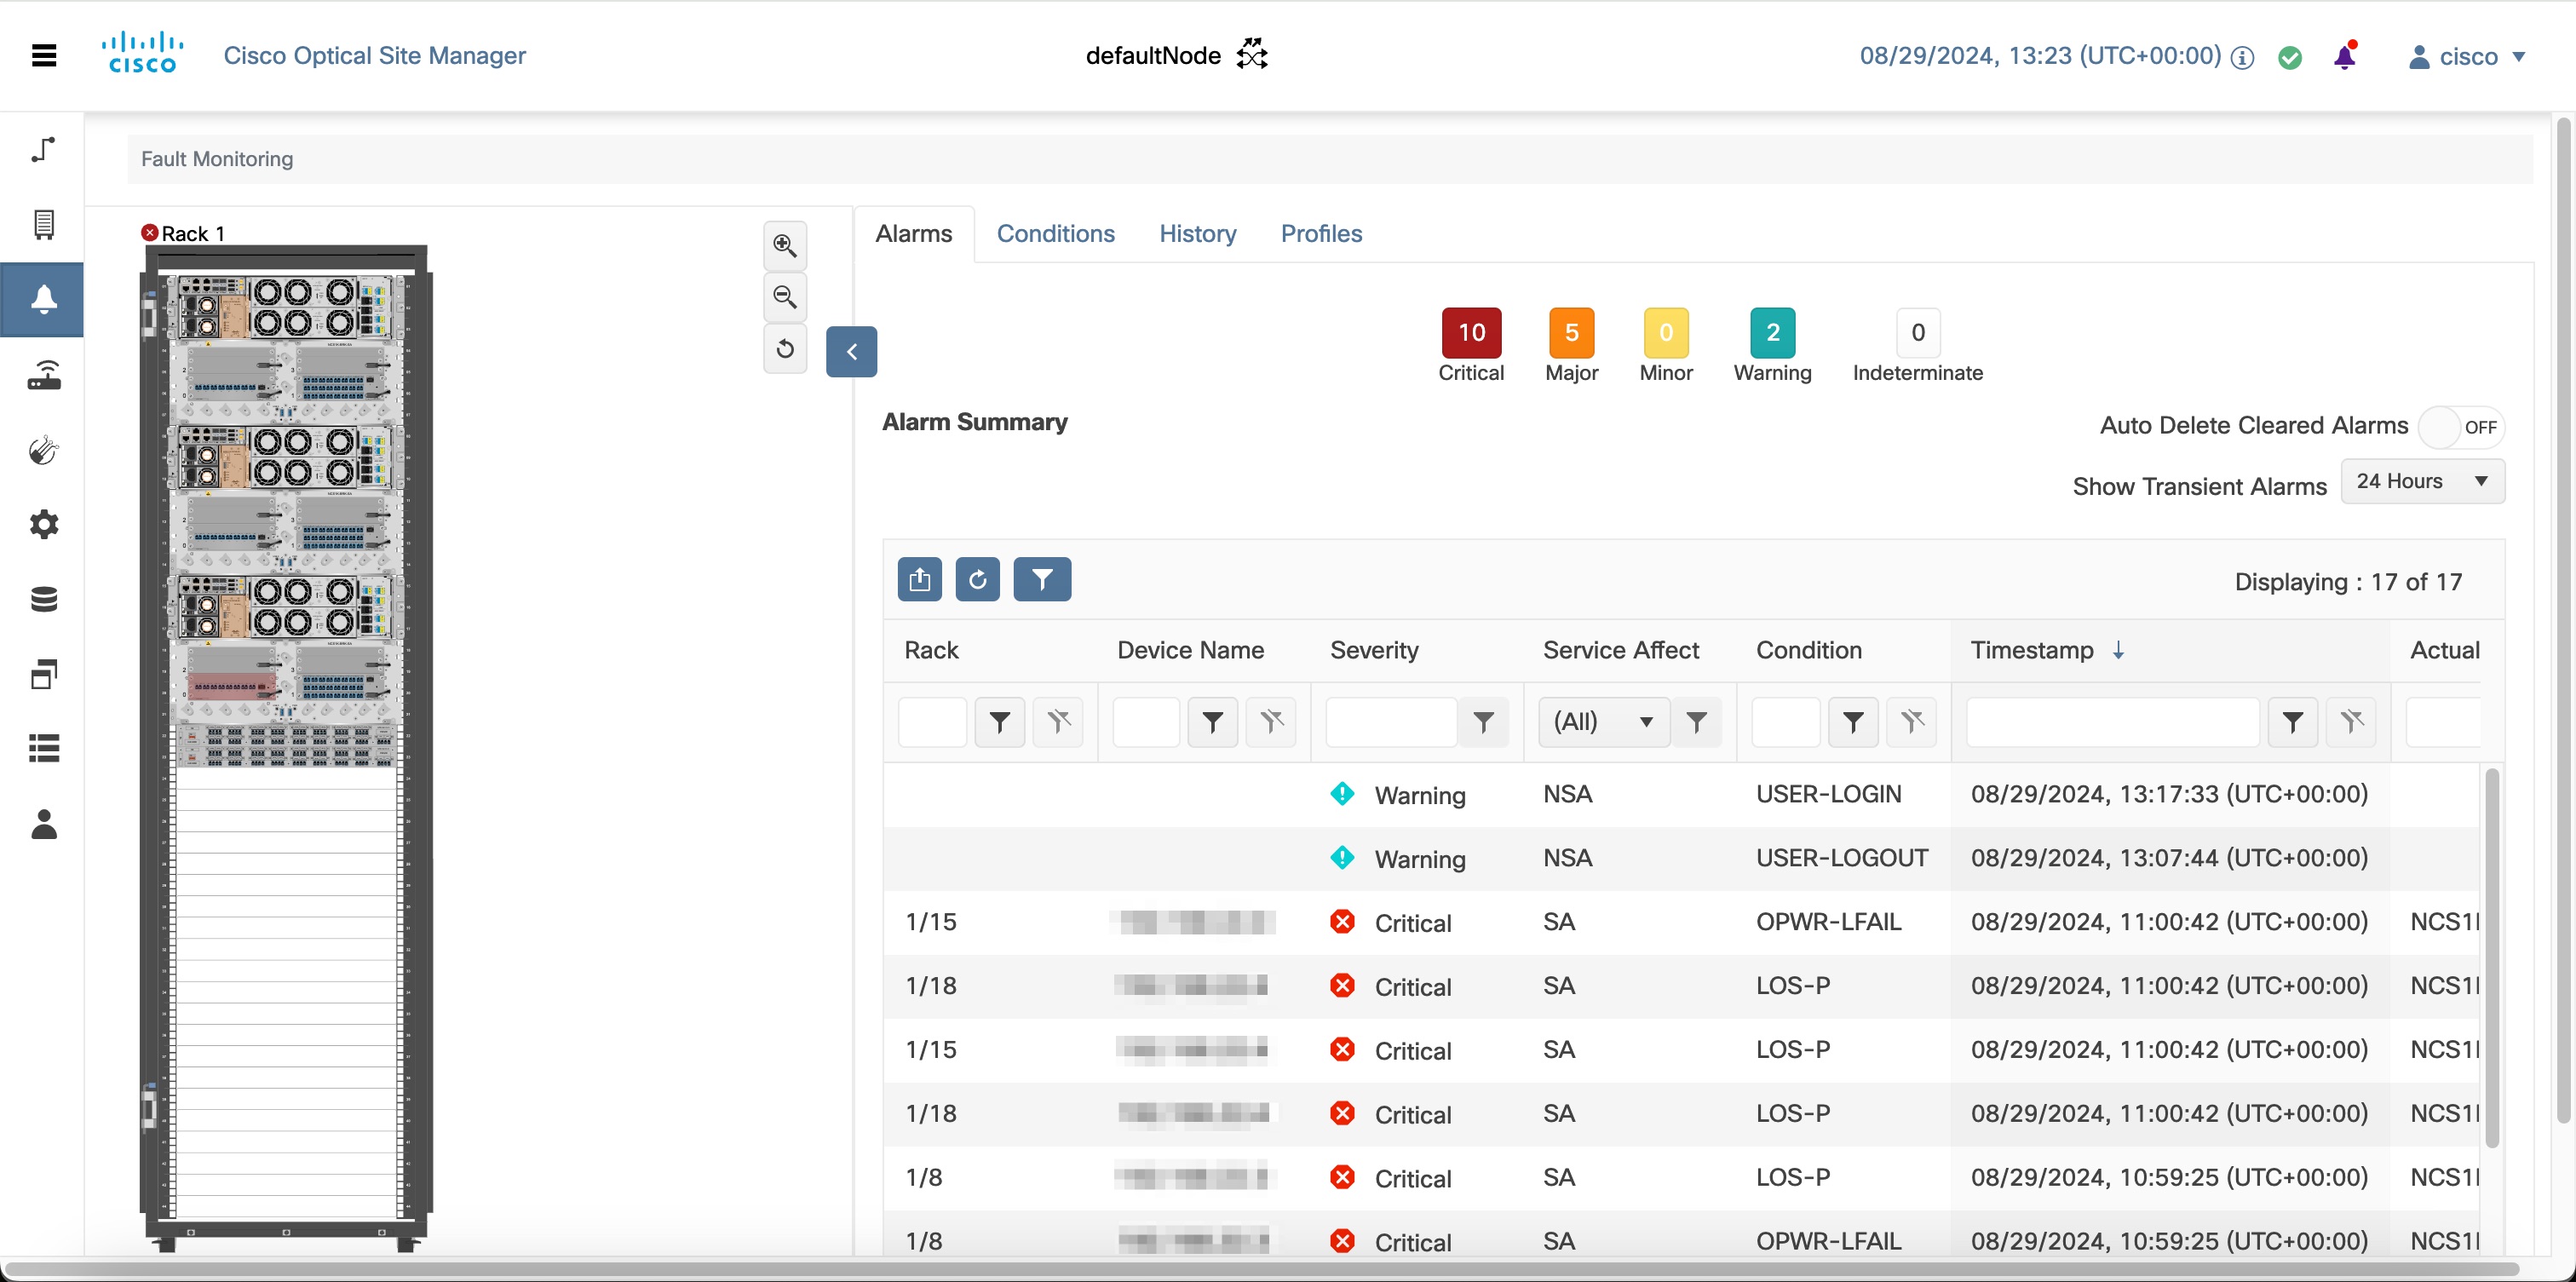
The Fault Monitoring panel displays a summary of all encountered alarms and conditions. It displays the number of Critical (CR), Major (MJ), Minor (MN), Warnings (W), and Non-applicable (NA) alarms. It displays the alarms, transient conditions, and historical alarms that are related to chassis, passive devices, pluggables, line cards, amplifier cards, and control cards. You can also create custom alarm profiles and apply them on the node using this pane.

Figure 1. Fault Monitoring

View Rack, Chassis, or Card Alarms

Use this task to display the alarms raised on a rack, chassis, or card.

Before you begin

Log into Cisco Optical Site Manager

Procedure


Step 1

Click COSM Topology in the left panel.

The COSM Topology page appears.

Step 2

Perform one of the following steps to view alarms for a rack, chassis or card:

  • Click the rack name from the Rack view to view alarms for a rack.

  • Right-click the chassis screws from the Rack view and select Open to view alarms for a chassis.

  • Right-click the card from the Rack view and select Open to view alarms for a card.

The Alarms tab displays the alarms with several severities, such as Critical, Major, Minor, Warning, and Intermediate. The alarm severities are indicated by different colors.

Step 3

Select a sepcific time slot from the Show Transient Alarms drop-down list to view alarms for a specific time slot.

Step 4

Step 5

(Optional) Click the Auto Delete Cleared Alarms toggle button to automatically delete the cleared alarms.

Step 6

(Optional) Click the Excel Export button to export the alarms to an Excel sheet.


View All Alarms and Conditions

Use this task to display all alarms and transient conditions for all the racks, chassis, and cards.

Before you begin

Log into Cisco Optical Site Manager

Procedure


Step 1

Click Fault Monitoring in the left panel.

Alternatively, you can also click the bell icon on the top-right corner.

Step 2

Click the Alarms tab to view all the alarms.

Alarms are displayed with several severities, such as Critical, Major, Minor, Warning, and Intermediate. The alarm severities are indicated by different colors.

Step 3

Click the Conditions tab to view all the transient conditions.

Step 4

Click the History tab to view the alarms.

Step 5

(Optional) Click the Auto Delete Cleared Alarms toggle button to automatically delete the cleared alarms.

Step 6

(Optional) Click the Excel Export button to export the alarms to an Excel sheet.


View Rack, Chassis, or Card Transient Conditions

Use this task to display the transient conditions raised on a rack, chassis, or card.

Before you begin

Log into Cisco Optical Site Manager

Procedure


Step 1

Click COSM Topology in the left panel.

The COSM Topology page appears.

Step 2

Perform one of the following steps to view the transient conditions:

  • Click the rack name from the Rack view to view the transient conditions for a rack.

  • Right-click the chassis screws from the Rack view and select Openthe transient conditions for a chassis.

  • Right-click the card from the Rack view and select Open the transient conditions for a card.

Step 3

Click the Conditions tab.

Step 4

Select a time slot from the Show Transient Alarms In drop-down list to view transient conditions for a specific time slot.

Step 5

(Optional) Click the Excel Export button to export the conditions to an Excel sheet.


View Alarms History

Use this task to display the alarms history raised on a rack, chassis, or card.

Before you begin

Log into Cisco Optical Site Manager

Procedure


Step 1

Click COSM Topology in the left panel.

The COSM Topology page appears.

Step 2

Perform one of the following steps to view the alarms history:

  • Click the rack name from the Rack view to view alarms history for a rack.

  • Right-click the chassis screws from the Rack view and select Opento view alarms history for a chassis.

  • Right-click the card from the Rack view and select Open to view alarms history for a card.

Step 3

Click the History tab.

Alarms are displayed with several severities, such as Critical, Major, Minor, Warning, and Intermediate. The alarm severities are indicated by different colors.

Step 4

(Optional) Click the Excel Export button to export the alarms hisyory to an Excel sheet.


Alarm Profiles

The alarm profiles feature allows the user to change default alarm severities by creating unique alarm profiles for individual ports, cards, chassis, passive units, optical cross-connects, and optical interfaces.

The Default alarm profile containing all the alarms is preprovisioned on the node. The Default profile sets alarm severities to standard Telcordia GR-474-CORE settings. The alarm severities in the Default profile cannot be changed. After loading the Default profile on the node, you can create custom alarm profiles. In the Inherited alarm profile, alarms inherit or copy severity from the next highest level. For example, a card with an Inherited alarm profile copies the severities that are used by the node hosting the card.

By defalut, you can view two alarm profiles:

  • Defalut―The Default alarm profile containing all the alarms is preprovisioned on the node. The Default profile sets alarm severities to standard Telcordia GR-474-CORE settings. The alarm severities in the Default profile cannot be changed. After loading the Default profile on the node, you can create custom alarm profiles. In the Inherited alarm profile, alarms inherit or copy severity from the next highest level. For example, a card with an Inherited alarm profile copies the severities that are used by the node hosting the card.

  • all-suppressed alarms―Includes all the suppressed alrams.

You do not have to apply a single alarm profile to the node, card, and port-level alarms. Different profiles can be applied at different levels. You could use the default profile on a node and on all the cards and ports, but apply a custom profile that downgrades an alarm on a specific card.

When you modify severities in an alarm profile, all the Critical (CR) or Major (MJ) default or user-defined severity settings are demoted to Minor (MN) in Non-Service-Affecting (NSA) settings and the other way round as defined in Telcordia GR-474. Default severities are used for all alarms and conditions until you create a new profile and apply it.
Create and Load Alarm Profiles

Use this task to create and load alarm profiles a node.

Before you begin

Log into Cisco Optical Site Manager

Procedure


Step 1

Click Fault Monitoring in the left panel.

Step 2

Click the Profiles tab.

Step 3

Click Alarm Profile to expand the section.

The default profile all-suppressed alarms is displayed along with the list of alarms.

Step 4

Click the + button to create an alarm profile.

The Alarm Profile dialog box appears.

Step 5

Enter the name of the custom alarm profile in the Name field.

Step 6

(Optional) Choose the resources such as card, ecu, and fan-tray from the Resources drop-down list.

You can select multiple resouces from the list.

Step 7

Click Apply.

The created alarm profile is displayed in the list along with the default alarm profile.

Step 8

Select the check-box corresponding to the alarm profile you just created and click Load Profile to load the alarm profile on the node.

The alarms that belong to the selected alarm profile appear in the Alarms for Profile sub-section.


Associate Alarm Profiles

Use this task to associate alarm profiles with the resources such as ports, cards, chassis, passive units, optical cross-connects, and optical interfaces.

Before you begin

Log into Cisco Optical Site Manager

Procedure


Step 1

Click Fault Monitoring in the left panel.

Step 2

Click the Profiles tab.

Step 3

Click Profile Association to expand the section.

Step 4

Click the + button above the Association column.

The Profile Association dialog box appears.

Step 5

Enter the name of the association in the Association field.

Step 6

Select the alarm profile from the Profile drop-down list.

Step 7

Click Apply.

The association name and profile is displayed in the list under the Association and Profile column.

Step 8

Select the check-box corresponding to the association you want to associate with a resource and click Load Association.

Step 9

Click the + button above the Resource Type column to associate a resource to the association.

The Resource dialog box appears.

Step 10

Select a resource from the Resource Type drop-down list.

The Resource Type drop-down list contains all the resources to which the alarm profile can be associated. Multiple resources can be associated with the same alarm profile. The other drop-down list options in the Resource dialog box may vary based on the selected resource type.

Step 11

Choose the desired values from the other drop-down lists in the Resource dialog box.

Step 12

From the Inherited drop-down list, choose true or false to indicate whether the association must be applied to all the children of this resource or not.

Step 13

Click Apply.

When the alarm profile is associated with the resources, all the outstanding and new alarms matching these resources are immediately set with the new alarm severities.