Identify Worst-Case Traffic Utilization
Worst case is the highest utilization that a particular interface experiences over all the failure sets and traffic levels that you selected. Cisco Crosswork Planning determines which combination of failures would cause this worst-case utilization.
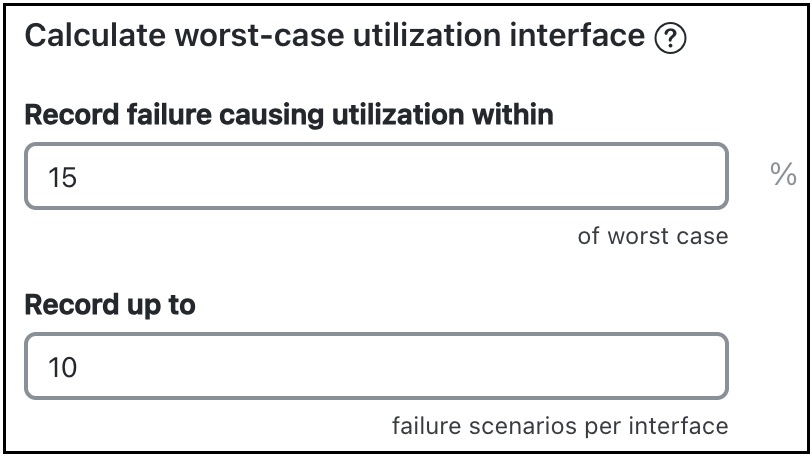
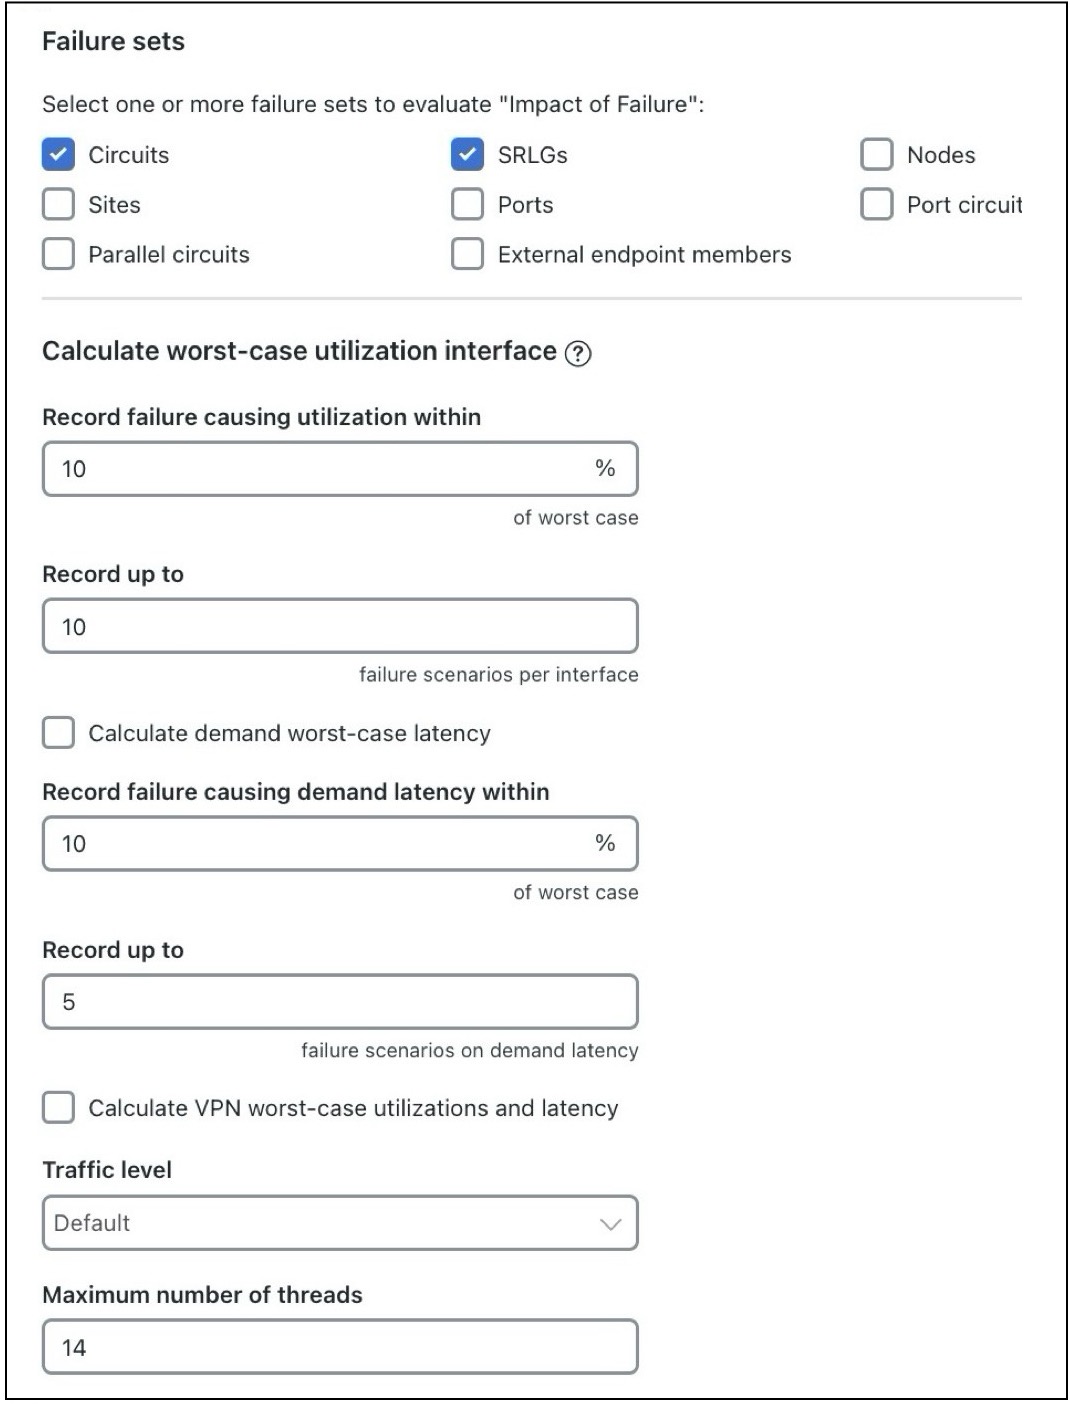
The default analysis is to identify up to 10 failures for the worst-case utilization on each interface in the network. Alternatively, you can record failures causing utilizations within a specified percent of the worst-case utilization. To control the number of threads that Cisco Crosswork Planning processes in parallel when examining failure scenarios, set the Maximum number of threads field. For details on how to run the Simulation analysis, see Run Simulation Analysis.
Upon finishing the analysis, Cisco Crosswork Planning switches to the Worst-Case traffic view and updates the plot to simultaneously display the worst-case utilization for all interfaces.
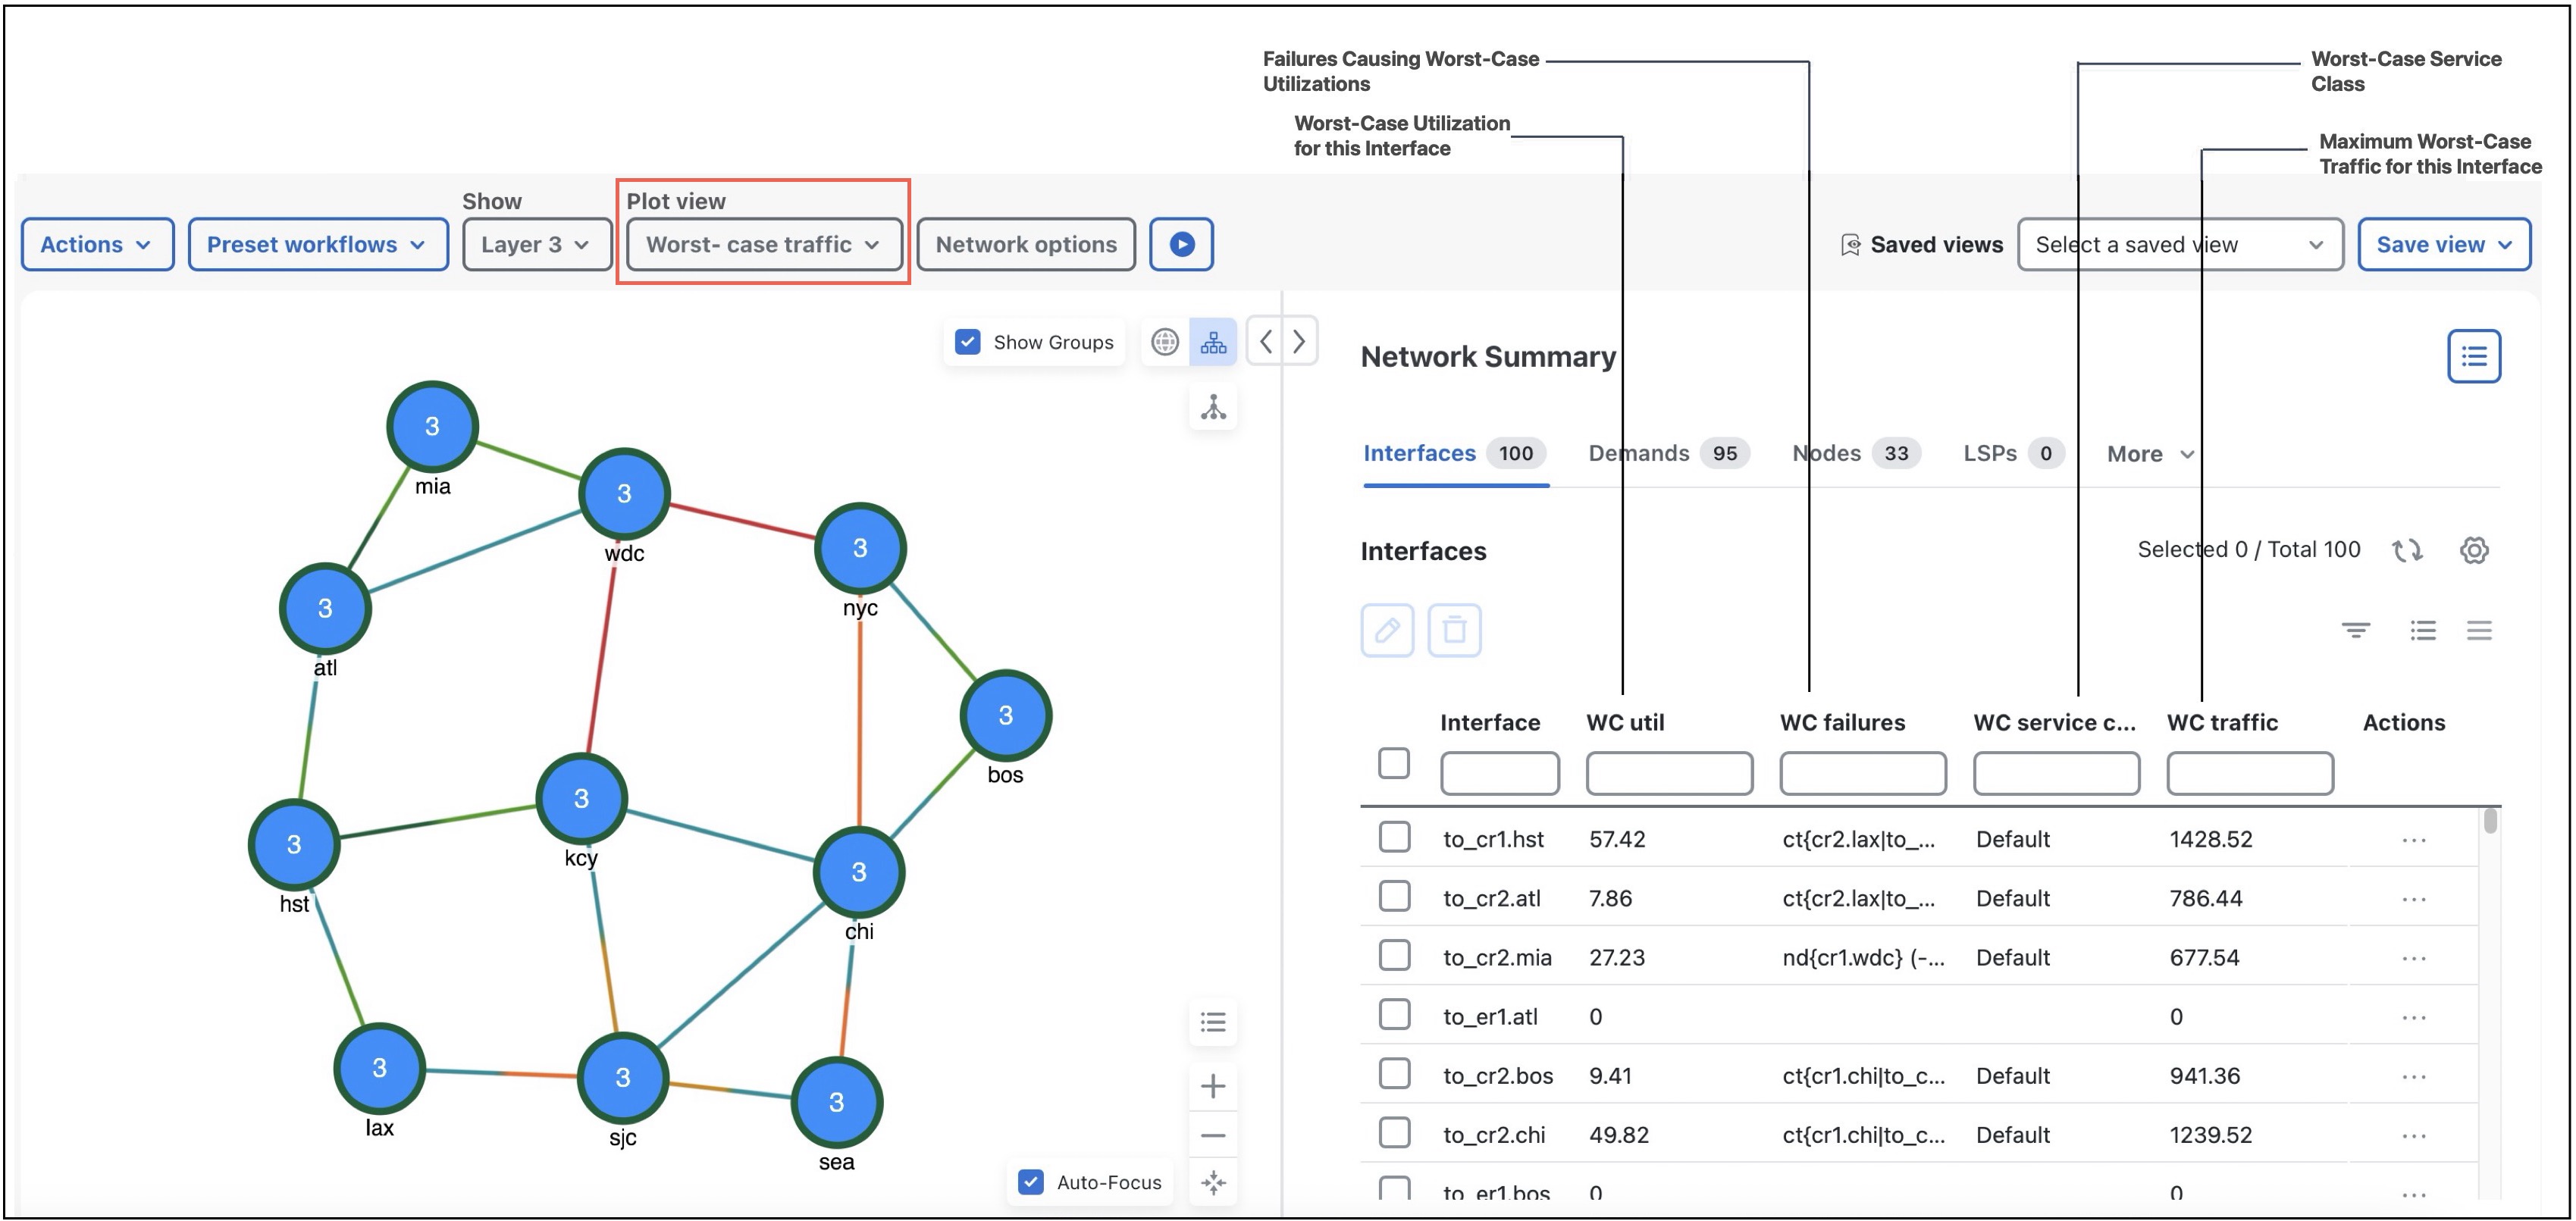
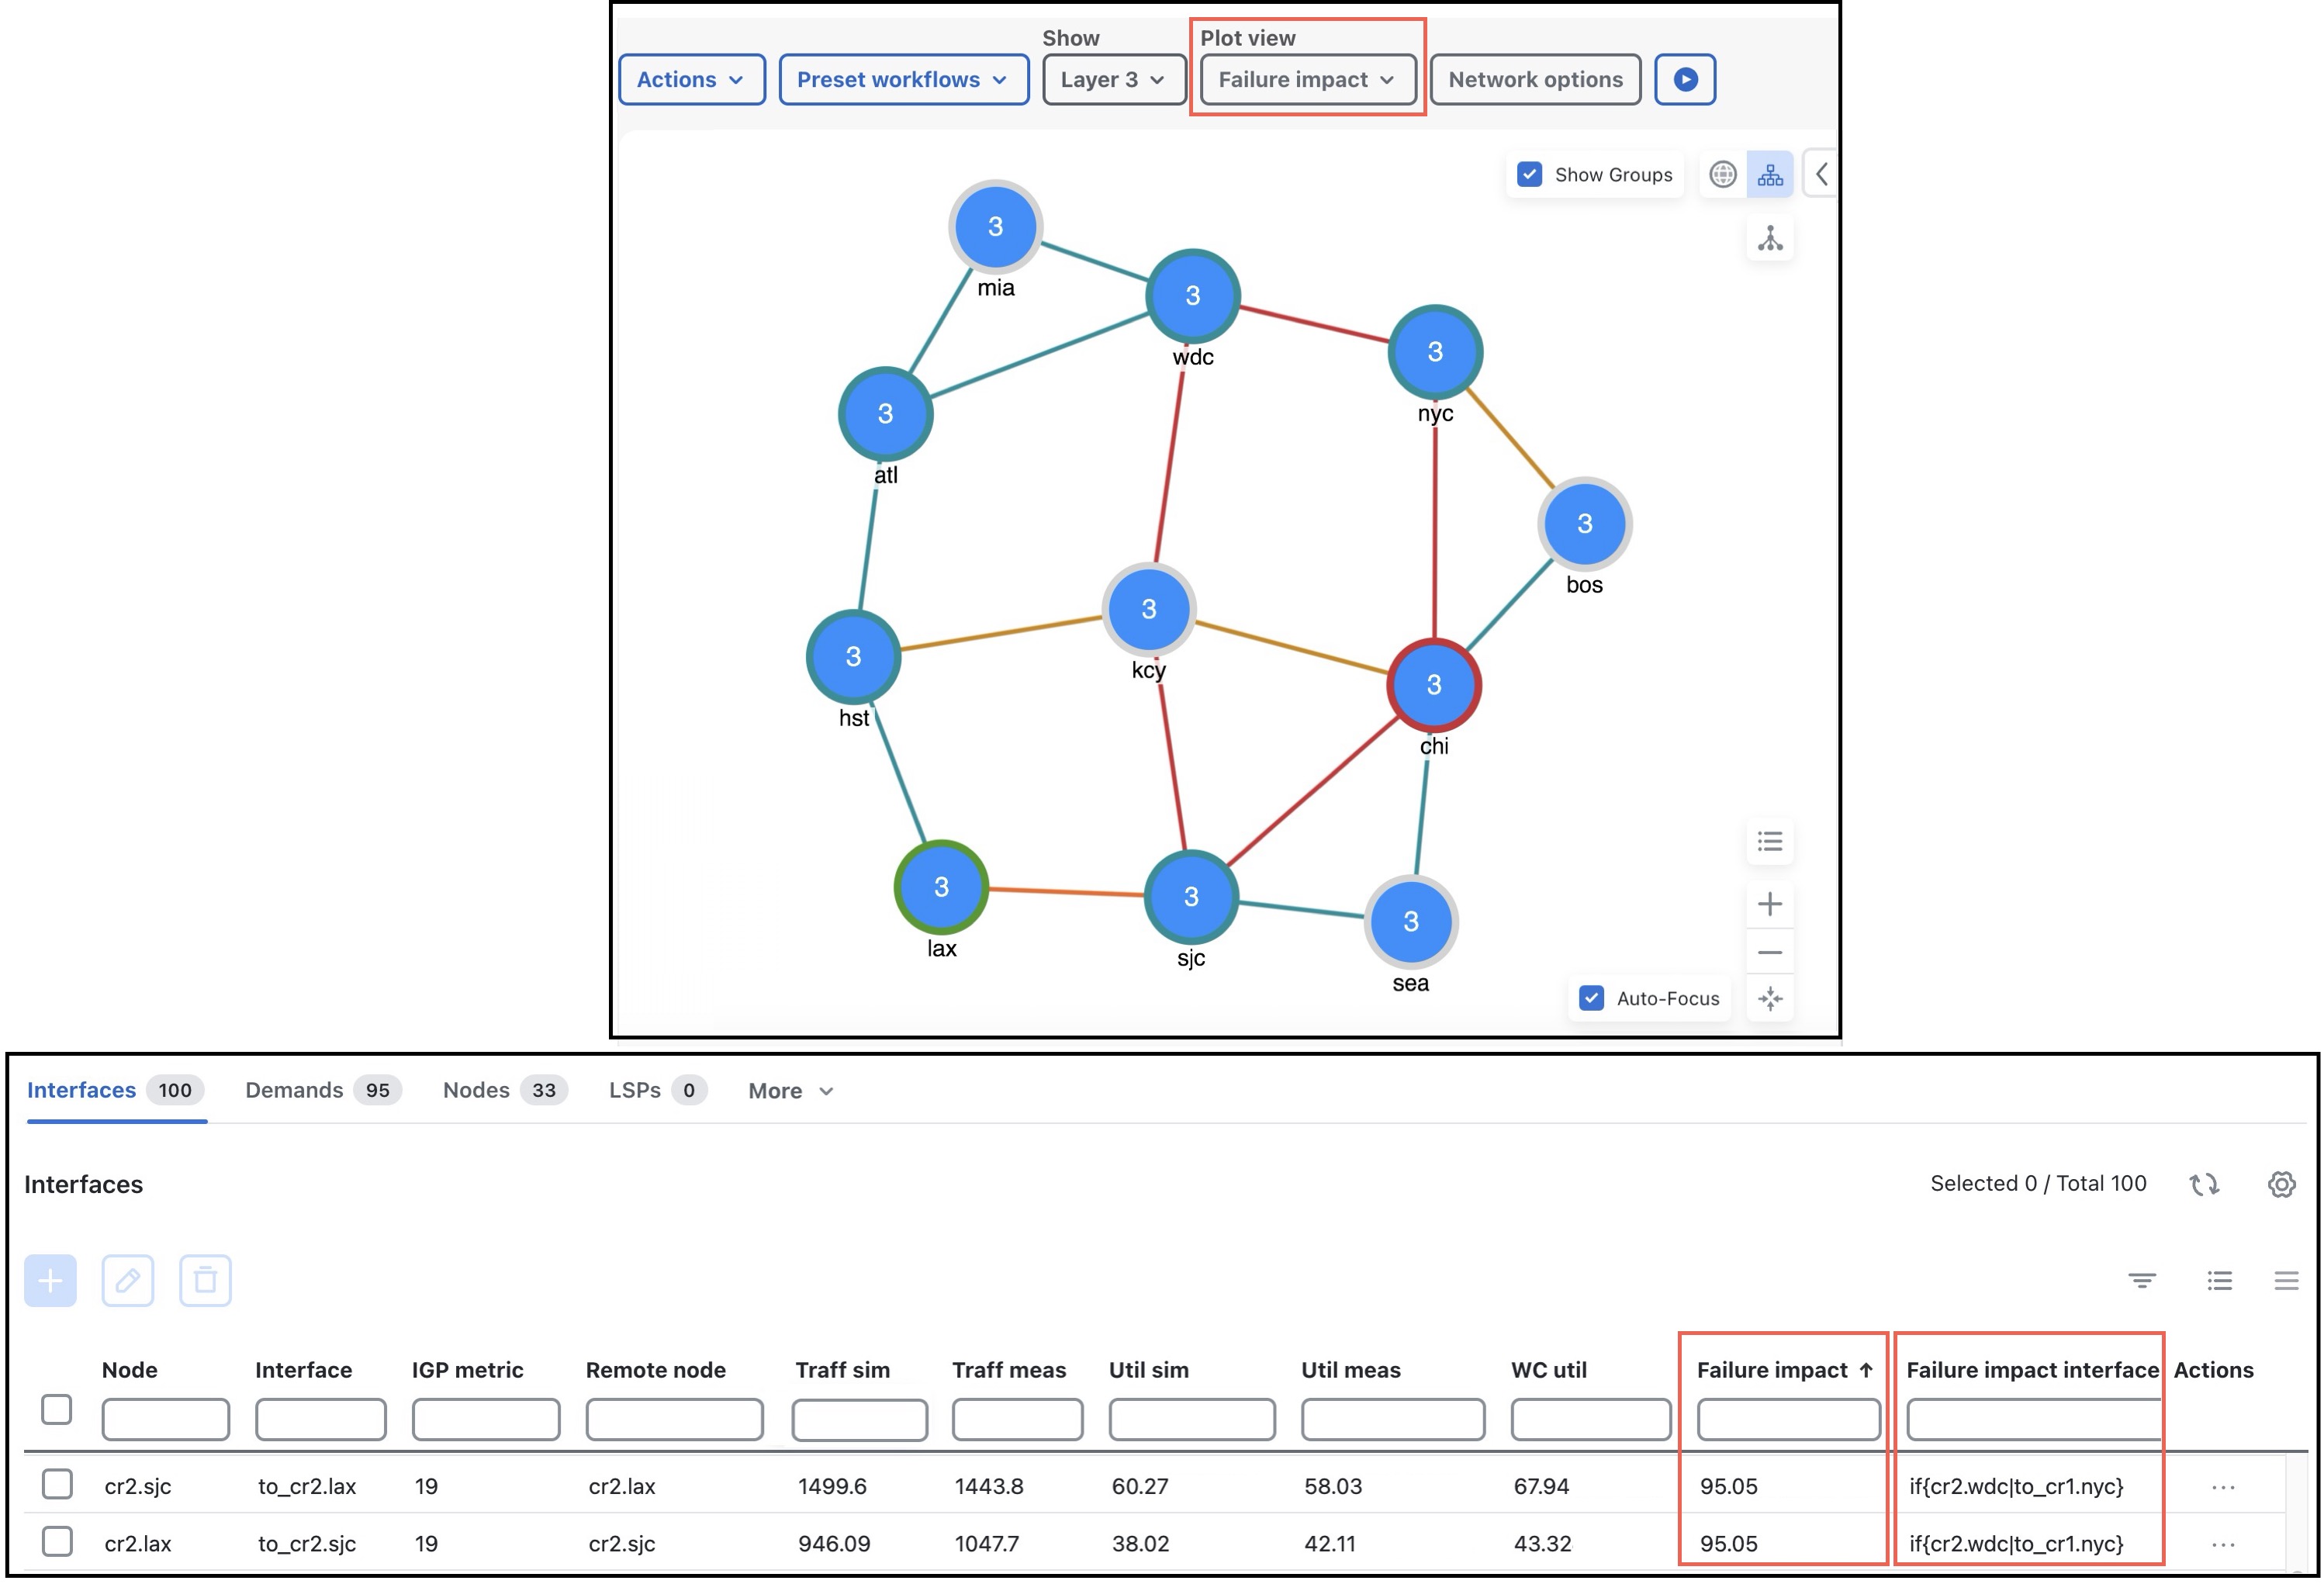
In addition to Plot view changes, the following columns are also updated in the Interfaces and Circuits tables upon finishing the Simulation analysis:
-
WC util—The worst-case utilization for that interface. The worst-case for a circuit is defined to be whichever of the worst cases of the two constituent interfaces results in the larger utilization. Thus, for circuits, this value is the larger of the WC util values for the two interfaces in the circuit.
-
WC traffic—The actual traffic (Mbps) through the interface under the worst-case scenario.
-
WC traff level—The traffic level under which this worst-case scenario occurs.
-
WC failure—List of one or more failures that cause the worst-case failure of the circuit. An easier way to read this list is to select an interface and use
 > Fail to WC.
If you record failures causing utilizations within a given percent of worst case, this column shows QoS violations as a percent. (See Identify Worst-Case QoS Violations.) If the number is positive, then the allotted capacity has been surpassed. If negative, the capacity has not been surpassed. For example, if a circuit has 10,000 Mbps capacity, and if the amount of traffic on it as a result of three different failures is 11,000, 8000, and 4000 Mbps, the utilizations are 10%, –20%, and –60%, respectively, and in descending order.
-
WC service class—The service class for which this worst-case scenario occurs.
For information on running a Simulation analysis with QoS, see Identify Worst-Case QoS Violations.
For information on worst-case calculations for VPNs, see Simulate VPN.
Identify Worst-Case QoS Violations
Cisco Crosswork Planning includes QoS bound (maximum available capacity) as part of the worst-case calculations. If there are no QoS parameters set, then the QoS bound is 100% and violations occur if utilization goes over that 100%. However, if a worst-case policy has been set on a service class or if interface queue parameters have been set, then worst-case QoS violations are calculated. In these instances, Cisco Crosswork Planning identifies the interface with the highest percentage of QoS violation as the worst-case possibility.
The following columns are updated accordingly.
-
WC QoS bound—The worst-case interface capacity available without violating these QoS requirements. This value is based on available capacity, traffic utilization, worst-case policies set on service classes, and interface queue parameters.
The WC QoS bound (%) column identifies this same value as a percentage of the total capacity.
-
WC QoS violation—The worst-case traffic minus the worst-case capacity permitted (WC QoS bound). A violation occurs if the QoS capacity allotted through worst-case policies for service classes is exceeded or if QoS capacity allotted through interface queue parameters is exceeded. If the number appearing in the WC QoS violation column is positive, then the allotted capacity has been surpassed. If negative, the capacity has not been surpassed.
The WC QoS violation (%) column identifies this same value as a percentage of total capacity.
To see the cause of worst-case QoS violations, select a circuit and use
 > Fail to WC. The page that appears lists all causes of this circuit’s worst-case utilization and its worst-case QoS violations. Choose
the worst-case failure to view, and click Submit.
-
WC service class—The service contributing to the worst-case QoS violation.
|
For more information on... |
See... |
|---|---|
|
|
|
Worst-case QoS calculations for VPNs |
Fail Circuits to Worst-Case Utilization
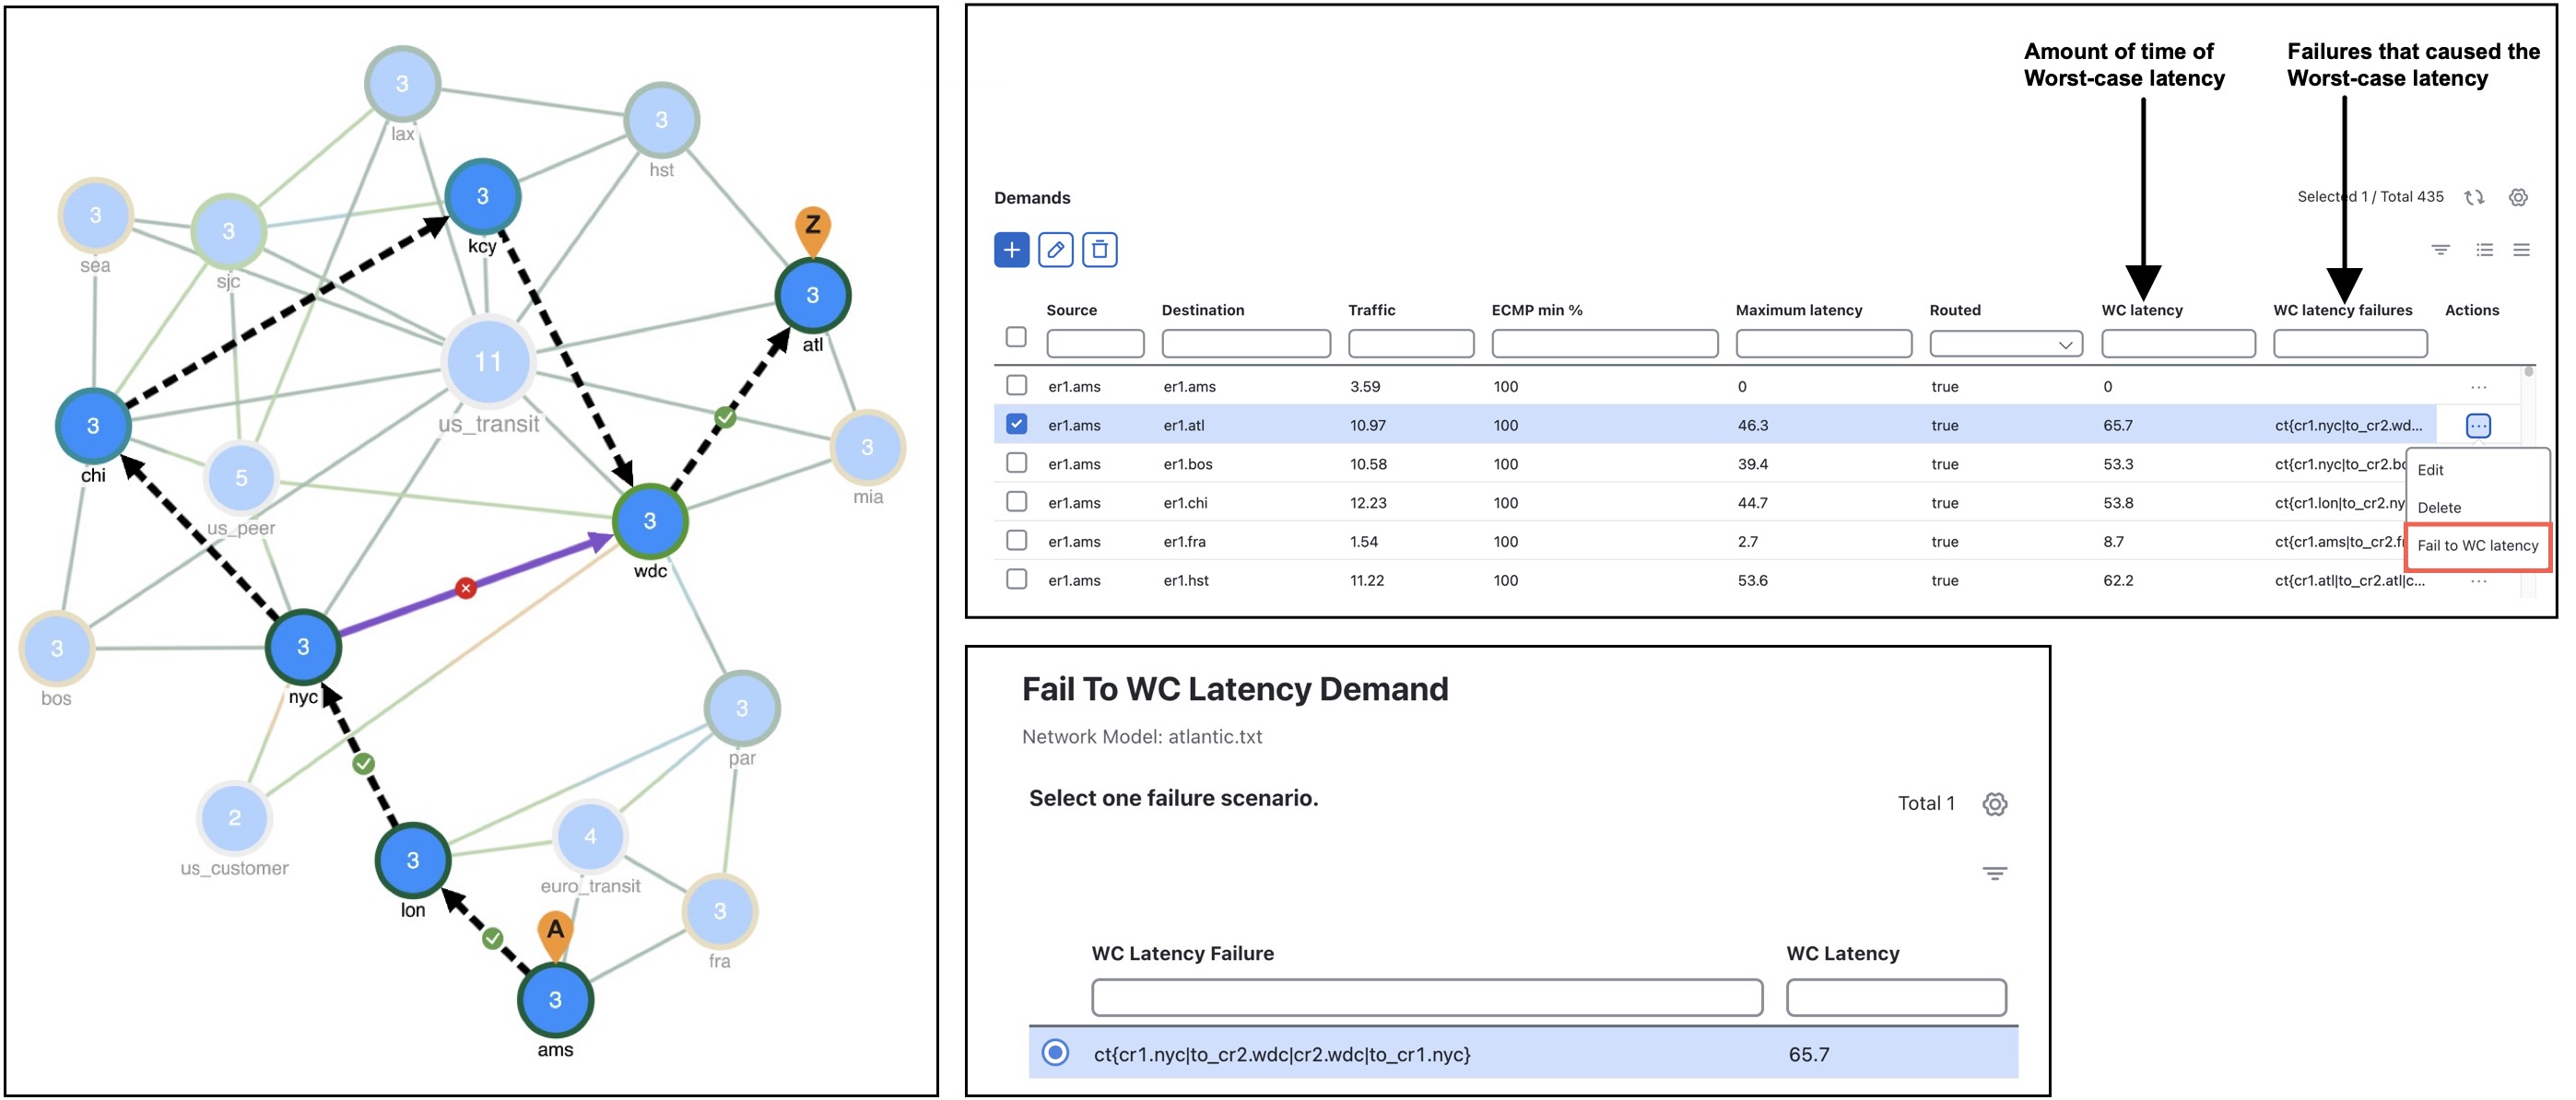
After running Simulation analysis (see Run Simulation Analysis), you have the option to selectively view each failure scenario that causes the worst-case utilization or worst-case QoS violation for a single interface.
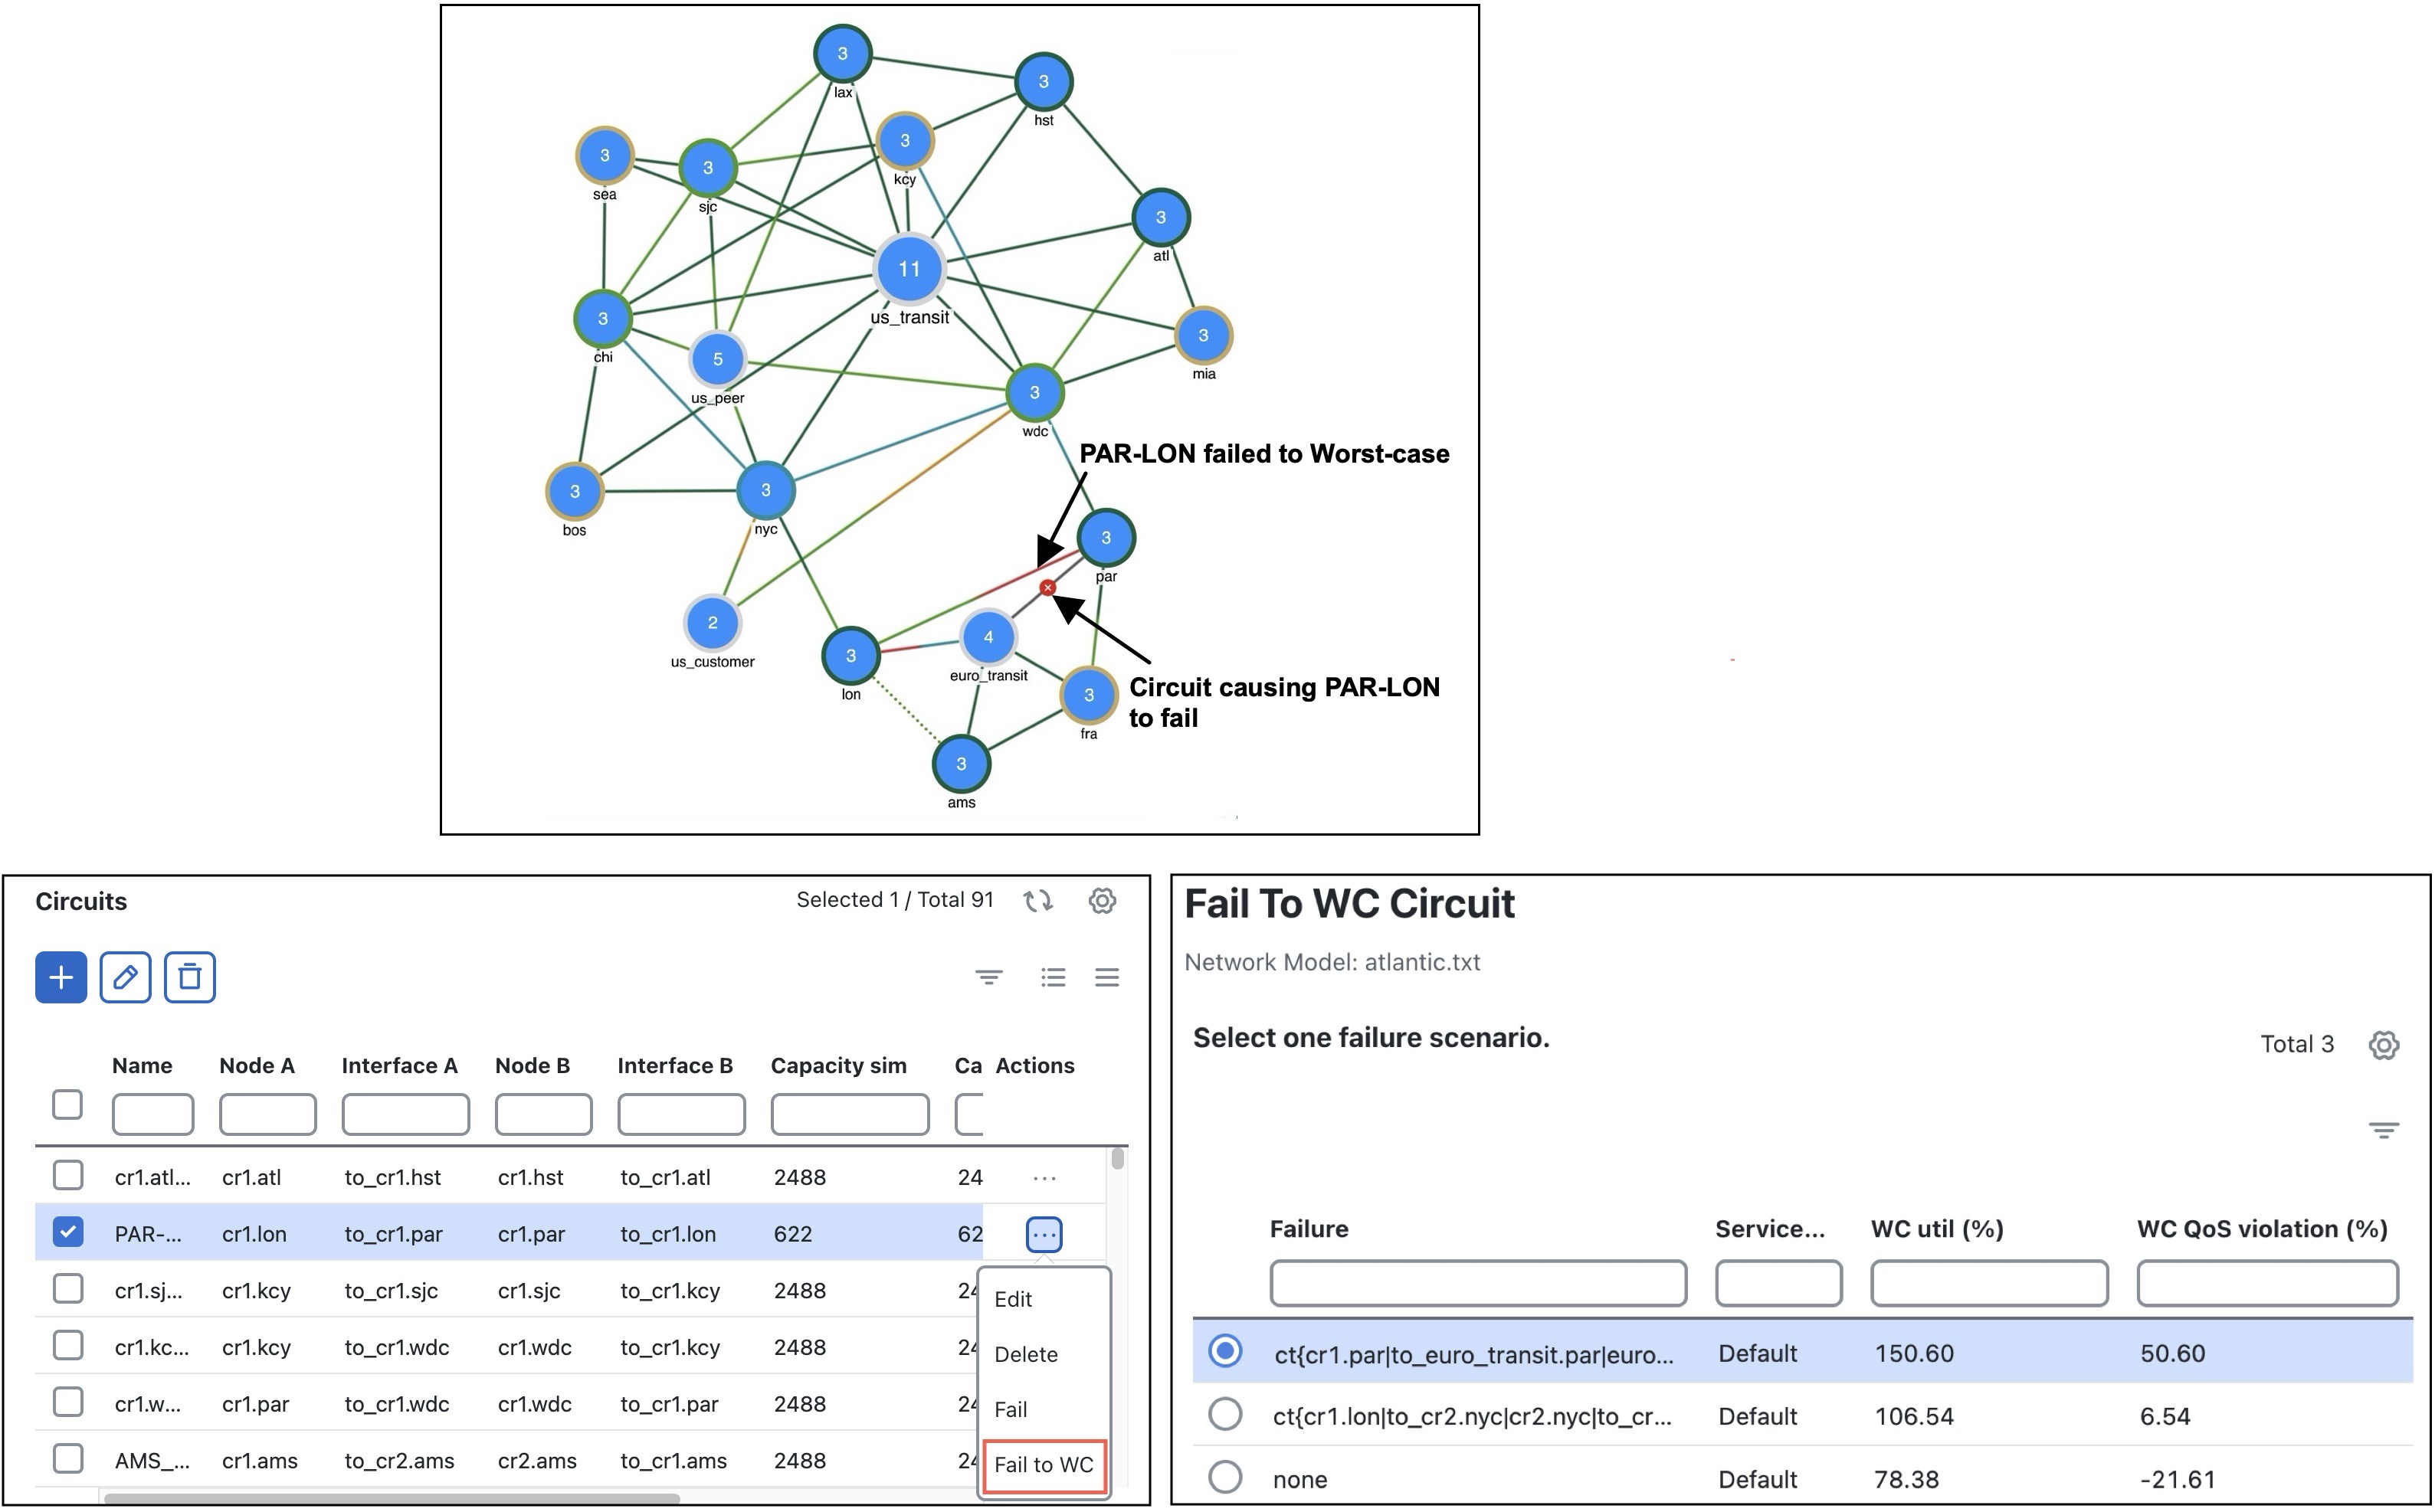
If there are multiple possibilities for a worst-case failure, or if there is a range of failures within a percentage of the worst-case failure (listed in the WC failures column), the Fail to WC page lists each failure, its worst-case utilization percent, and its QoS violation percent (see Failure of Single Circuit to Its Worst-Case).
 Note |
If you choose an interface, you are actually failing its associated circuit to its worst case. |
To fail the interface/circuit to its worst-case utilization, do the following:
-
In the Worst-case traffic view, select the desired interface or circuit from their respective tables.
-
From the Actions column, choose
 > Fail to WC.
The Fail to WC Interface (or Circuit) page appears.
-
Choose the failure scenario of interest (see Failure of Single Circuit to Its Worst-Case).
-
Click Submit.
The network plot changes to show this particular failure scenario (see Failure of Single Circuit to Its Worst-Case).
 Feedback