Overview of Environmental Analytics App
The Cisco Spaces Environmental Analytics app helps you optimize your building's performance using indoor environment insights or metrics data from the available sensors. These insights are derived from sensors integrated into the networking and collaboration infrastructure throughout your buildings within your network.
Use the Environmental Analytics app to measure and analyze the environmental analytics metrics data such as carbon dioxide, Total Volatile Organic Compound (TVOCs), ambient noise, temperature, and relative humidity and take the required corrective actions.
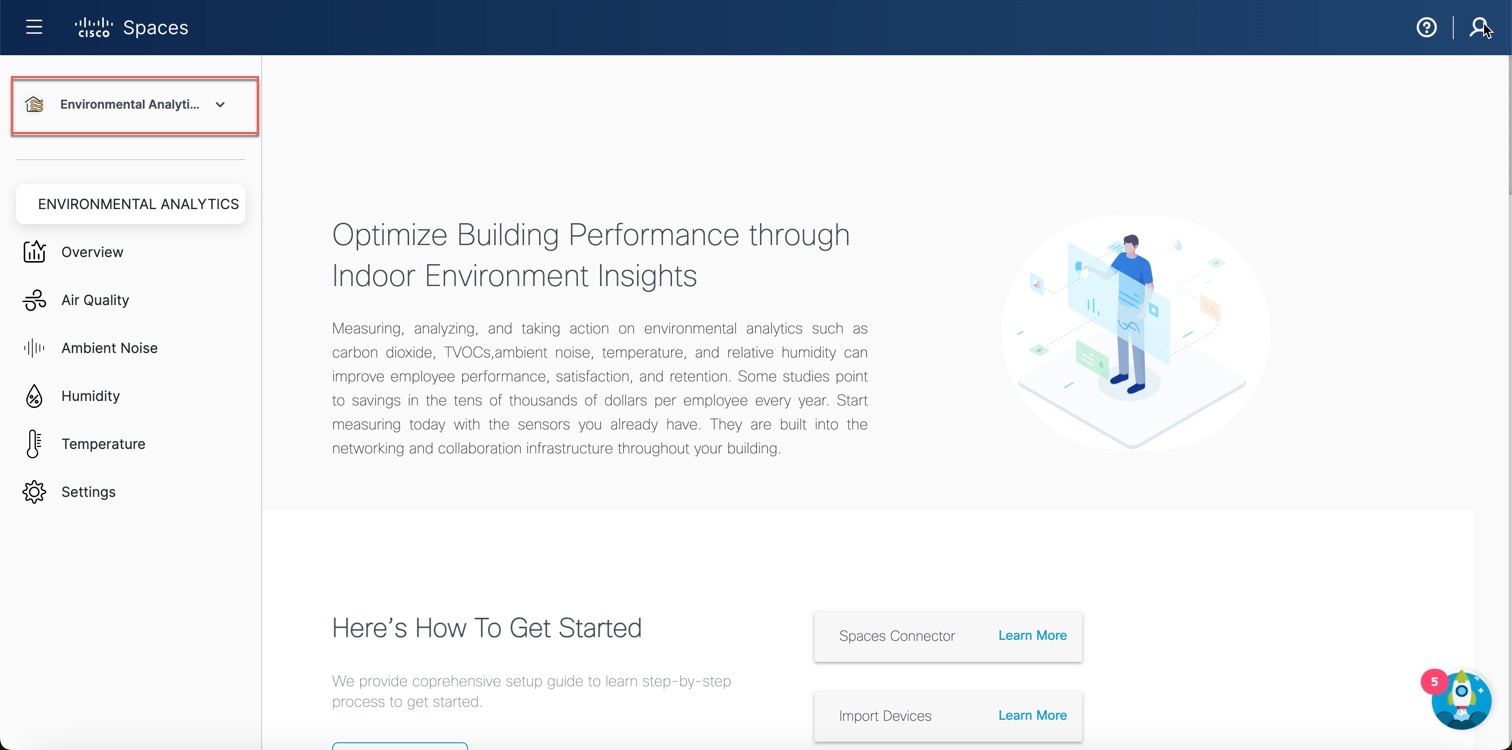
In a Day 0 configuration scenario, the Environmental Analytics Overview window is displayed with information about the recommended environmental levels. For more information, see Recommended Environmental Levels.
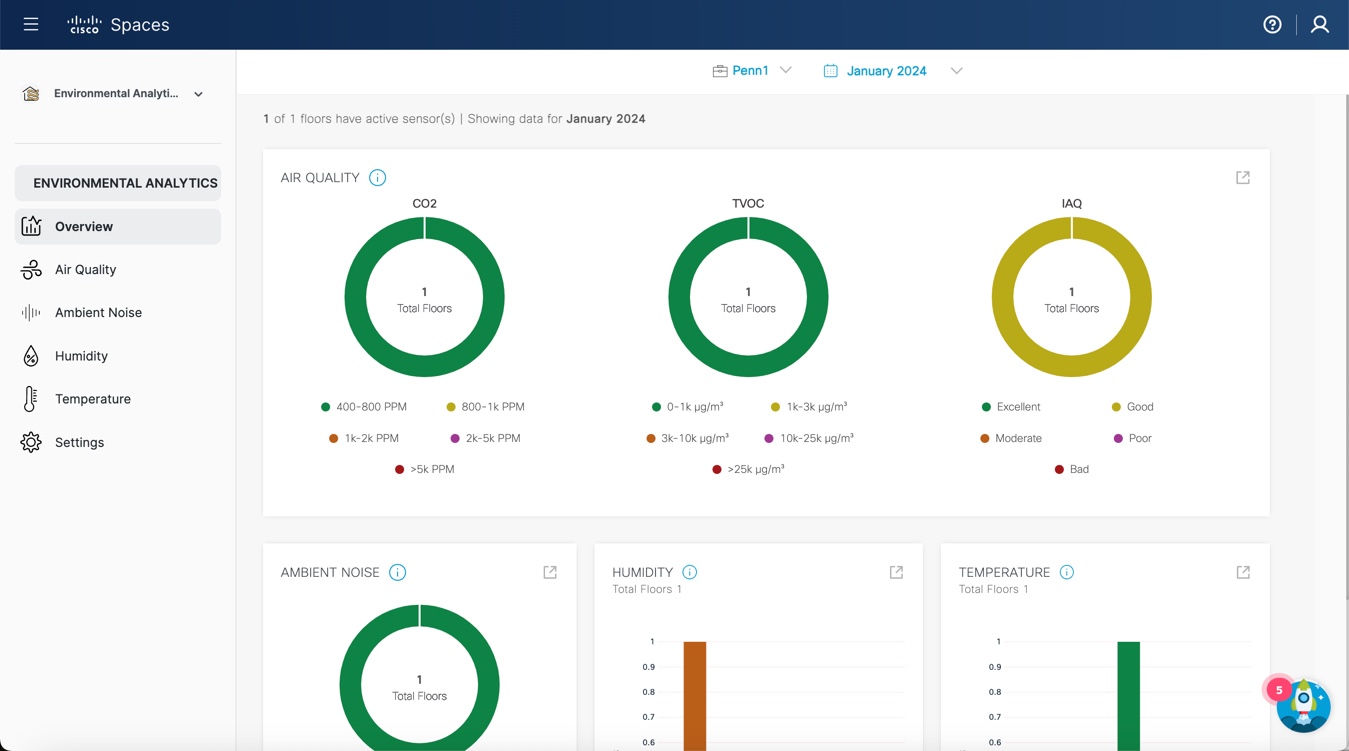
The Environmental Analytics app presents the following environment insight views:
-
Floor View: Provides insights of your building's performance with historical data and trends about specific hours and days.
-
Floor Comparison: Provides information about multiple floors ranked by their performance whether averages or cumulative time spent out of the ideal range.

Prerequisites for the Environmental Analytics App
To use the Environmental Analytics app, you must:
-
Import the sensor devices to gather the Environmental Analytics metrics data. Click Import Devices to open the Import Devices for Environmental Metrics window to import sensor devices from any of the following options:
-
Cisco Webex Control Hub
-
Meraki Things
-
Cisco Catalyst Wireless Access Points (9136/9166): To use Cisco Catalyst Wireless Access Points (9136/9166) for Environmental Analytics app, you must integrate with the Catalyst Center, import maps, or use Cisco Prime Infrastructure map imports.
-
Any third-party loT Sensors
-
-
Have an active Cisco Spaces: Connector available. For more information, see Cisco Spaces: Connector 3 Configuration Guide.
In the Environmental Analytics app Home page, a green tick mark against each of the above-mentioned items indicates the successful fulfillment of the corresponding prerequisite.

 Feedback