Working with Cisco Spaces: Environmental Analytics App

Viewing Sensor Performance Data

The Overview window displays the performance data of the active sensors available in the floors of the building. The data is displayed for the selected floor for the selected month. Use this data for your analysis.

Procedure


Step 1

In Cisco Spaces, click the Menu icon () and choose Home > ACT Apps > Environmental Analytics app tile.

Optionally, from the Dashboard drop-down list (left navigation pane of the Cisco Spaces Home window), select Environmental Analytics.

The Environmental Analytics window is displayed.

Step 2

In the left navigation pane, click Overview.

The Overview window displays the sensor performance data of the active sensors available in the selected root location or the floor for the month.

Step 3

View the sensor data organized as per the following sections:

  • Air Quality: Displays the sensor performance data for TVOC, IAQ and PM2.5.

  • Ambient Noise: Displays the sensor performance data for ambient noise levels.

  • Humidity: Displays the sensor performance data for humidity levels.

  • Temperature: Displays the sensor performance data for temperature levels.

Step 4

(Optional) To view the sensor data for a different floor or month:

  1. From the Location drop-down list, select the root location or floor.

  2. From the Month drop-down list, select another month.

Step 5

Click the icon to open the corresponding parameter configuration window to perform the required updates.

Configuring Environmental Analytics Parameters

Use the Settings tab in the Environmental Analytics app to configure the parameters. Configure these parameters to view the sensor data in the other tabs.

Procedure


Step 1

In Cisco Spaces, click the Menu icon () and choose Home > ACT Apps > Environmental Analytics app tile.

Optionally, from the Dashboard drop-down list (left navigation pane of the Cisco Spaces Home window), select Environmental Analytics.

The Environmental Analytics window is displayed.

Step 2

In the left navigation pane, click Settings.

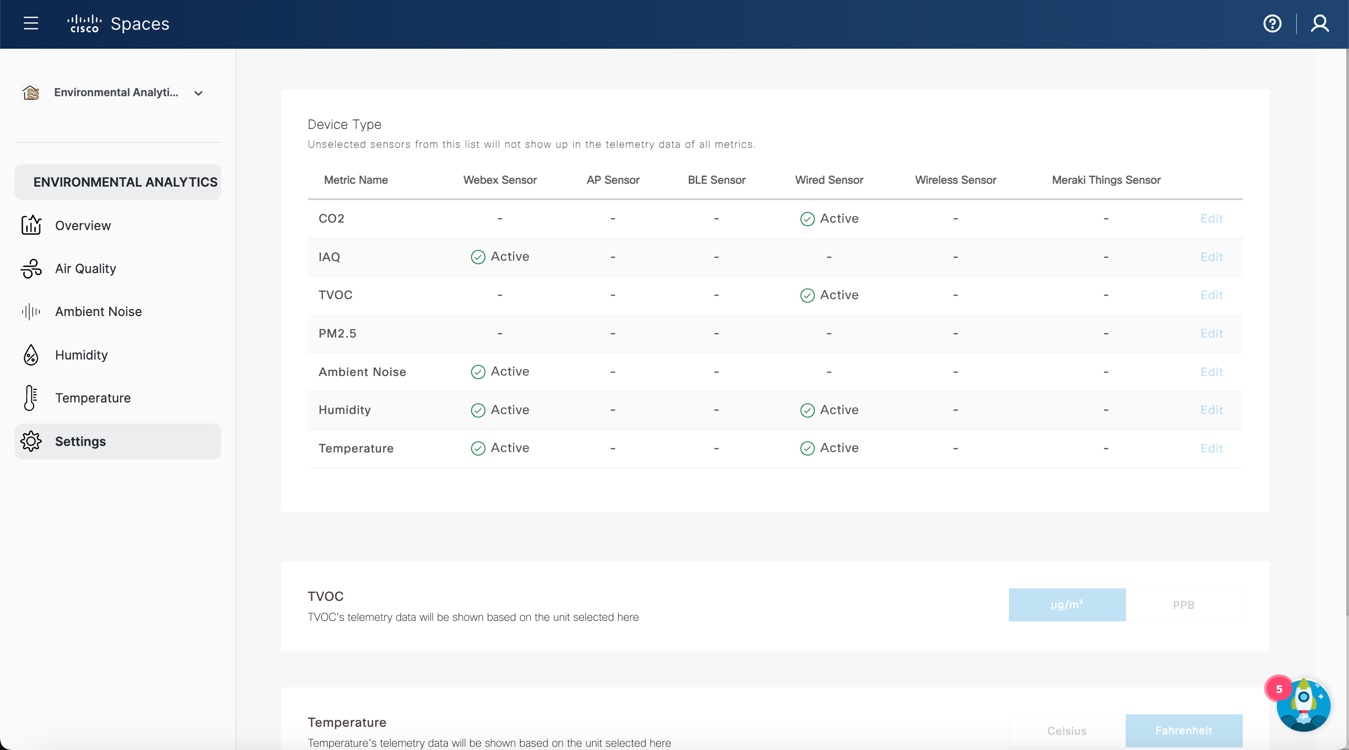
The Environmental Analytics Settings window is displayed with the telemetry metrics of all sensor devices.

Figure 1. Settings

Step 3

In the Device Type section, view the following metrics:

  • CO₂

  • IAQ

  • TVOC

  • PM2.5

  • Ambient Noise

  • Humidity

  • Temperature

Step 4

For each metric, view the following sensor details:

  • Webex Sensor

  • AP Sensor

  • BLE Sensor

  • Wired Sensor

  • Wireless Sensor

  • Meraki Things Sensor

Note


To view the supported telemetry types, see Supported Telemetry Types.

Step 5

Click Edit against the corresponding metric name.

Step 6

Check or uncheck the check box for the required sensor and click Save.

Click Cancel to discard the changes, if required.

Step 7

Click µg/m³ or PPB to set the unit for TVOC telemetry data.

The selected unit is highlighted in a blue background.

Step 8

Click Celsius or Fahrenheit to set the unit for temperature telemetry data.

The selected unit is highlighted in a blue background.


Supported Telemetry Types

The telemetry types supported for each device type are:

Table 1. Sensor and Supported Telemetry Types

Device Type

Supported Telemetry Types

Cisco Webex

  • Temperature

  • Ambient Noise

  • Humidity

  • IAQ

Wired

  • Temperature

  • Humidity

  • CO₂

  • TVOC

Access Point

  • Temperature

  • Humidity

  • CO₂

  • TVOC

  • IAQ

Wireless

  • Temperature

  • Humidity

BLE

  • Temperature

  • Humidity

  • CO₂

Meraki Things

  • Temperature

  • Ambient Noise

  • Humidity

  • TVOC

  • IAQ

  • PM2.5

  • CO₂

View Air Quality Parameters

Before you begin

Use the Settings tab to configure the Air Quality parameters.

Procedure


Step 1

In Cisco Spaces, click the Menu icon () and choose Home > ACT Apps > Environmental Analytics app tile.

Optionally, from the Dashboard drop-down list (left navigation pane of the Cisco Spaces Home window), select Environmental Analytics.

The Environmental Analytics window is displayed.

Step 2

In the left navigation pane, click Air Quality.

The Air Quality window includes the tabs: IAQ, CO2, TVOC, PM2.5.

Step 3

Click the IAQ tab.

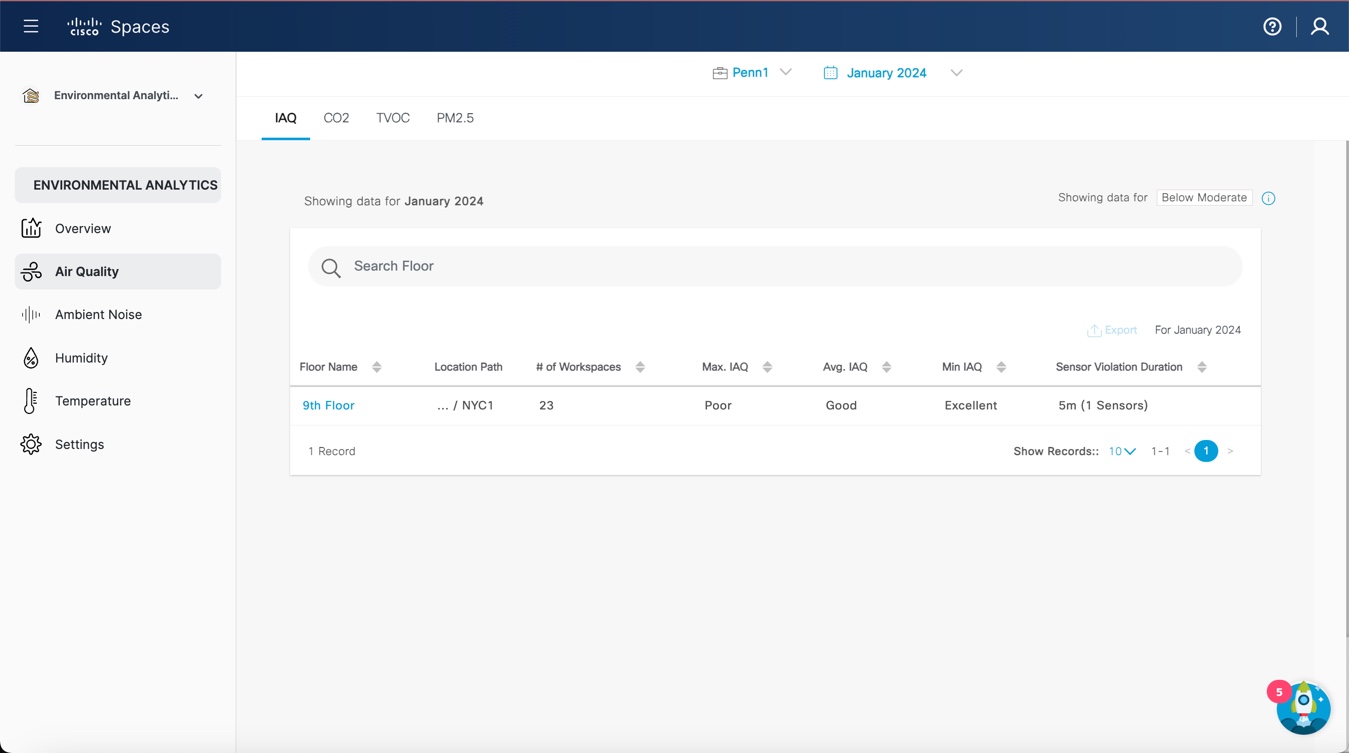
The floor data with IAQ value Below Moderate for the selected month is displayed.

Figure 2. Air Quality Parameters
  1. View the following telemetry details:

    • Floor Name: Click the floor name to view the details in the Floor window. The Floor Details window is displayed.

    • Location Path: Displays the floor location path.

    • # of Workspaces: Displays the number of workspaces.

    • Max. IAQ: Displays the maximum IAQ level for the particular floor.

    • Avg. IAQ: Displays the average IAQ level for the particular floor.

    • Min IAQ: Displays the minimum IAQ level for the particular floor.

    • Sensor Violation Duration: Displays the duration of sensor violation.

  2. To view IAQ details of another floor location, from the Location drop-down list, select another location.

  3. To view IAQ details of another month, from the Month drop-down list, select another month.

Step 4

Click the CO2 tab.

  1. Click Setup Devices to configure devices to generate CO2 measurements.

  2. After devices are set, the floor data with CO₂ value as Below 1000 ppm is displayed.

  3. View the following telemetry details:

    • Floor Name: Click the floor name to view the details in the Floor window.

    • Location Path: Displays the floor location path.

    • # of Workspaces: Displays the number of workspaces.

    • Max. CO2: Displays the maximum CO₂ level for the particular floor.

    • Avg. CO2: Displays the average CO₂ level for the particular floor.

    • Min CO2: Displays the minimum CO₂ level for the particular floor.

    • Sensor Violation Duration: Displays the duration of sensor violation.

  4. To view CO2 details of another floor location, from the Location drop-down list, select another location.

  5. To view CO2 details of another month, from the Month drop-down list, select another month.

Step 5

Click the TVOC tab.

The floor data with TVOC value as Below 3000 µg/m³ is displayed.

  1. View the following telemetry details:

    • Floor Name: Click the floor name to view the details in the Floor window.

    • Location Path: Displays the floor location path.

    • # of Workspaces: Displays the number of workspaces.

    • Max. TVOC: Displays the maximum TVOC level for the particular floor.

    • Avg. TVOC: Displays the average TVOC level for the particular floor.

    • Min TVOC: Displays the minimum TVOC level for the particular floor.

    • Sensor Violation Duration: Displays the duration of sensor violation.

  2. To view TVOC details of another floor location, from the Location drop-down list, select another location.

  3. To view TVOC details of another month, from the Month drop-down list, select another month.

Step 6

Click the PM2.5 tab.

The floor data with PM2.5 value as Below 35 µg/m³ is displayed.

  1. View the following telemetry details:

    • Floor Name: Click the floor name to view the details in the Floor window.

    • Location Path: Displays the floor location path.

    • # of Workspaces: Displays the number of workspaces.

    • Max. PM2.5: Displays the maximum PM2.5 level for the particular floor.

    • Avg. PM2.5: Displays the average PM2.5 level for the particular floor.

    • Min PM2.5: Displays the minimum PM2.5 level for the particular floor.

    • Sensor Violation Duration: Displays the duration of sensor violation.

  2. To view PM2.5 details of another floor location, from the Location drop-down list, select another location.

  3. To view PM2.5 details of another month, from the Month drop-down list, select another month.

Step 7

(Optional) Use the following options if required:

  • Search: Use this field to search for the required floors.

  • Export: Use this option to export the environmental sensor telemetry details as a comma-separated values file.

  • Show Records: Use the drop-down to select the number of records to be displayed in the tab. Use the forward and backward arrows to navigate to the other page records.

Step 8

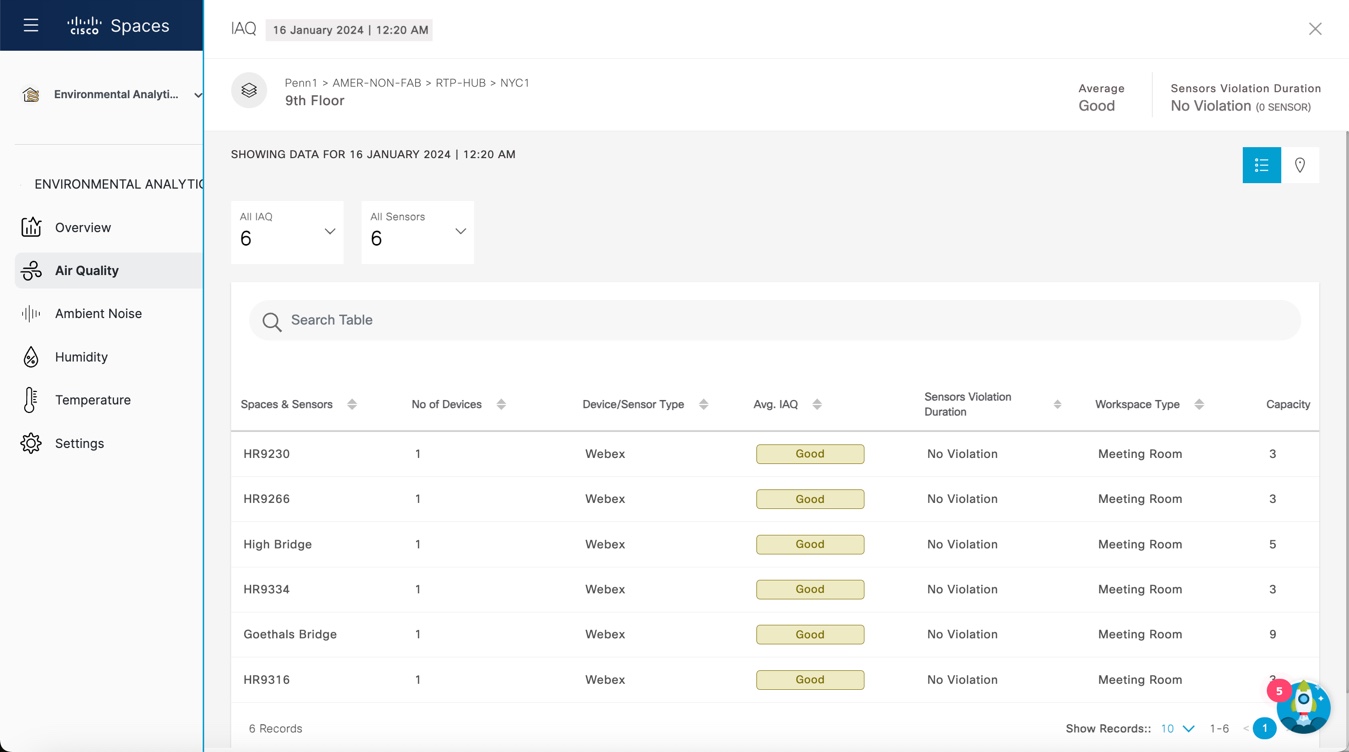
Click any floor name to view the sensor performance data for the selected floor in detail. For more information, see Viewing Sensor Data in Floor View.

Figure 3. Air Quality Parameters: Floor View

View Ambient Noise Parameters

Before you begin

Use the Settings tab to configure the Ambient Noise parameters.

Procedure


Step 1

In Cisco Spaces, click the Menu icon () and choose Home > ACT Apps > Environmental Analytics app tile.

Optionally, from the Dashboard drop-down list (left navigation pane of the Cisco Spaces Home window), select Environmental Analytics.

The Environmental Analytics window is displayed.

Step 2

In the left navigation pane, click Ambient Noise.

The floor data with Ambient Noise value Below 40 dBa for the selected month is displayed.

Step 3

In the window that is displayed, view the following telemetry details:

  • Floor Name: Click the floor name to view the details in the Floor window.

  • Location Path: Displays the floor location path.

  • # of Workspaces: Displays the number of workspaces.

  • Max. Ambient Noise: Displays the maximum Ambient Noise level for the particular floor.

  • Avg. Ambient Noise: Displays the average Ambient Noise level for the particular floor.

  • Min Ambient Noise: Displays the minimum Ambient Noise level for the particular floor.

  • Sensor Violation Duration: Displays the duration of sensor violation.

Step 4

(Optional) Use the following options if required:

  • Search: Use this field to search for the required floors.

  • Export: Use this option to export the environmental sensor telemetry details as a comma-separated values file.

  • Show Records: Use the drop-down to select the number of records to be displayed in the tab. Use the forward and backward arrows to navigate to the other page records.

Step 5

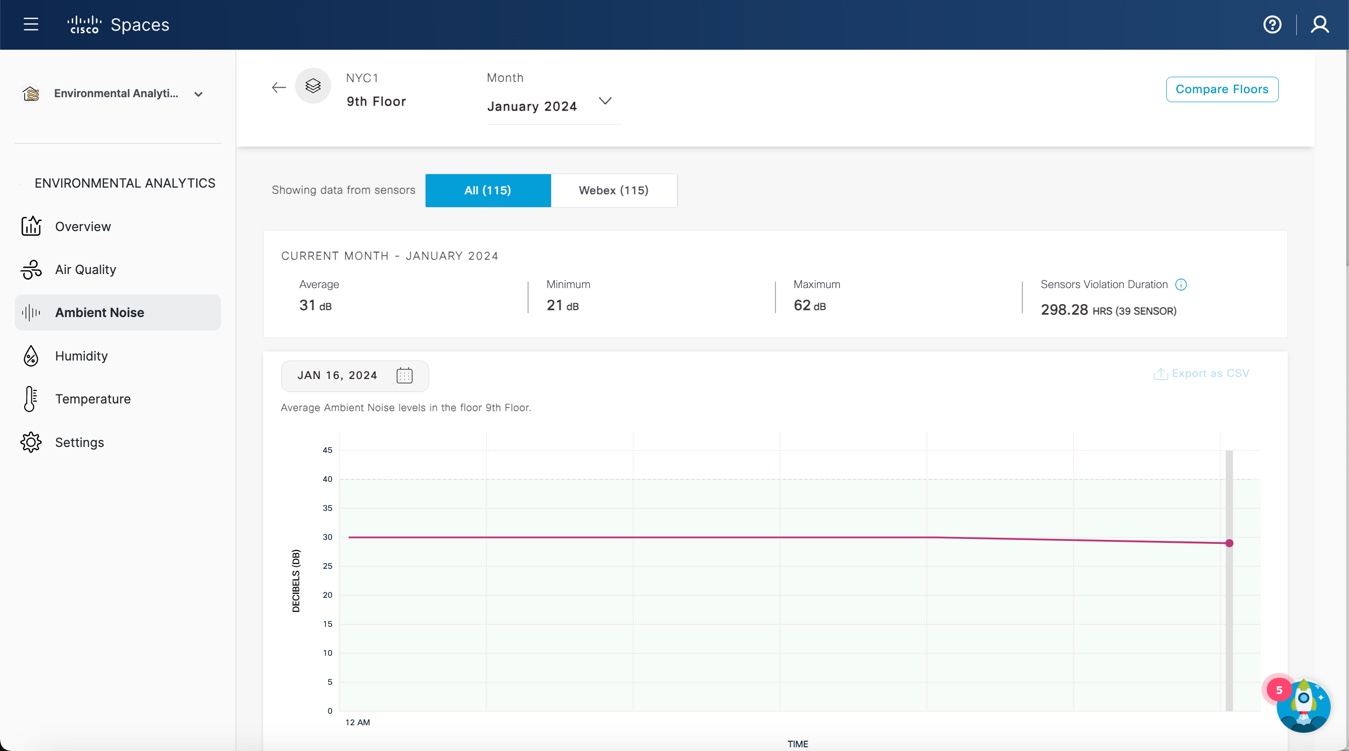
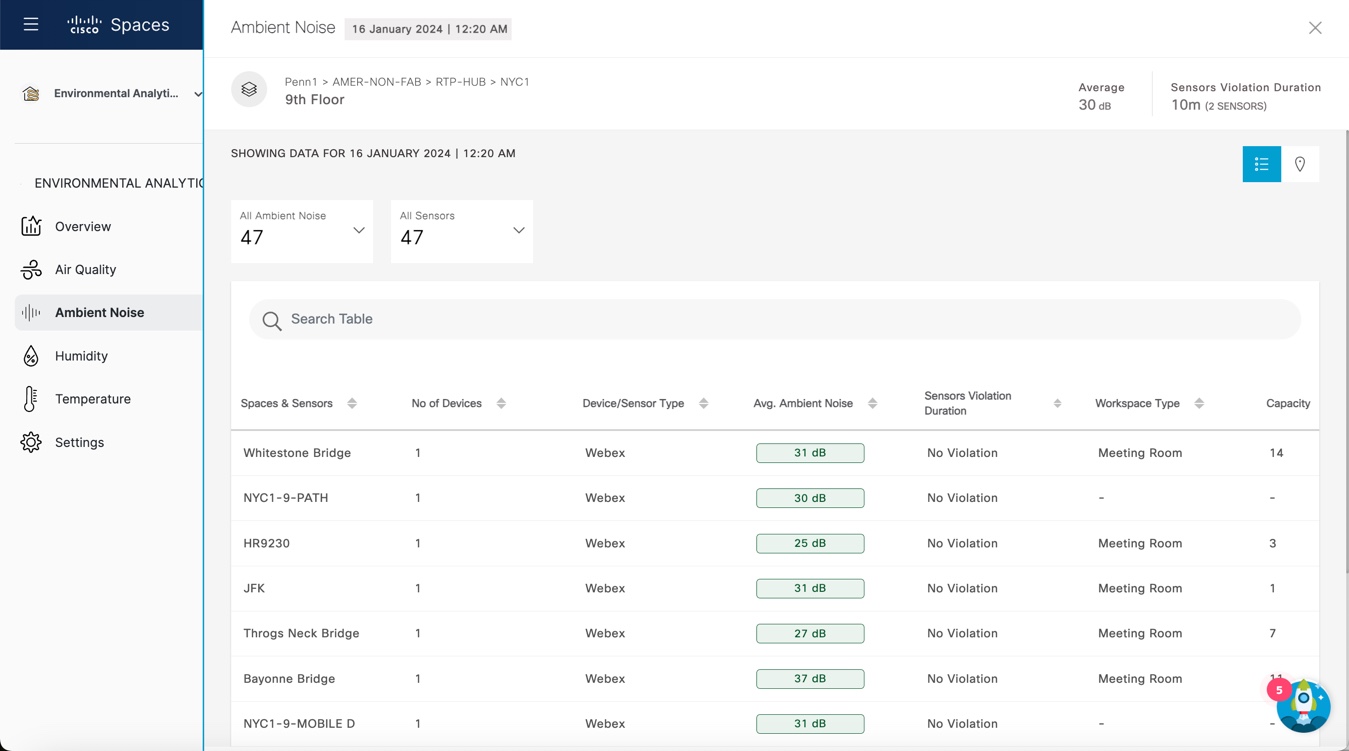
If you already clicked a floor name to view other sensor data in floor view, the Ambient Noise window is also displayed in Floor View. For more information, see Viewing Sensor Data in Floor View.

Figure 4. Ambient Noise: Floor View

View Humidity Parameters

Before you begin

Use the Settings tab to configure the Humidity parameters.

Procedure


Step 1

In Cisco Spaces, click the Menu icon () and choose Home > ACT Apps > Environmental Analytics app tile.

Optionally, from the Dashboard drop-down list (left navigation pane of the Cisco Spaces Home window), select Environmental Analytics.

The Environmental Analytics window is displayed.

Step 2

In the left navigation pane, click Humidity.

The floor data with Humidity value Between 30-60% for the selected month is displayed.

Step 3

In the window that is displayed, view the following telemetry details:

  • Floor Name: Click the floor name to view the details in the Floor window.

  • Location Path: Displays the floor location path.

  • # of Workspaces: Displays the number of workspaces.

  • Max. Humidity: Displays the maximum Humidity level for the particular floor.

  • Avg. Humidity: Displays the average Humidity level for the particular floor.

  • Min Humidity: Displays the minimum Humidity level for the particular floor.

  • Sensor Violation Duration: Displays the duration of sensor violation.

Step 4

(Optional) Use the following options if required:

  • Search: Use this field to search for the required floors.

  • Export: Use this option to export the environmental sensor telemetry details as a comma-separated values file.

  • Show Records: Use the drop-down to select the number of records to be displayed in the tab. Use the forward and backward arrows to navigate to the other page records.

Step 5

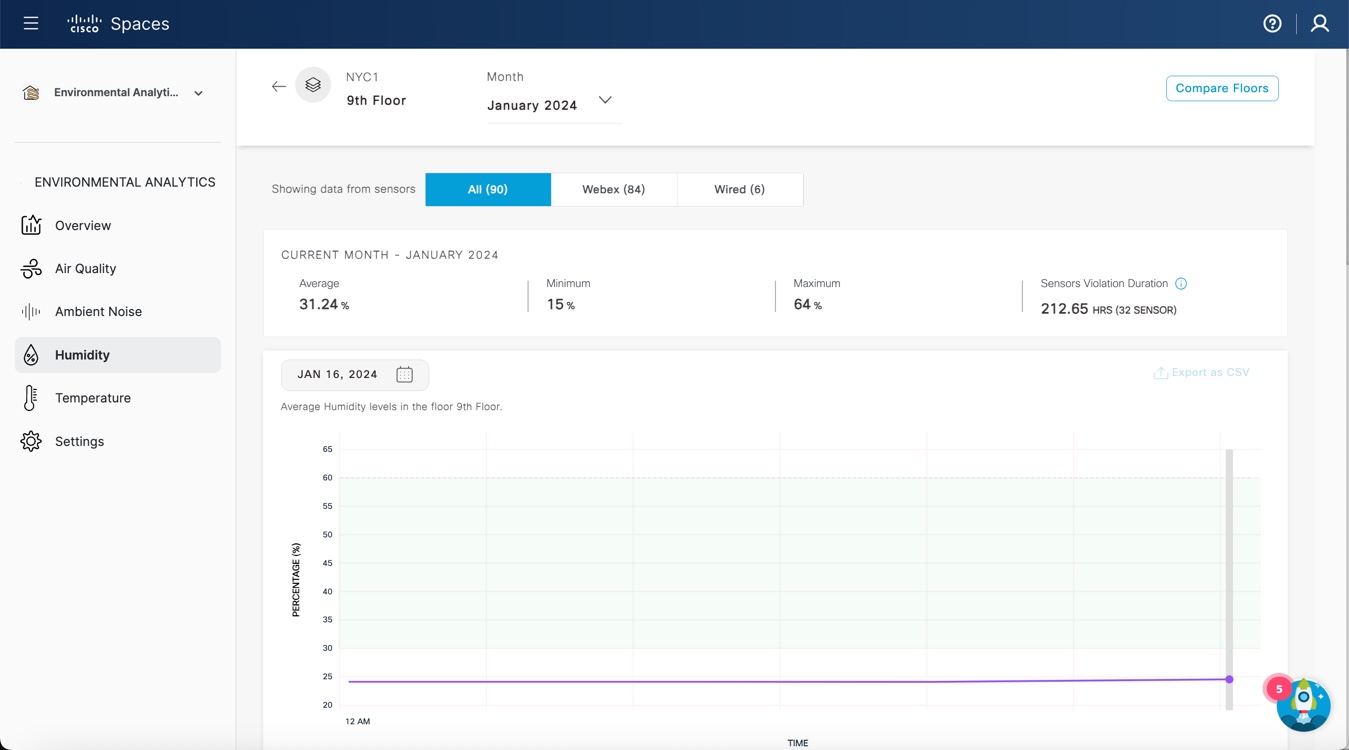
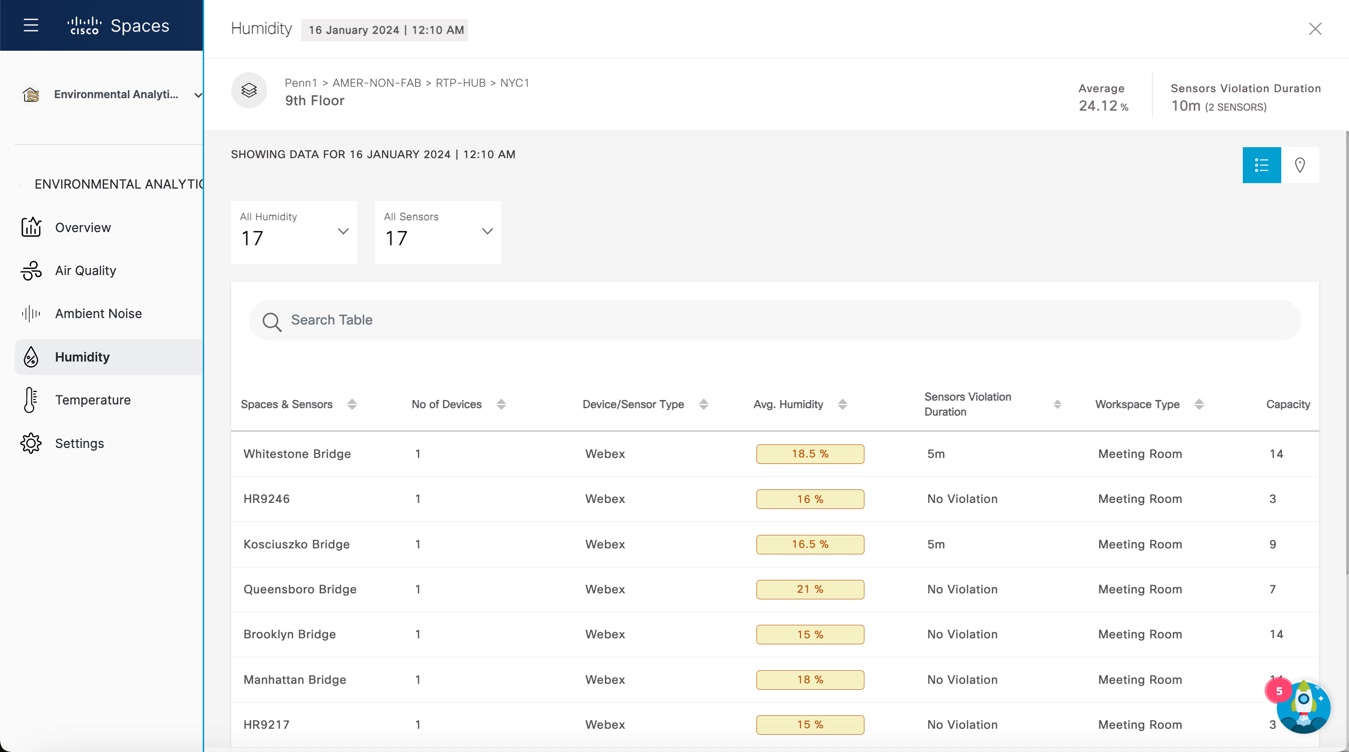
If you already clicked a floor name to view other sensor data in floor view, the Humidity window is also displayed in Floor View. For more information, see Viewing Sensor Data in Floor View.

Figure 5. Humidity: Floor View

View Temperature Parameters

Before you begin

Use the Settings tab to configure the Temperature parameters.

Procedure


Step 1

In Cisco Spaces, click the Menu icon () and choose Home > ACT Apps > Environmental Analytics app tile.

Optionally, from the Dashboard drop-down list (left navigation pane of the Cisco Spaces Home window), select Environmental Analytics.

The Environmental Analytics window is displayed.

Step 2

In the left navigation pane, click Temperature.

The floor data with Temperature value Between 21-25°C for the selected month is displayed.

Step 3

In the window that is displayed, view the following telemetry details:

  • Floor Name: Click the floor name to view the details in the Floor window.

  • Location Path: Displays the floor location path.

  • # of Workspaces: Displays the number of workspaces.

  • Max. Temperature: Displays the maximum Temperature level for the particular floor.

  • Avg. Temperature: Displays the average Temperature level for the particular floor.

  • Min Temperature: Displays the minimum Temperature level for the particular floor.

  • Sensor Violation Duration: Displays the duration of sensor violation.

Step 4

(Optional) Use the following options if required:

  • Search: Use this field to search for the required floors.

  • Export: Use this option to export the environmental sensor telemetry details as a comma-separated values file.

  • Show Records: Use the drop-down to select the number of records to be displayed in the tab. Use the forward and backward arrows to navigate to the other page records.

Step 5

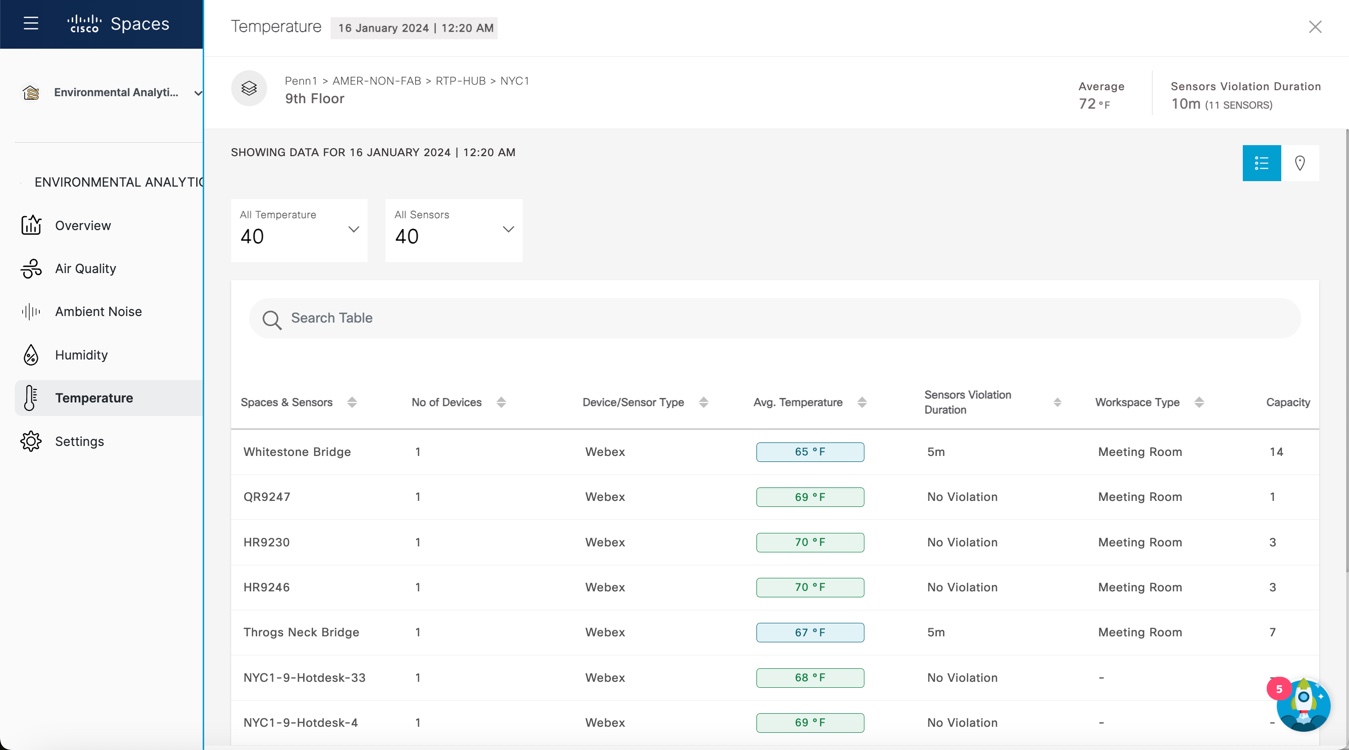
If you already click a floor name to view other sensor data in floor view, the Temperature window is also displayed in Floor View. For more information, see Viewing Sensor Data in Floor View.

Figure 6. Temperature: Floor View

Viewing Sensor Data in Floor View

You can view the sensor data in floor view for Air Quality, Ambient Noise, Humidity, and Temperature.

Procedure


Step 1

In Cisco Spaces, click the Menu icon () and choose Home > ACT Apps > Environmental Analytics app tile.

Optionally, from the Dashboard drop-down list (left navigation pane of the Cisco Spaces Home window), select Environmental Analytics.

The Environmental Analytics window is displayed.

Step 2

In the left navigation pane, click any sensor data of your choice.

Step 3

In the sensor detail window that is displayed, click the floor name.

The Floor View window is displayed with the sensor performance data for the selected floor for the current month.

By default, the All option is selected and the window displays sensor performance data from all devices. Click Webex if you want to view the sensor performance data from Cisco Webex devices.

Step 4

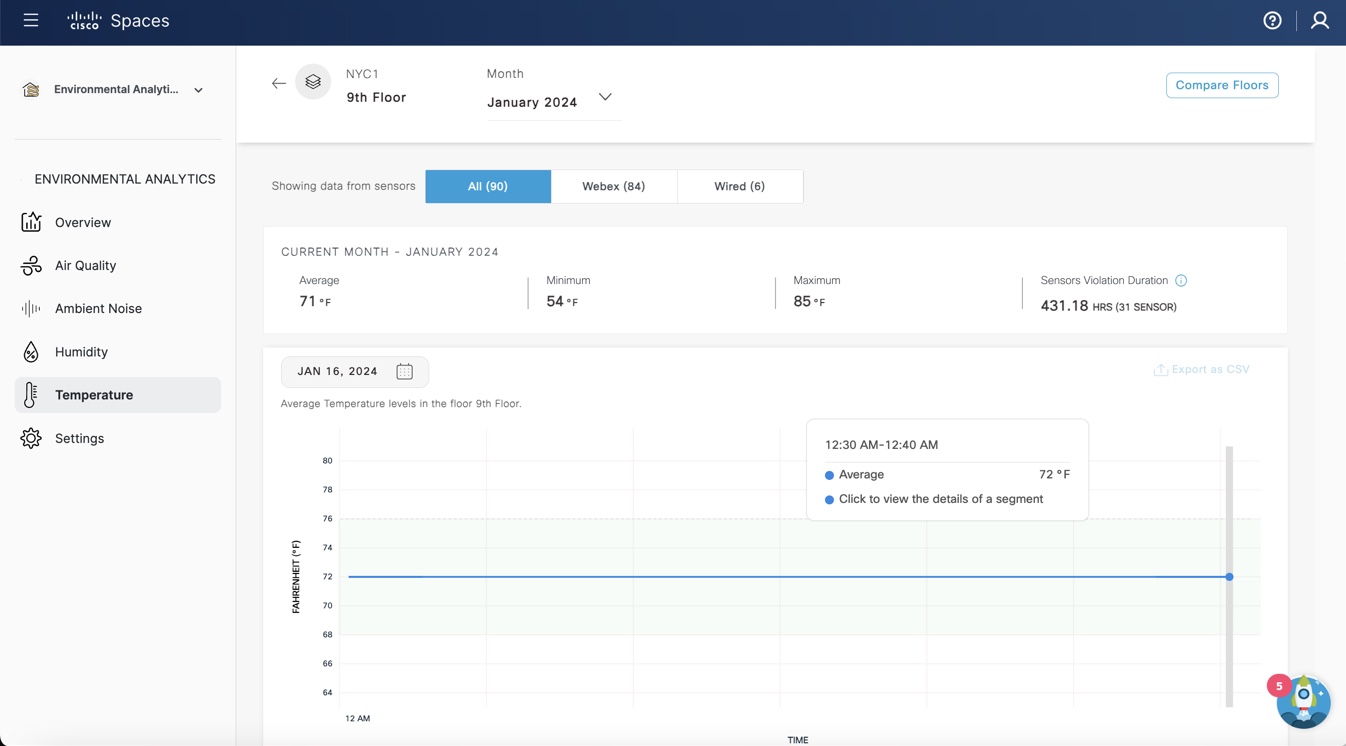
For the selected sensor data, the following data is displayed in graphical format:

  • Current Month: Displays the information about sensors that violated the optimal range for a specific time. Click the graph to view the sensor data in detail.

  • Average levels in the floor: Displays the average levels in the selected floor in graphical format. Click the time range to view additional information. You can again click the graphical format to view the details of the segment.

  • Daily average, min & max levels in floor: Displays the daily average, minimum and maximum levels in the selected floor in graphical format. Click the time range to view additional information.

  • Cumulative Time in Violation: Displays the cumulative time in violation in graphical format.

  • By Hour of the Day: Displays the sensor performance data by an hour of the day.

  • By Day of the Week: Displays the sensor performance data by day of the week.

For Air Quality sensor data, the following window is displayed:

Figure 7. Air Quality Sensor Data

For Ambient Noise sensor data, the following window is displayed:

Figure 8. Ambient Noise Sensor Data

For Humidity sensor data, the following window is displayed:

Figure 9. Humidity Sensor Data

For Temperature sensor data, the following window is displayed:

Figure 10. Temperature Sensor Data

Step 5

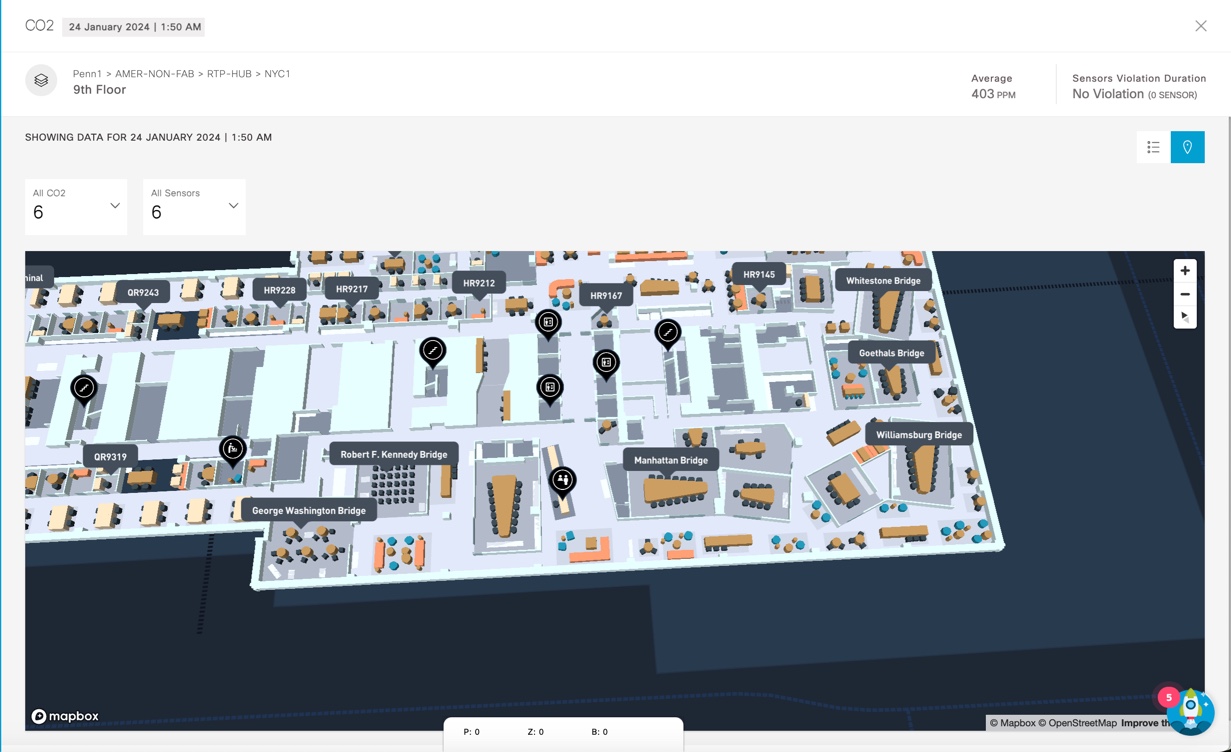
To view the sensor data in Rich Map view, click the Rich Map () icon.

The Floor View is displayed in Rich Maps.

Figure 11. Rich Maps View

Step 6

(Optional) To download the sensor metric as a CSV file, click Export as CSV.

Step 7

Click Compare Floors to open the Floor Comparison window to view the floor comparison data. For more information, see Compare Floors.

Step 8

Click the Close () icon to close the window.


Compare Floors

Procedure


Step 1

In the Cisco Spaces dashboard, click the Menu icon () and choose Home.

Optionally, from the Dashboard drop-down list (left navigation pane of the Cisco Spaces Home window), select Environmental Analytics.

The Environmental Analytics window is displayed.

Step 2

From the left navigation pane, select any sensor data of your choice.

Step 3

In the sensor detail window that is displayed, click the floor name.

The Floor View window is displayed with the sensor performance data. The data for the current month is displayed for the selected floor. By default, the All option is selected and the window displays sensor performance data from all devices. Click Webex if you need to display the sensor performance data from Cisco Webex devices.

Step 4

In the Floor View window, click Compare Floors.

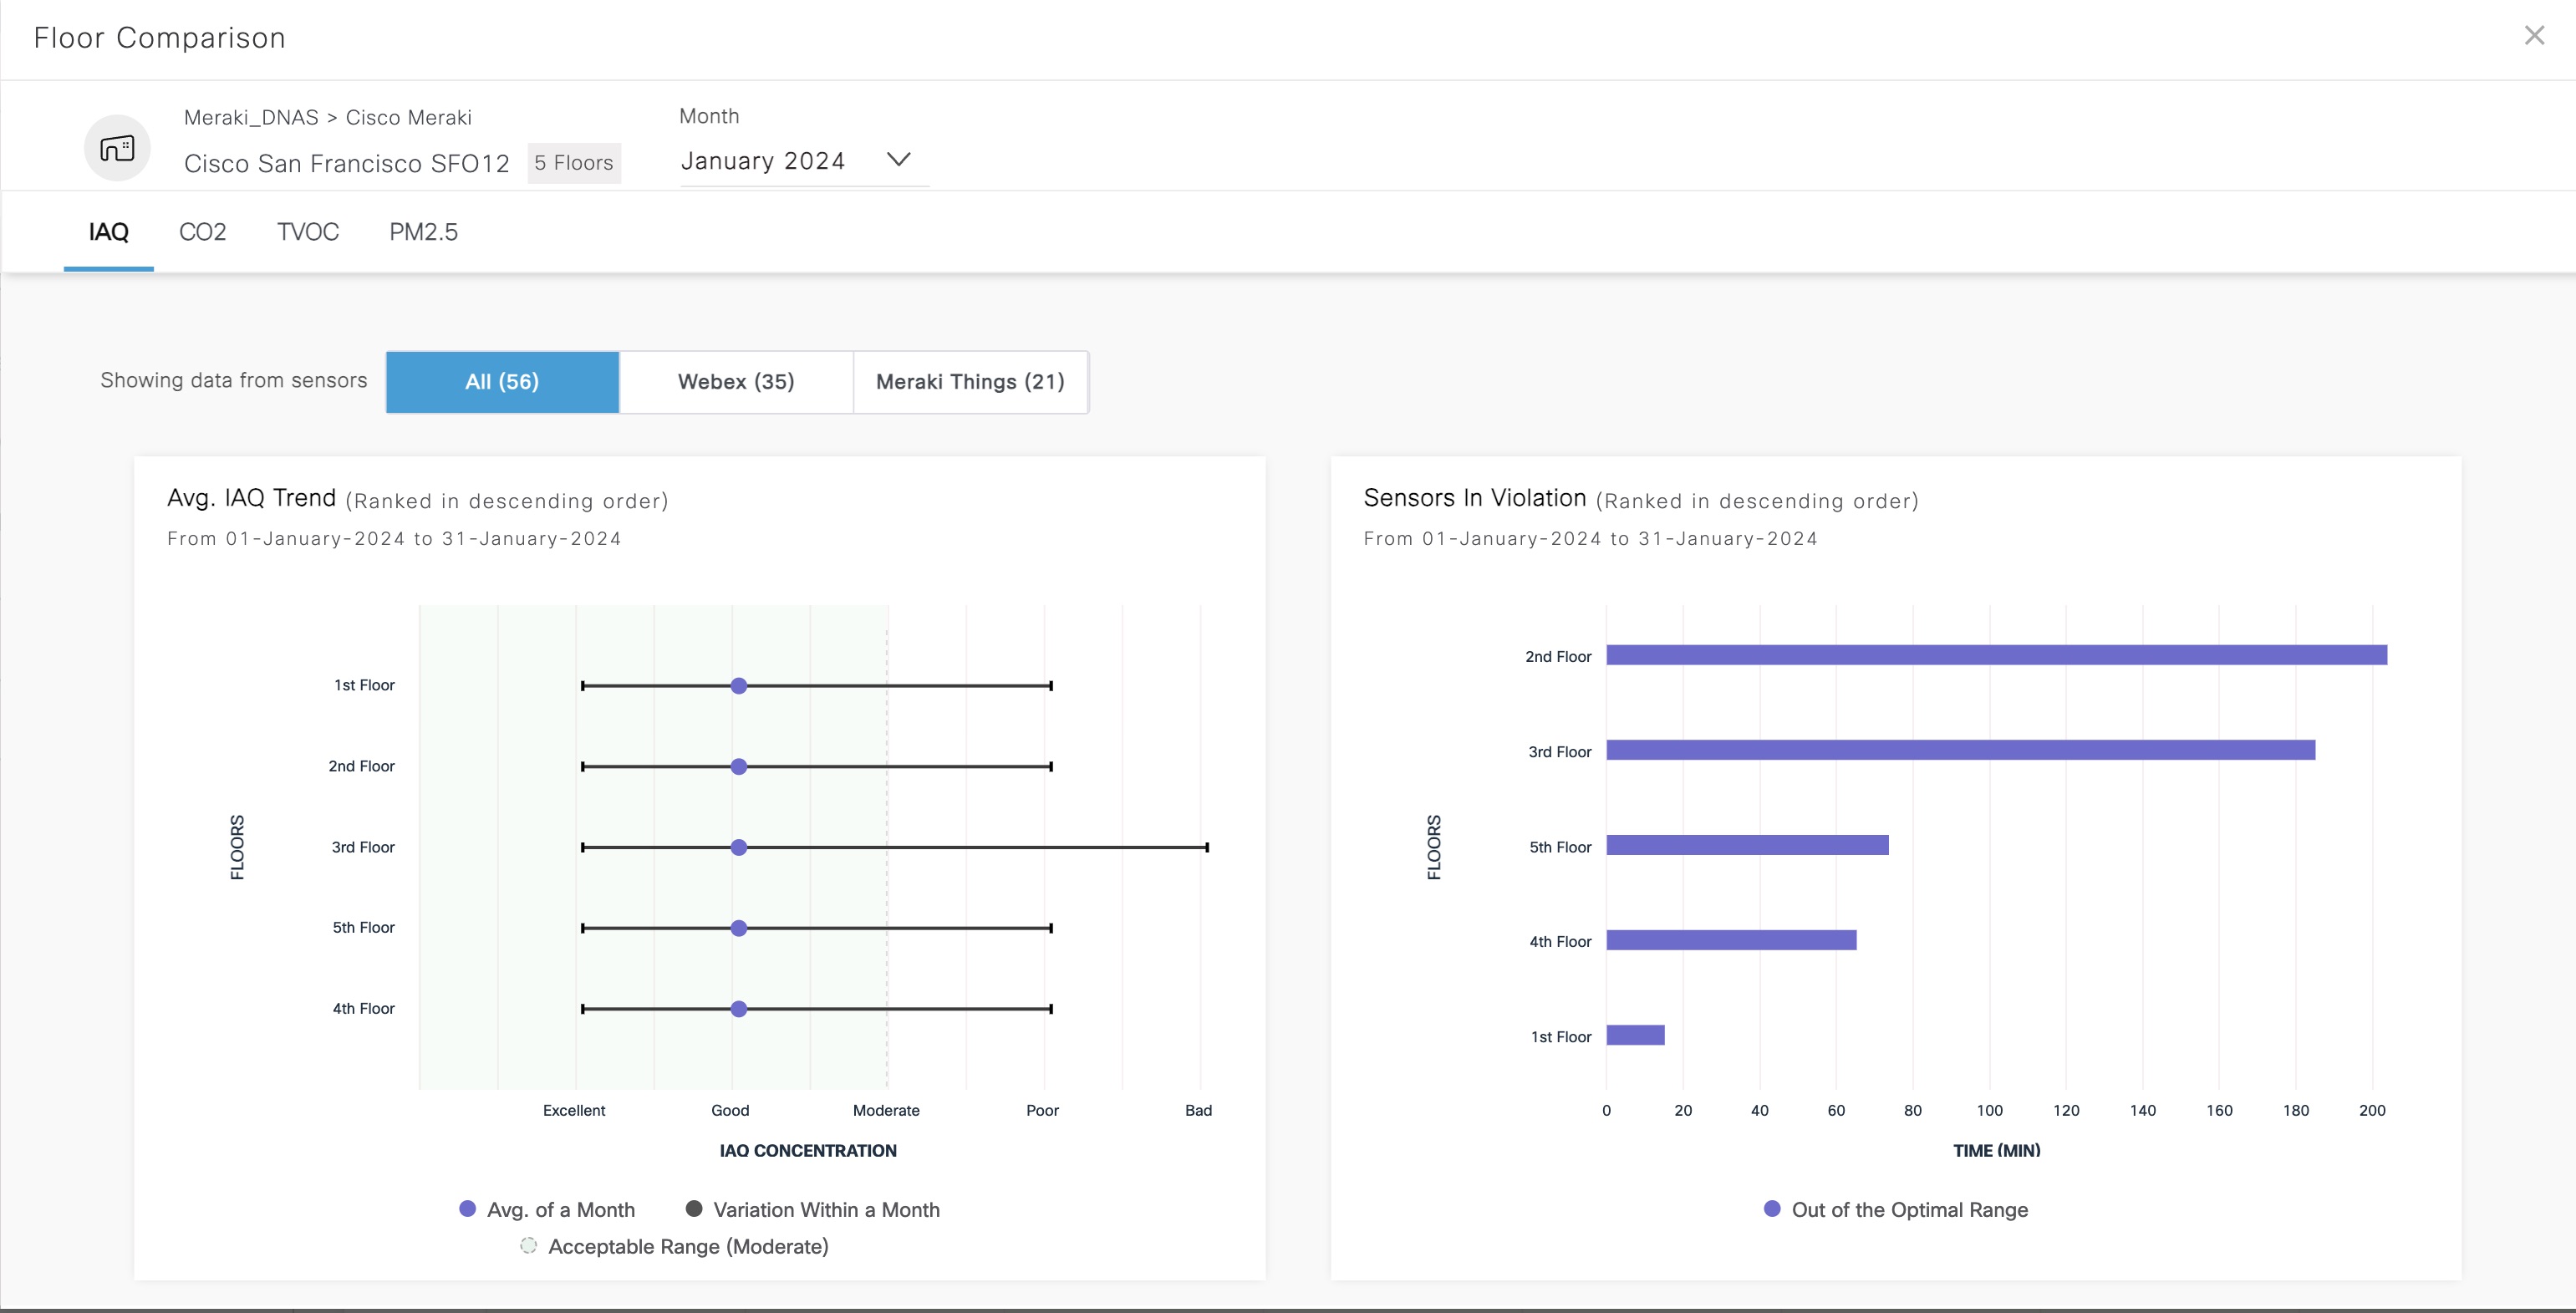
The Floor Comparison pop-up window is displayed. By default, All is selected. Click Webex to view sensor data from Cisco Webex devices.

Figure 12. Floor Comparison

Step 5

View the floor comparison data from all the sensors. The floor comparison details such as average sensor trend and sensors in violation for the selected month is displayed.

Step 6

Hover your cursor over the graph to view additional sensor details.

Step 7

(Optional) From the Month drop-down list, select a different month to view the floor comparison data.