Tech Support

Tech Support and System Logs

Cisco Nexus Dashboard Orchestrator system logging is automatically enabled when you first deploy the Orchestrator cluster and captures the events and faults that occur in the environment.

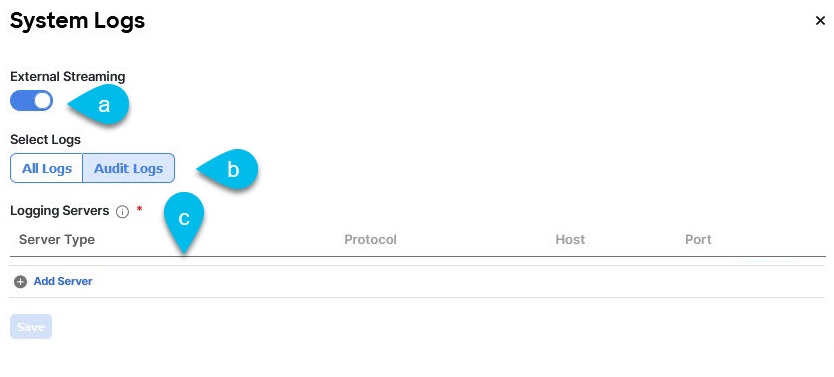
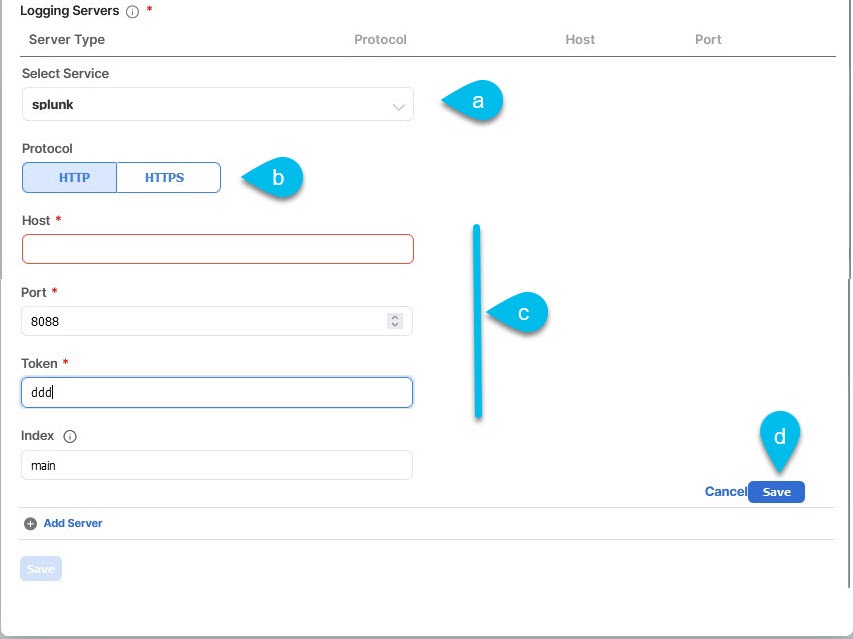
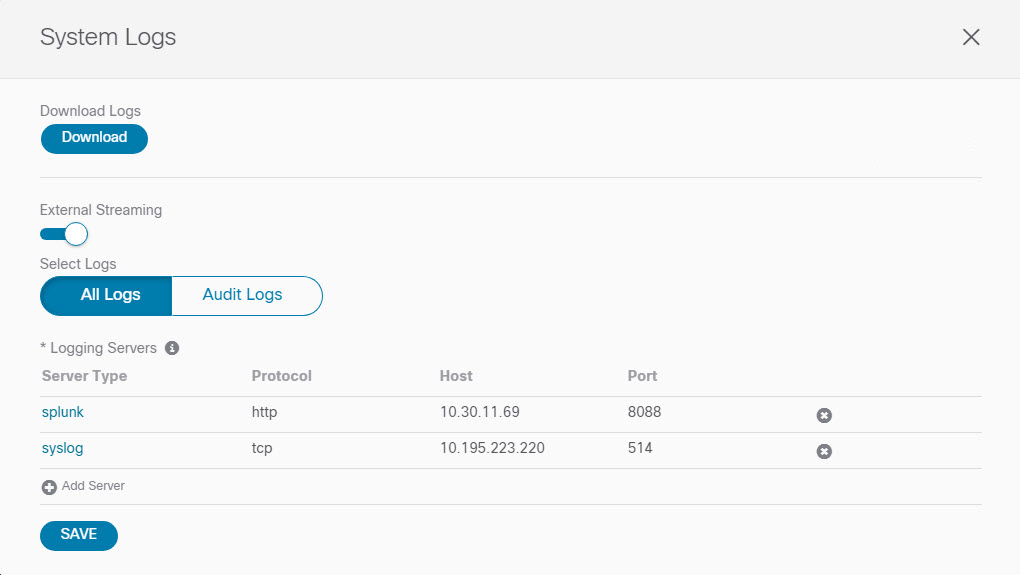
You can choose to download the logs at any time or stream them to an external log Analyzer, such as Splunk, if you want to use more tools to quickly parse, view, and respond to important events without a delay.

The tech support logs are split into two parts:

  • Original database backup files containing the same information as in prior releases

  • JSON-based database backup for ease of readability

Within each backup archive, you find the following contents:

  • x.x.x.x—One or more files in x.x.x.x format for container logs available at the time of the backup.

  • msc-backup-<date>_temp—Original database backup containing the same information as previous releases.

  • msc-db-json-<date>_temp—Back up contents in JSON format.

    For example:

    msc_anpEpgRels.json
    msc_anpExtEpgRels.json
    msc_asyncExecutionStatus.json
    msc_audit.json
    msc_backup-versions.json
    msc_backupRecords.json
    msc_ca-cert.json
    msc_cloudSecStatus.json
    msc_consistency.json
    ...

Downloading System Logs

This section describes how to generate a troubleshooting report and infrastructure logs file for all the schemas, sites, tenants, and users that are managed by Cisco Nexus Dashboard Orchestrator.

Procedure


Step 1

Log in to your Cisco Nexus Dashboard Orchestrator GUI.

Step 2

Open the System Logs screen.

  1. In the main menu, select Admin > Software Management.

  2. In the top-right corner of the System Logs frame, click the edit button.

Step 3

Click Download download the logs.

An archive will be downloaded to your system. Containing all the information as described in the first section of this chapter.


Streaming System Logs to External Analyzer

Cisco Nexus Dashboard Orchestrator allows you to send the Orchestrator logs to an external log Analyzer tool in real time. By streaming any events as they are generated, you can use the additional tools to quickly parse, view, and respond to important events without a delay.

This section describes how to enable Cisco Nexus Dashboard Orchestrator to stream its logs to an external Analyzer tool, such as Splunk or syslog.

Before you begin

  • This release supports only Splunk and syslog as external log Analyzer.

  • This release supports syslog for Cisco Nexus Dashboard Orchestrator in Nexus Dashboard deployments.

  • This release supports up to 5 external servers.

  • If using Splunk, set up and configure the log Analyzer service provider.

    For detailed instructions on how to configure an external log Analyzer, consult its documentation.

  • If using Splunk, obtain an authentication token for the service provider.

    Obtaining an authentication token for Splunk service is detailed in the Splunk documentation, but in short, you can get the authentication token by logging into the Splunk server, selecting Settings > Data Inputs > HTTP Event Collector, and clicking New Token.

Procedure


Step 1

Log in to your Cisco Nexus Dashboard Orchestrator GUI.

Step 2

Open the Admin > Tech Support > System Logs screen.

  1. In the main menu, select Admin > Software Management.

  2. In the top-right corner of the System Logs frame, click the edit button.

Step 3

In the System Logs window, enable external streaming and add a server.

  1. Enable the External Streaming knob.

  2. Choose whether you want to stream All Logs or just the Audit Logs.

  3. Click Add Server to add an external log Analyzer server.

Step 4

Add a Splunk server.

If you do not plan to use Splunk service, skip this step.

  1. Choose Splunk for the server type.

  2. Choose the protocol.

  3. Provide the server name or IP address, port, and the authentication token you obtained from the Splunk service.

    Obtaining an authentication token for Splunk service is detailed in the Splunk documentation, but in short, you can get the authentication token by logging into the Splunk server, selecting Settings > Data Inputs > HTTP Event Collector, and clicking New Token.

  4. Click the check mark icon to finish adding the server.

Step 5

Add a syslog server.

If you do not plan to use syslog, skip this step.

  1. Choose syslog for the server type.

  2. Choose the protocol.

  3. Provide the server name or IP address, port number, and the severity level of the log messages to stream.

  4. Click the check mark icon to finish adding the server.

Step 6

Repeat the steps if you want to add multiple servers.

This release supports up to 5 external servers.

Step 7

Click Save to save the changes.