Viewing System Details

Monitoring VM Host Metrics

Beginning with release 25.0(1), support is available for monitoring metrics for the VM host where the Cisco Cloud APIC is deployed using the Prometheus Node Exporter. The Prometheus Node Exporter provides visibility to a wide variety of hardware and kernel-related metrics, where it collects technical information from Linux nodes, such as CPU, disk, and memory statistics. For overview information on the Prometheus Node Exporter, see:

https://prometheus.io/docs/introduction/overview/

If your Cisco Cloud APIC is running on release 25.0(1) or later, the Prometheus Node Exporter is automatically available by default.

Guidelines and Limitations

HTTP is not supported for monitoring metrics using the Prometheus Node Exporter. Only HTTPS is supported for monitoring metrics using the Prometheus Node Exporter.

Monitoring VM Host Metrics Using the GUI

These procedures describe how to enable the Prometheus Node Exporter to monitor VM host metrics using the GUI.

Procedure


Step 1

In the Cisco Cloud APIC GUI, navigate to Infrastructure > System Configuration, then click on the Management Access tab.

Step 2

In the HTTPS area to the right of the window, note the entry in the Node Exporter field.
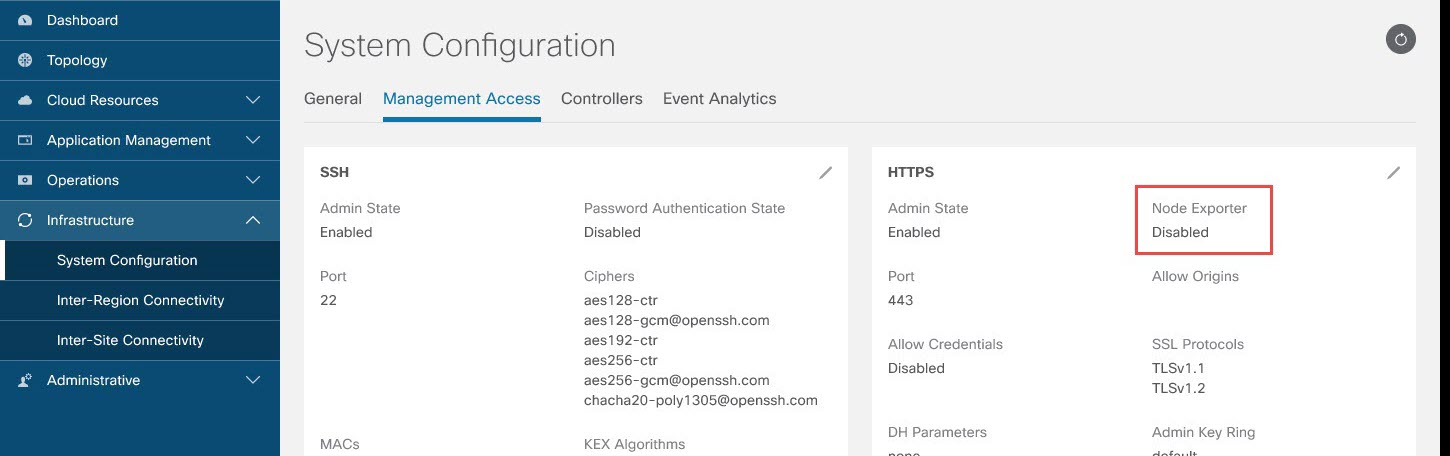
  • Enabled: The Prometheus Node Exporter has already been enabled. You do not have to continue with these instructions in that case.

  • Disabled: The Prometheus Node Exporter is not enabled yet. Proceed with these instructions to enable the Prometheus Node Exporter.

Step 3

Click the pencil icon in the HTTPS area to edit the HTTPS settings.

The HTTPS Settings window appears.

Step 4

Locate the Node Exporter field and click Enable.

A warning message appears, telling you that saving these settings will restart the web service, and that it will take a moment for it to resume responding to requests. Click OK to confirm these changes.

Step 5

At the bottom of the window, click Save.

You are returned to the System Configuration/Management Access window. The web service reboots and comes back online in a few seconds.

Step 6

In the HTTPS area to the right of the window, verify that the entry in the Node Exporter field is set to Enabled.

This verifies that the Prometheus Node Exporter is enabled.

Step 7

Click the link under the Enabled text in the Node Exporter area.

Another tab in your browser appears, showing the metrics for the VM host where the Cisco Cloud APIC is deployed.


Monitoring VM Host Metrics Using the REST API

These procedures describe how to enable the Prometheus Node Exporter to monitor VM host metrics using the REST API.

Procedure


Step 1

To determine if the Prometheus Node Exporter is enabled or not, send the following GET call:


GET https://<cloud-apic-ip-address>/api/mo/uni/fabric/comm-default/https.xml

Locate the nodeExporter field to determine if it is set to enabled or disabled.

Step 2

To monitor VM host metrics, send the following post to enable the Prometheus Node Exporter:


POST https://<cloud-apic-ip-address>/api/mo/uni/fabric/comm-default/https.xml

<commHttps nodeExporter="enabled" />

The metrics are displayed for the VM host where the Cisco Cloud APIC is deployed.

Step 3

To view the metrics using REST API, send the following GET call:


GET https://<cloud-apic-ip-address>/nodeexporter/metrics
Step 4

To disable the Prometheus Node Exporter, send the following post:


POST https://<cloud-apic-ip-address>/api/mo/uni/fabric/comm-default/https.xml

<commHttps nodeExporter="disabled" />


Viewing Application Management Details

This section explains how to view application management details using the Cisco Cloud APIC GUI. The application management details include the information of a specific tenant, application profile, EPG, contract, filter, VRF, cloud context profile, or external network.

Procedure


Step 1

From the Navigation menu, choose the Application Management tab.

When the Application Management tab expands, a list of subtab options appear. See the Application Management Options table for more information.

Table 1. Application Management Subtabs

Subtab Name

Description

Tenants

Displays tenants as rows in a summary table.

Application Profiles

Displays application profiles as rows in a summary table.

EPGs

Displays an EPGs as rows in a summary table.

Contracts

Displays a contracts as rows in a summary table.

Filters

Displays filters as rows in a summary table.

VRFs

Displays VRFs as rows in a summary table.

Cloud Context Profiles

Displays cloud context profiles as rows in a summary table.

External Networks

Displays external networks as rows in a summary table.

Step 2

Click the tab that represents the component with the details you want to view.

A summary table appears with items as rows in the table. For example, if you chose the Tenants subtab, a list of tenants appear as rows in a summary table

You can filter the rows by clicking the Filter by Attributes bar. Choose the attribute, operator and filter-value. For example, for filtering based on a tenant, choose Name == T1 (where T1 is the name of a tenant).

Step 3

To view a summary pane, click the row that represents the specific component you want to view.

Step 4

For more information, double-click the summary table row that represents the specific component you want to view.

A new dialog box appears over the work pane with any of the following tabs:

Note 

The tabs that appear differ between components and configurations.

  • Overview—Provides a general overview of cloud resources, configuration relationships, and settings of the component.

  • Topology —Provides visual relationship between an object and other related objects. The chosen object is displayed at the center.

  • Cloud Resources—Contains a list of subtabs that display the cloud resource information related to the component.

  • Application Management—Contains a list of subtabs that display the ACI relation information related to the component.

  • Event Analytics—Contains a list of subtabs that display faults, events, and audit logs.

Note 

The dialog box that appears over the work pane contains an edit button in the top-right corner between the refresh button and the Actions button. When clicked, the edit button enables you to edit the chosen component.


Viewing Cloud Resource Details

This section explains how to view cloud resource details using the Cisco Cloud APIC GUI. The cloud resource details include the information about a specific region, VPC, router, security group (application security group/network security group), endpoint, VM, and cloud service.

Procedure


Step 1

From the Navigation menu, choose the Cloud Resources tab.

When the Cloud Resources tab expands, a list of subtab options appear. See the Cloud Resource Options table for more information.

Table 2. Cloud Resource Subtabs

Subtab Name

Description

Regions

Displays regions as rows in a summary table.

VPCs

Displays VPCs as rows in a summary table.

Routers

Displays routers as rows in a summary table.

Endpoints

Displays endpoints as rows in a summary table.

Instances

Displays instances as rows in a summary table.

Step 2

Click the tab that represents the component with the details you want to view.

A summary table appears with items as rows in the table. For example, if you chose the Endpoints subtab, a list of endpoints appear as rows in a summary table.

You can filter the rows by selecting an attribute from the drop-down menu when you click the Filter by attributes bar. The attributes displayed in the drop-down menu depend on the selected subtab.

For the Endpoints subtab, you can narrow down the search based on a cloud tag, by entering a key or value term. If you want to search based on both terms, click the (+) displayed as a superscript to the key or value term (depending on which was entered first). Cloud tag filters cannot be edited. To modify a search, first delete the filters, and then enter the desired key or value term again. Search based on multiple cloud tag filters is supported.

Step 3

To view a summary pane, click the row that represents the specific component you want to view.

Step 4

For more information, double-click the summary table row that represents the specific component you want to view.

A new dialog box appears over the work pane with any of the following tabs:

Note 

The tabs that appear differ between components and configurations.

  • Overview—Provides a general overview of cloud resources, configuration relationships, and settings of the component, including the cloud tags associated with endpoints.

  • Cloud Resources—Contains a list of subtabs that display the cloud resource information related to the component.

  • Application Management—Contains a list of subtabs that display the ACI relation information related to the component.

  • Event Analytics—Contains a list of subtabs that display faults, events, and audit logs.


Viewing Operations Details

This section explains how to view operations details using the Cisco Cloud APIC GUI. The operations details include the information of a specific fault, event, audit log, active sessions, backup and restore policies, tech support policies, firmware management, scheduler policies, and remote locations.

Procedure


Step 1

From the Navigation menu, choose the Operations tab.

When the Operations tab expands, a list of subtab options appear. See the Operations Options table for more information.

Table 3. Operations Subtabs

Subtab Name

Description

Event Analytics

Contains the following subtabs:

  • Faults Tab—Displays faults as rows in a summary table.

  • Fault Records Tab—Displays fault records as rows in a summary table.

  • Events Tab—Displays events as rows in a summary table.

  • Audit Logs Tab—Displays audit logs as rows in a summary table.

Active Sessions

Displays a list of active users who are logged into Cloud APIC.

Backup & Restore

Contains the following subtabs:

  • Backups Tab—Displays backup as rows in a summary table.

  • Backup Policies Tab—Displays backup policies as rows in a summary table.

  • Job Status Tab—Displays the job status as rows in a summary table.

  • Event Analytics Tab—Contains the following subtabs:

    • Faults Tab—Displays faults as rows in a summary table.

    • Events Tab—Displays events as rows in a summary table.

    • Audit Logs Tab—Displays audit logs as rows in a summary table.

Tech Support

Contains the following subtabs:

  • Tech SupportTab—Displays tech support policies as rows in a summary table.

  • Core Logs Tab—Displays core logs as rows in a summary table.

Firmware Management

Contains the following subtabs:

  • Controllers Tab—Displays general firmware management information, such as Current Firmware Version, Upgrade Status, and so on.

  • Images Tab—Displays a list of images.

  • Event Analytics Tab—Contains the following subtabs:

    • Faults Tab—Displays faults as rows in a summary table.

    • Events Tab—Displays events as rows in a summary table.

    • Audit Logs Tab—Displays audit logs as rows in a summary table.

Schedulers

Displays scheduler policies as rows in a summary table.

Remote Locations

Displays remote locations as rows in a summary table.

Step 2

Click the tab that represents the component you want to view.

A summary table appears with items as rows in the table. For example, if you chose the Active Sessions subtab, a list of active sessions appear as rows in a summary table.

You can filter the rows by clicking the Filter by Attributes bar. Choose the attribute, operator and filter-value. For example, for filtering based on a username, choose username == user1 (where user1 is a user logged into Cloud APIC).

Step 3

To view a summary pane, click the row that represents the specific component you want to view.

Step 4

For more information, double-click the summary table row that represents the specific item you want to view.

A new dialog box appears over the work pane that displays additional information about the item you chose from the summary table.


Viewing Infrastructure Details

This section explains how to view infrastructure details using the Cisco Cloud APIC GUI. The infrastructure details include information about system configuration, inter-region connectivity, and external connectivity.

Procedure


Step 1

From the Navigation menu, choose the Infrastructure tab.

When the Infrastructure tab expands, a list of subtab options appear. See the Infrastructure Options table for more information.

Table 4. Infrastructure Subtabs

Subtab Name

Description

System Configuration

Displays General system configuration information, Management Access information, Controllers, and Event Analytics.

External Connectivity

Displays one pane with a map that contains the inter-region connectivity view.
Step 2

Click the tab that represents the component with the details you want to view.


Viewing Administrative Details

This section explains how to view administrative details using the Cisco Cloud APIC GUI. The administrative details include the information about authentication, security, users, and smart licensing..

Procedure


Step 1

From the Navigation menu, choose the Administrative tab.

When the Administrative tab expands, a list of subtab options appear. See the Administrative Options table for more information.

Table 5. Administrative Subtabs

Subtab Name

Description

Authentication

Displays the Authentication Default Settings, Login Domains, Providers and Event Analytics subtabs, which contain the information described below:

  • Authentication Default Settings Tab—Displays settings information.

  • Login Domains Tab—Displays the login domains as rows in a summary table.

  • Providers Tab—Displays the providers as rows in a summary table.

  • Event Analytics Tab—Displays the Faults, Events, and Audit Logs subtabs, each with the corresponding information displayed as rows in a summary table.

Security

Contains the following list of subtabs:

  • Security Default Settings Tab—Enables you to view the default security settings information.

  • Security Domains Tab—Enables you to view security domain information in a summary table.

  • Roles Tab—Enables you to view the role information in a summary table.

  • RBAC Rules Tab—Enables you to view RBAC rule information in a summary table.

  • Certificate Authorities Tab—Enables you to view the certificate authority information in a summary table.

  • Key Rings Tab—Enables you to view key ring information in a summary table.

  • User Activity Tab—Enables you to view user activity.

Users

Contains the following subtabs:

  • Local Tab—Displays local users as rows in a summary table.

  • Remote Tab—Displays remote users as rows in a summary table.

Smart Licensing

Contains the following subtabs:

  • General Tab—Displays the licenses as rows in a summary table.

  • CSRs Tab—Displays CSRs as rows in a summary table.

  • Faults Tab—Displays faults as rows in a summary table.

Step 2

Click the tab that represents the component you want to view.

For some options, a summary table appears with items as rows in the table (For example, if you choose the Users tab, a list of users appear as rows in a summary table). To view a summary pane, click the row that represents the specific component you want to view. To view more information, double-click the summary table row that represents the specific item you want to view. A new dialog box appears over the work pane that displays additional information about the item you chose from the summary table.

You can filter the rows by clicking the Filter by Attributes bar. Choose the attribute, operator and filter-value. For example, for filtering based on a user, choose User ID == admin (where admin is a user ID. ).


Viewing Health Details Using the Cisco Cloud APIC GUI

This section explains how to view health details using the Cisco Cloud APIC GUI. You can view health details for any object that you can see in the Cloud Resources area in the Cisco Cloud APIC GUI, such as the following:

  • Regions

  • VPCs

  • Endpoints

  • Instances

Procedure


Step 1

From the Navigation menu, choose the Dashboard tab.

The Dashboard window for the Cisco Cloud APIC system appears. From this window, you can view the overall health status of your system.

Step 2

Click within the Fault Summary area in the Dashboard window.

The Event Analytics window appears, showing more detailed information for the specific fault level that you clicked. The following screen shows an example Event Analytics window for the faults listed with critical severity.

Step 3

Click the X next to the Severity level to display Event Analytics information for all faults.

The information provided in the Event Analytics window changes to show the events with critical, major, and warning levels of severity.

Step 4

From the Navigation menu, choose the Cloud Resources tab.

When the Cloud Resources tab expands, a list of subtab options appear. See the Administrative Options table for more information.

Step 5

Choose any item under the Cloud Resources tab to display health information for that component.

For example, the following figure shows health information that might be displayed when you click on Cloud Resources > Regions. The health of each region is displayed in the left column of the table in the Regions window.