Cisco Cloud APIC Statistics

About Google Cloud Statistics

Beginning in Cisco Cloud APIC Release 25.0(4), you can view statistics that are derived by processing Google Cloud flow logs.

Flow Log Statistics

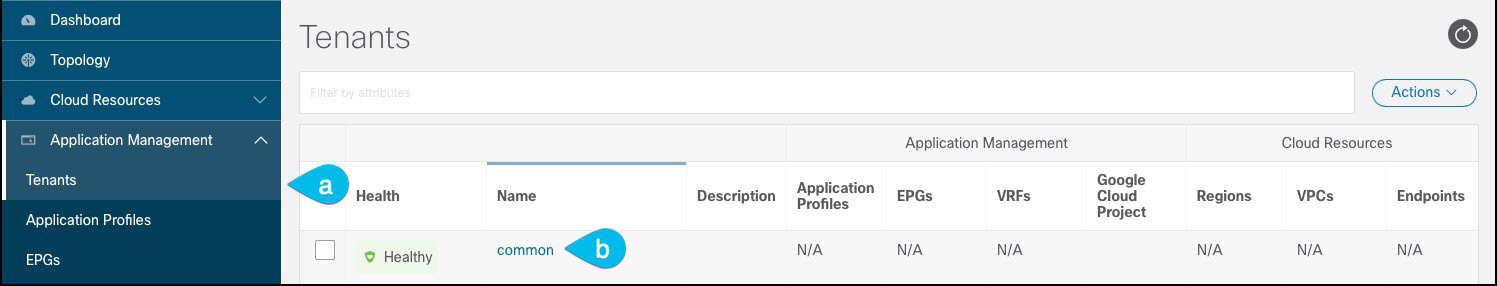
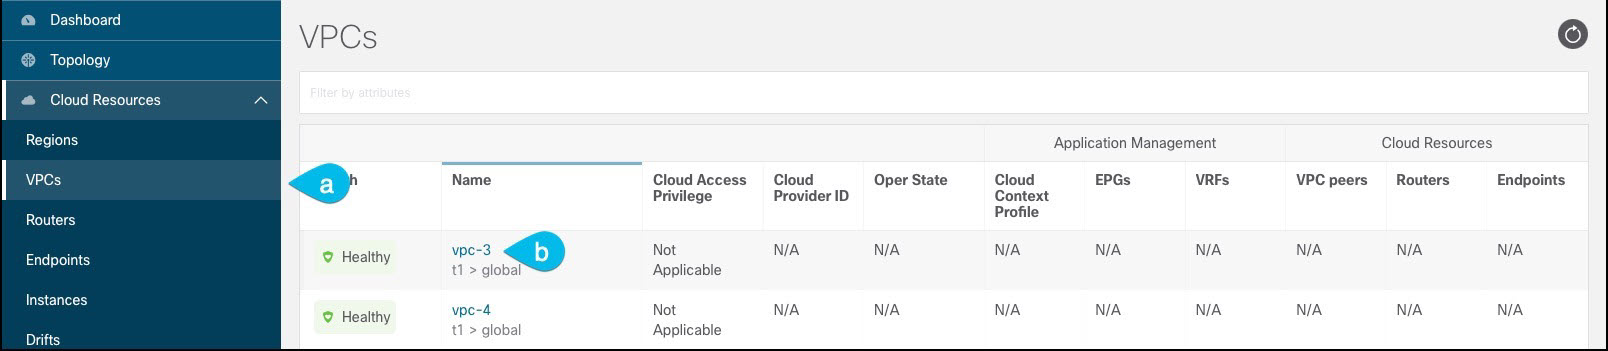
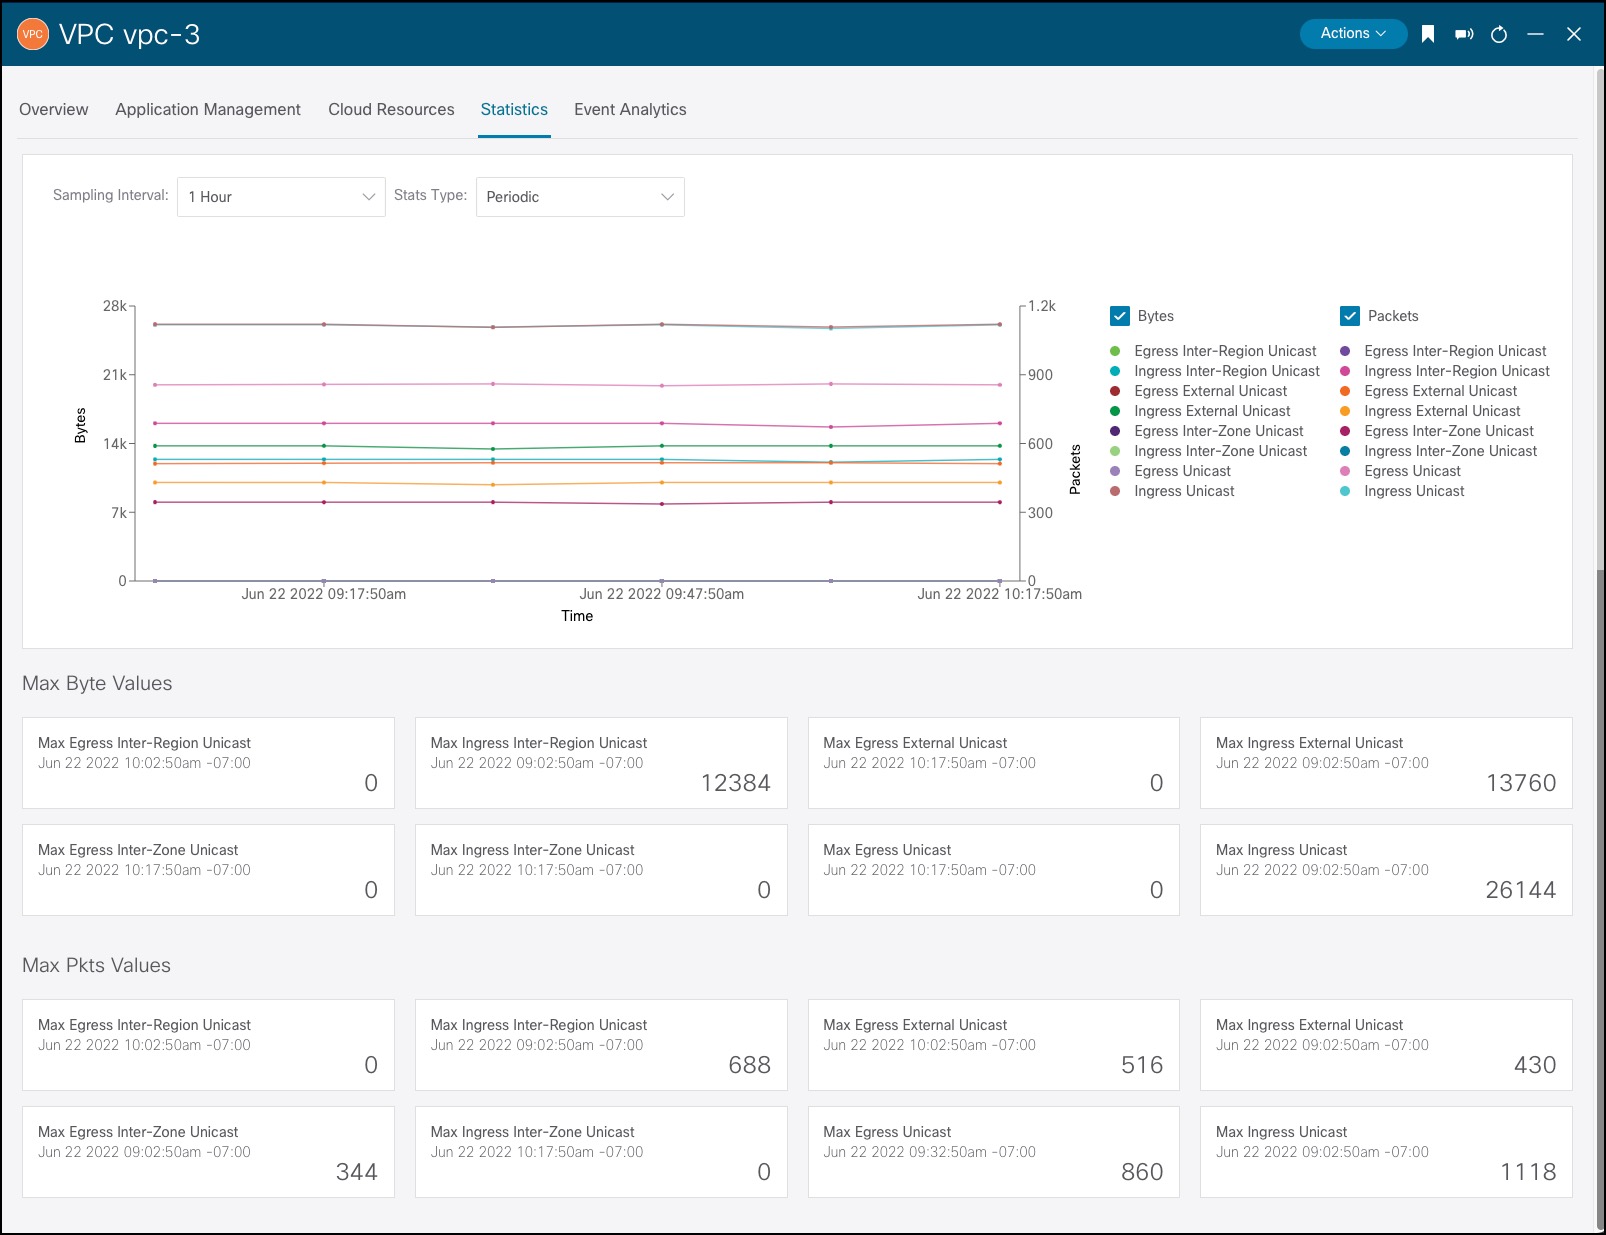
Cisco Cloud APIC allows you to enable flow log statistics for individual cloud context profiles within a tenant. When statistics are enabled for a cloud context profile, statistics are collected for every IP address within the corresponding VPCs. Available statistics include ingress and egress bytes and packets, internal and external, for VPCs, regions, and endpoints.

The collected statistics are aggregated through the following hierarchy:

  • IP statistics are aggregated to determine endpoint statistics.

  • Endpoint statistics are aggregated to determine zone statistics.

  • Zone statistics are aggregated to determine subnet statistics.

  • Subnet statistics are aggregated to determine region statistics.

  • Region statistics are aggregated to determine VPC statistics.

The Cisco Cloud APIC GUI displays the collected statistics for VPCs, regions, and endpoints.

For more information about Google Cloud flow logs, see "VPC Flow Logs" on the Google Cloud website.

Guidelines and Limitations For Configuring Google Cloud Statistics

Following are the guidelines and limitations when configuring Cisco Cloud APIC to collect Google Cloud statistics:

  • The flow log statistics feature is not enabled by default.

  • Flow log statistics can be enabled for individual context profiles within a tenant. In this case, flow logs are enabled on all subnets belonging to the corresponding VPC.

  • Flow logs are aggregated at one minute intervals. The aggregation interval and sample rate are not configurable.

  • Statistics for dropped traffic are not supported by flow logs.

  • Statistics filters are not supported.

  • Zone and subnet statistics are not displayed.

Enabling Flow Log Statistics

You can enable the collection of Google Cloud flow log statistics for individual context profiles within a tenant. Statistics can then be viewed for VPCs, regions, and endpoints in their respective Cloud Resources GUI menus.

To enable flow log statistics using the Cisco Cloud APIC GUI:

Procedure


Step 1

Select the tenant containing the resource for which flow log statistics will be enabled.

  1. From the navigation menu, select Application Management > Tenants.

    A Tenants summary table appears in the work pane.

  2. In the summary table, double-click the name of the tenant.

    The tenant dialog box appears over the work pane. The tenant dialog box displays the Overview, Topology, Cloud Resources, Application Management, Statistics, and Event Analytics tabs.

Step 2

Enable flow log statistics collection on the desired resource.

  1. In the tenant dialog box, select the Statistics tab.

    A Resource Name table appears with context profiles listed as rows in the table. The Stats Enabled column indicates whether flow log statistics are enabled for each resource.

  2. Check the checkbox next to the desired resource.

  3. In the top right of the tenant dialog box, click the Actions menu and select Enable Stats.


Viewing Flow Log Statistics

In the Cisco Cloud APIC GUI, you can view graphed statistics for VPCs, regions, and endpoints. Available statistics for each include ingress and egress bytes and packets. For VPCs and regions, the statistics are further separated into the following categories:

  • Statistics: All traffic counters extracted from the flow logs records.

  • Inter-Region Statistics: For a particular region, all ingress and egress traffic to or from other regions within the VPC.

  • External Statistics: All ingress and egress traffic with a source or destination outside of the VPC.

  • Inter-Zone Statistics: For a particular zone, all ingress and egress traffic to or from other zones within the same region and VPC. These aggregated statistics are available on the region page and on the VPC page.

Peak values for each counter are displayed with a timestamp that shows when the peak value occurred.

This example procedure shows you how to view the flow log statistics for VPCs in the Cisco Cloud APIC GUI. You can also view the statistics for regions or endpoints in the same manner by selecting Regions or Endpoints instead of VPCs in the following steps.

Before you begin

Enable Google Cloud flow log statistics for the desired cloud context profile using the procedure in Enabling Flow Log Statistics.

Procedure


Step 1

Select the resource whose statistics you would like to view.

  1. From the navigation menu, select Cloud Resources > VPCs.

    A VPCs summary table appears in the work pane.

  2. In the summary table, double-click the name of the VPC.

    The VPC dialog box appears over the work pane. The VPC dialog box displays the Overview, Application Management, Cloud Resources, Statistics, and Event Analytics tabs.

Step 2

Click the Statistics tab.

A graphical view of the VPC statistics appears along with a table of maximum values.

Step 3

Configure the display of the statistics.

To configure the parameters of the displayed statistics, you can modify the following settings:

Properties

Description

Sampling Interval

Choose the interval:

  • 1 hour

  • 12 Hours

  • 1 Day

  • 1 Week

  • 1 Month

Stats Type

Choose the display type:

  • Periodic

  • Cumulative

  • Trend

  • Rate

Bytes

Check the checkbox to display the byte counter graph. The vertical axis on the left side of the graph indicates the byte count.

Packets

Check the checkbox to display the packet counter graph. The vertical axis on the right side of the graph indicates the packet count.


Enabling VPC Flow Log Statistics Using the REST API

Google Cloud flow log statistics can be enabled for individual context profiles within a tenant.

Procedure


Step 1

Define a flow log policy (cloudGcpFlowLogPol) under the tenant.

No configuration settings are needed except for the name.

Note 

For the name of the flow log policy, note the following restrictions:

  • Match the regular expression:

    [a-z]([-a-z0-9]*[a-z0-9])?

    This means that the first character must be a lowercase letter, and all the following characters must be hyphens, lowercase letters, or digits, except the last character, which cannot be a hyphen.

  • We recommend using 14 characters or fewer for this name.

Example:


<polUni>
    <fvTenant name="tenant1" status="">
        <cloudGcpFlowLogPol name="myFlowLogPol1" status="">
        </cloudGcpFlowLogPol>
        <cloudCtxProfile name="ctxProfile2" status="" vpcGroup="vpc-4">
.
.
.
Step 2

Within the cloud context profile, add a reference to the flow log policy.

Flow log statistics for the cloud context profile are enabled by the presence of the reference object (cloudRsCtxToGcpFlowLog). To disable flow log statistics for the cloud context profile, remove the reference object.

Example:


.
.
.
            <cloudRsCtxToGcpFlowLog tnCloudGcpFlowLogPolName="myFlowLogPol1" status=""/>
        </cloudCtxProfile>
    </fvTenant>
 </polUni>