Distribution Automation—Secondary Substation Implementation Guide
This Distribution Automation - Secondary Substation Implementation Guide provides a comprehensive explanation of the Cisco Smart Grid Field Area Network solution implementation for Secondary Substation monitoring and Distribution Automation use cases such as Fault Location, Isolation, and Service Restoration (FLISR) and Volt/VAR.
This document includes implementation information about the solution’s architecture, possible deployment models, and guidelines for deployment. It also recommends best practices and potential issues when deploying the reference architecture.
Navigator
The following table describes the content of the chapters in this document.
Chapter 1, Introduction |
|
Chapter 2, Solution Network Topology and Addressing |
Discusses the Distribution Automation secondary substation solution network topology and various IP addressing schemes used in the solution implementation. |
Chapter 3, IoT Gateway Onboarding and Management |
Includes gateway onboarding, staging, and zero touch deployment (ZTD) implementation and use case-specific template implementation. |
Chapter 4, ICT Enablement for SCADA Use Case Validation |
Explains the ICT implementation like routing, raw socket, and protocol translation, which are key for application traffic flow. |
Chapter 5, End-to-End Application Use Case Scenarios |
Explains the implementation details of the fault location isolation and service restoration, Volt/VAR, and substation monitoring use cases. |
Chapter 6, High Availability at Various Layers |
Explains the implementation details of high availability aspects of this solution. |
Chapter 7, IP Services |
Explains the implementation details of various IP services like Network Address Translation, and Quality of Service. |
Captures the “Router Bootstrap Configuration” profiles for FND, for various deployment methods of Cisco IoT Gateways (with/without NAT, IPv4/IPv6). |
|
Captures the FND Tunnel Provisioning group content, as well as the FND Device Configuration group content, to facilitate ZTD of Cisco IoT Gateways. |
|
FlexVPN Configurations required for secure Tunnel provisioning. |
|
Captures the FND device configuration group's profile/content, for enablement of IP/Serial SCADA traffic on IR1101 and IR807. |
|
Captures the supplementary file details used during validation of End-to-End Application use case scenarios. |
Audience
The audience for this guide comprises, but is not limited to, system architects, network/compute/systems engineers, field consultants, Cisco Advanced Services specialists, and customers.
Readers should be familiar with networking protocols, Network Address Translation, Supervisory Control and Data Acquisition (SCADA) protocols, and have been exposed to Field Area Networks.
Introduction
This implementation guide details the implementation of Distribution Automation use cases like FLISR, Volt/VAR and Secondary Substation monitoring for the Europe region. Therefore, the focus of this document is on IEC 60870-5-104 or T104 and IEC 60870-5-101 or T101 Supervisory Control and Data Acquisition (SCADA) protocols. We have planned a separate implementation guide that focuses on the North American Region distribution automation use cases.
Secondary Substation monitoring covers both SCADA transport and SCADA translation scenarios. SCADA protocol translations are enabled on Cisco routers such as the Cisco IR1101, Cisco IR809, Cisco IR807, Cisco IR829, and CGR 1120. These routers are referred to as Secondary Substation Routers (SSR) or Distribution Automation Gateways (DA Gateways) throughout this document. Solution implementation is based on the design recommended in the Distribution Automation - Secondary Substation Design Guide that can be found at the following URL:
■![]() https://www.cisco.com/c/en/us/td/docs/solutions/Verticals/Distributed-Automation/Secondary-Substation/DG/DA-SS-DG.html
https://www.cisco.com/c/en/us/td/docs/solutions/Verticals/Distributed-Automation/Secondary-Substation/DG/DA-SS-DG.html
The flow of this implementation guide is depicted in Figure 1:

The Cisco Distribution Automation Solution is a two-tier architecture where the headend block is connected to the Field Area Network or Secondary Substation block using the WAN tier. The Gateway aggregates application traffic from the Field Area block and routes to the Headend block where the application resides. For a detailed description of different elements in the Field Area block and their implementation, please refer to the Cisco FAN - Headend Deep Dive Implementation and FAN Use Cases at the following URL:
■![]() https://docs.cisco.com/share/proxy/alfresco/url?docnum=EDCS-15726915
https://docs.cisco.com/share/proxy/alfresco/url?docnum=EDCS-15726915
Figure 2 Distribution Automation Solution Architecture
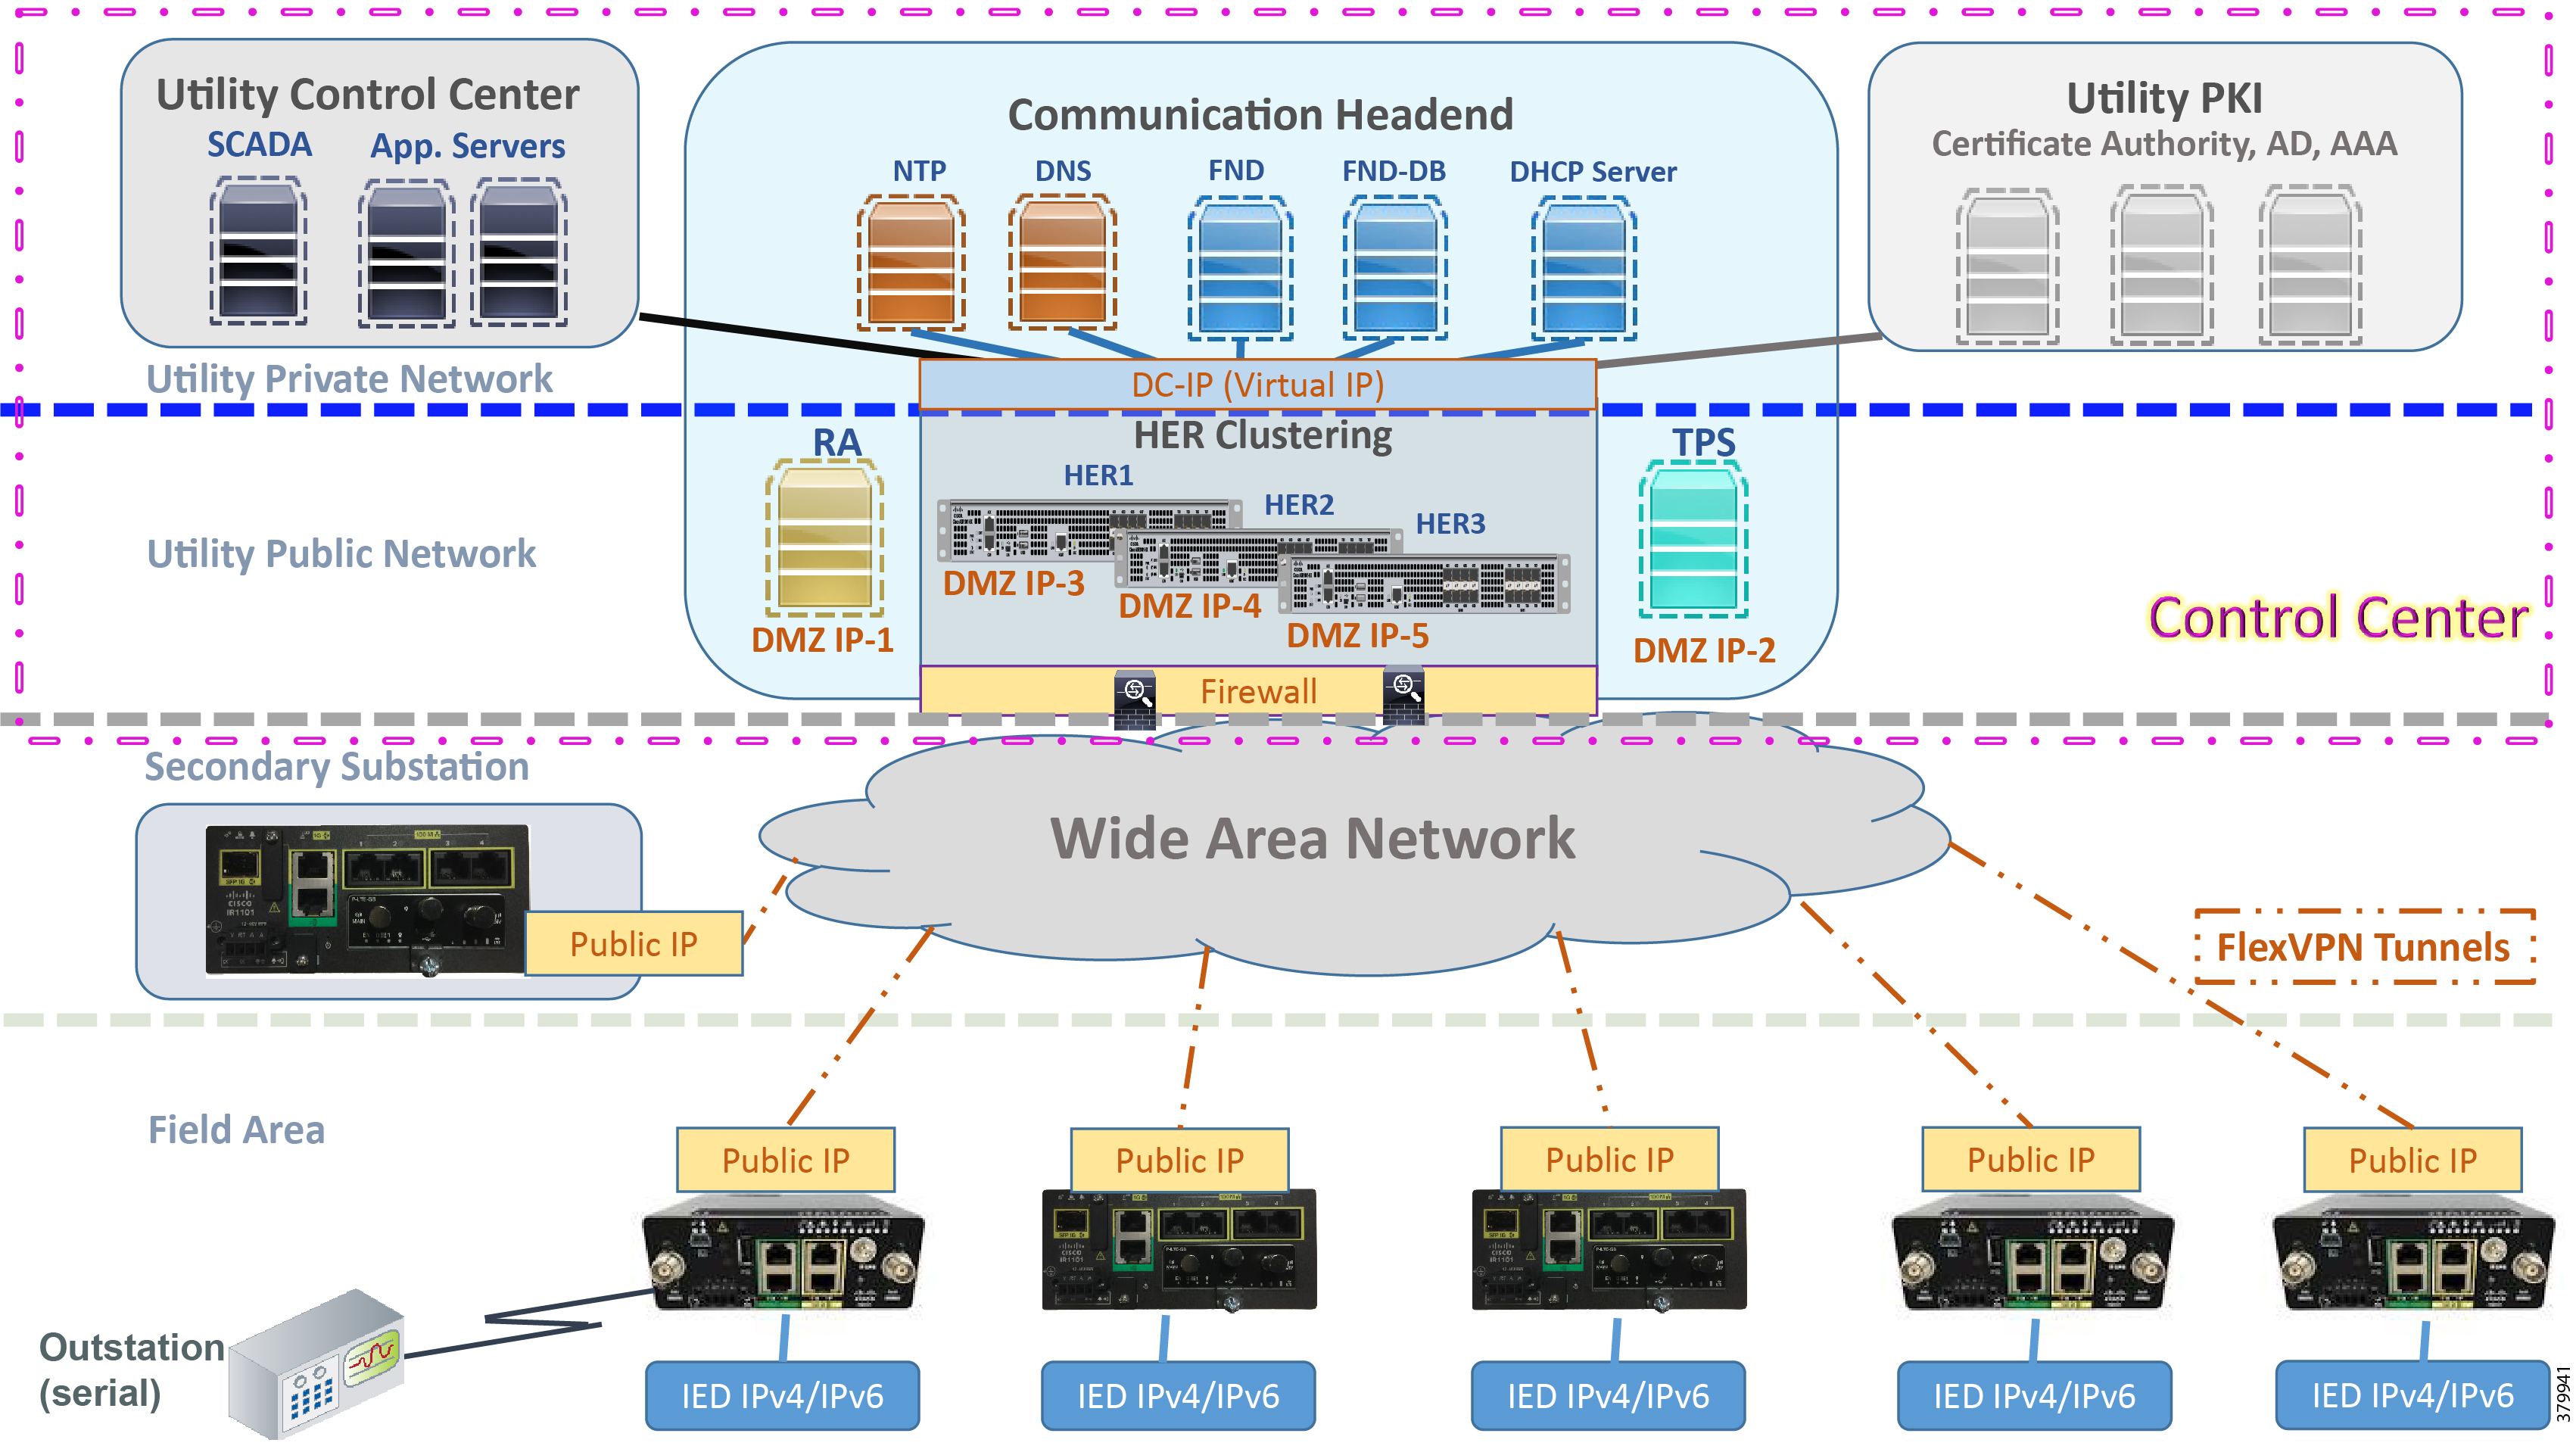
Gateways connect various outstation IEDs (IPV4/IPV6 or serial) in the Field Area or Secondary Substation via Ethernet and RS232/RS485 asynchronous serial interfaces. Solution Network Topology and Addressing discusses in detail the solution implementation topology, various IP address schemes used in different blocks, and VLAN segmentation across services. The gateway can be onboarded, staged, and deployed in Zero Touch fashion, which is the preferred and scalable way for deploying gateways.
The various stages involved in Zero Touch Deployment (ZTD) and best practices to be followed during ZTD implementation are discussed in detail in IoT Gateway Onboarding and Management discusses in detail. Once the gateways are registered to the Network Management Systems (NMS) Field Network Director (FND), gateways are provisioned with various features that will enable the secure bidirectional flow between IEDs in the field to SCADA applications in the Headend of the Distribution System Operator (DSO). Some of the application flow from the IEDs is via the Remote Terminal Unit (RTU) residing in the Secondary Substation to the SCADA.
Features can be broadly classified into horizontal ones like IP routing, network encryption, time synchronization (like NTP), QoS, NAT, and DHCP and vertical features like protocol translation, raw sockets, and IED-based ACLs. Appendix A: PnP Profiles provides customized and well-tested use case-based NMS templates, which is key for faster field deployment of Distribution Automation use cases.
Application Use Cases
This document addresses the following technology use cases:
Solution Network Topology and Addressing
This chapter, which discusses the various topologies used for solution validation and implementation in this guide, includes the following major topics:
■![]() Addressing in DSO Control Center2
Addressing in DSO Control Center2
Topology Diagram
This section describes the high-level solution validation topology that has been used in this Secondary Substation Implementation Guide.
High Level Solution Validation Topology
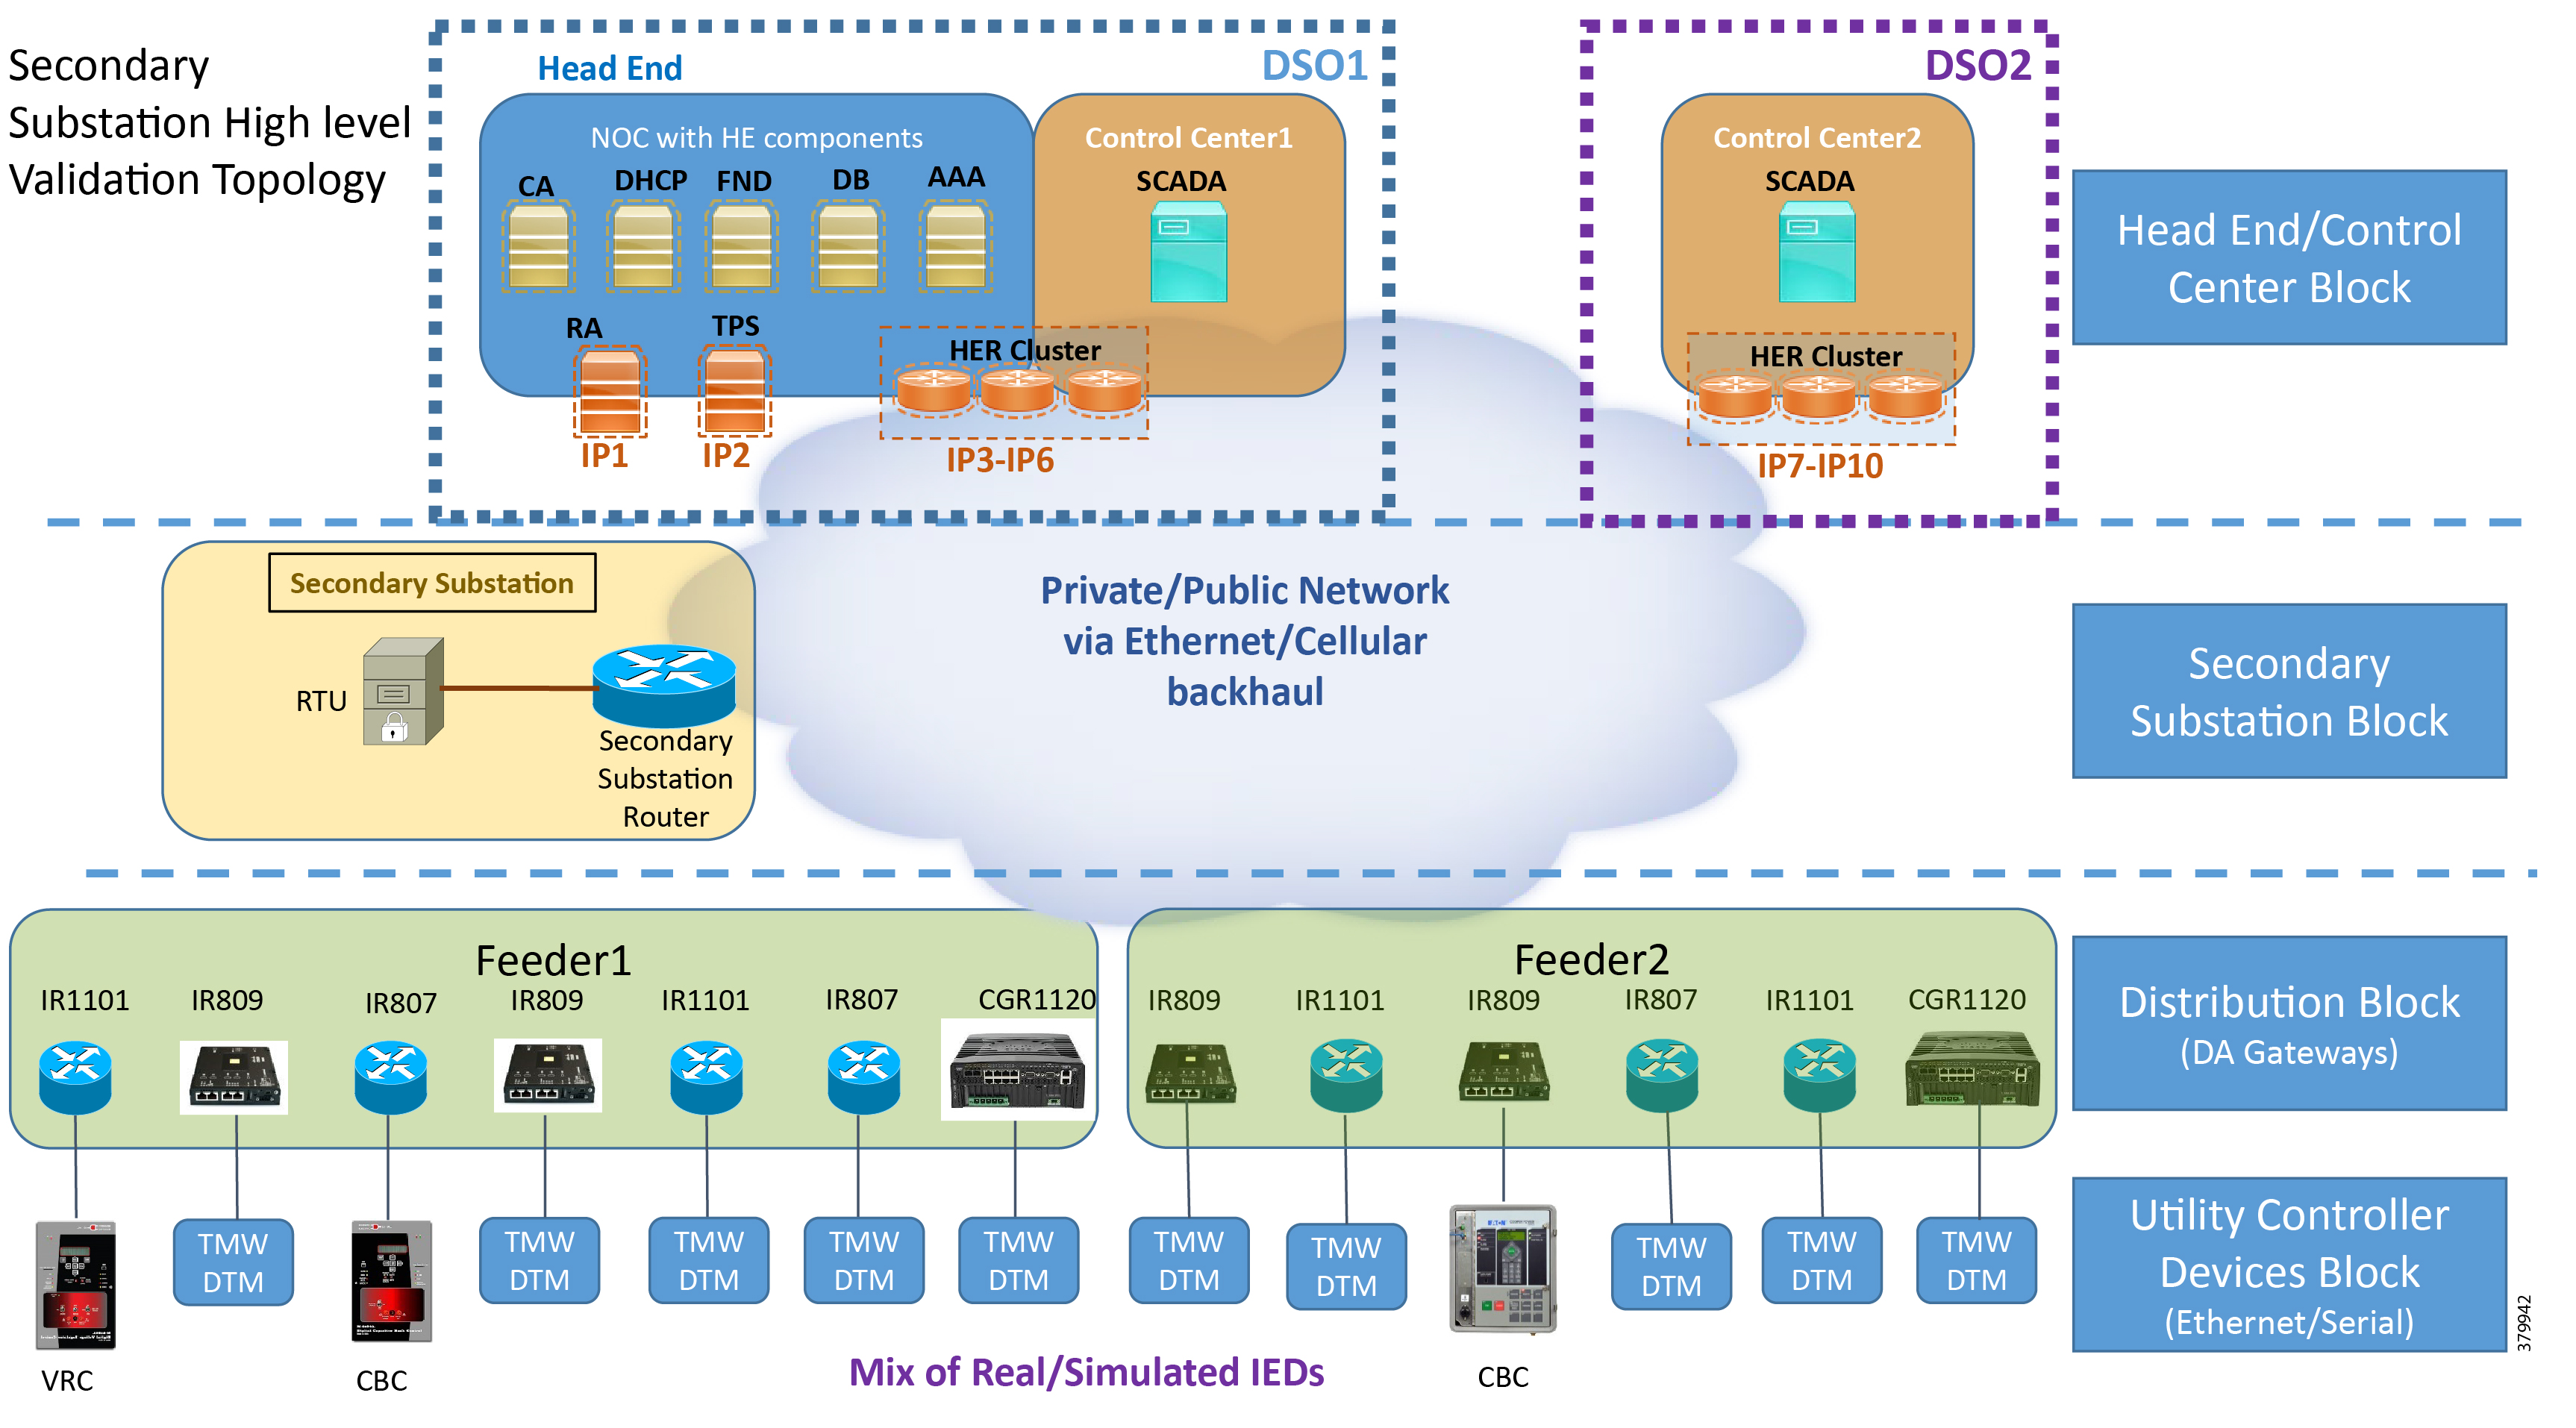
Figure 3 depicts the high level solution validation topology:
Figure 3 Secondary Substation High Level Solution Validation Topology
The multiple layers of topology include:
1.![]() Head End/Control Center Block, which hosts the DSO Control Center1 (DSO1) and DSO Control Center2 (DSO2):
Head End/Control Center Block, which hosts the DSO Control Center1 (DSO1) and DSO Control Center2 (DSO2):
a.![]() Both Control Centers host the SCADA application server. They could also host other application servers.
Both Control Centers host the SCADA application server. They could also host other application servers.
b.![]() Of the two Control Centers, DSO1 hosts the following additional components:
Of the two Control Centers, DSO1 hosts the following additional components:
- CA, Active Directory (AD), Dynamic Host Configuration Protocol (DHCP), Field Network Director (FND), Authentication, Authorization, and Accounting (AAA), Registration Authority (RA), and Tunnel Provisioning Server (TPS).
- These components are essential for the ZTD of the SSRs that are positioned in the Secondary Substation and DA Gateways that are positioned along the Distribution Feeder.
4.![]() Utility Controller Devices Block. Utility controller devices (real/simulated) are connected to the DA Gateways over a Ethernet/Serial interface.
Utility Controller Devices Block. Utility controller devices (real/simulated) are connected to the DA Gateways over a Ethernet/Serial interface.
The following components are simulated using the Triangle MicroWorks (Distributed Test Manager or DTM) tool:
1.![]() SCADA Master located in DSO1
SCADA Master located in DSO1
2.![]() SCADA Master located in DSO2
SCADA Master located in DSO2
3.![]() IEDs located in the Utility Controller Devices Block layer
IEDs located in the Utility Controller Devices Block layer
Two Instances of the Solution Validation Topology
Two instances of this topology have been used during this implementation:
1.![]() One instance is located in Cisco Engineering lab premises, with validation done over the Ethernet backhaul:
One instance is located in Cisco Engineering lab premises, with validation done over the Ethernet backhaul:
a.![]() No public internet connectivity
No public internet connectivity
b.![]() WAN Network is simulated inside the engineering lab
WAN Network is simulated inside the engineering lab
c.![]() Is referred to as the Engineering Lab Topology throughout this document
Is referred to as the Engineering Lab Topology throughout this document
2.![]() The second instance is located in the Cisco DMZ premises, with validation done over the cellular backhaul, along with Ethernet WAN:
The second instance is located in the Cisco DMZ premises, with validation done over the cellular backhaul, along with Ethernet WAN:
a.![]() Over public internet connectivity using Cellular SIM Cards, as well as over Ethernet
Over public internet connectivity using Cellular SIM Cards, as well as over Ethernet
b.![]() WAN Network is the service provider's network
WAN Network is the service provider's network
c.![]() Is referred to as Cisco DMZ Headend throughout this document.
Is referred to as Cisco DMZ Headend throughout this document.
Note: The following sections of this guide capture the IP addressing used only in the Engineering Lab topology. For security reasons, Cisco DMZ IP addresses are referred to with abstract names instead of actual IP addresses.
IPv4 and IPv6 Addressing
Addressing in DSO Control Center1
Zooming in on the DSO1 part of the Head End/Control Center block, Figure 4 captures the granular details of the DSO Control Center1:
Figure 4 DSO Control Center 1—Implementation Topology
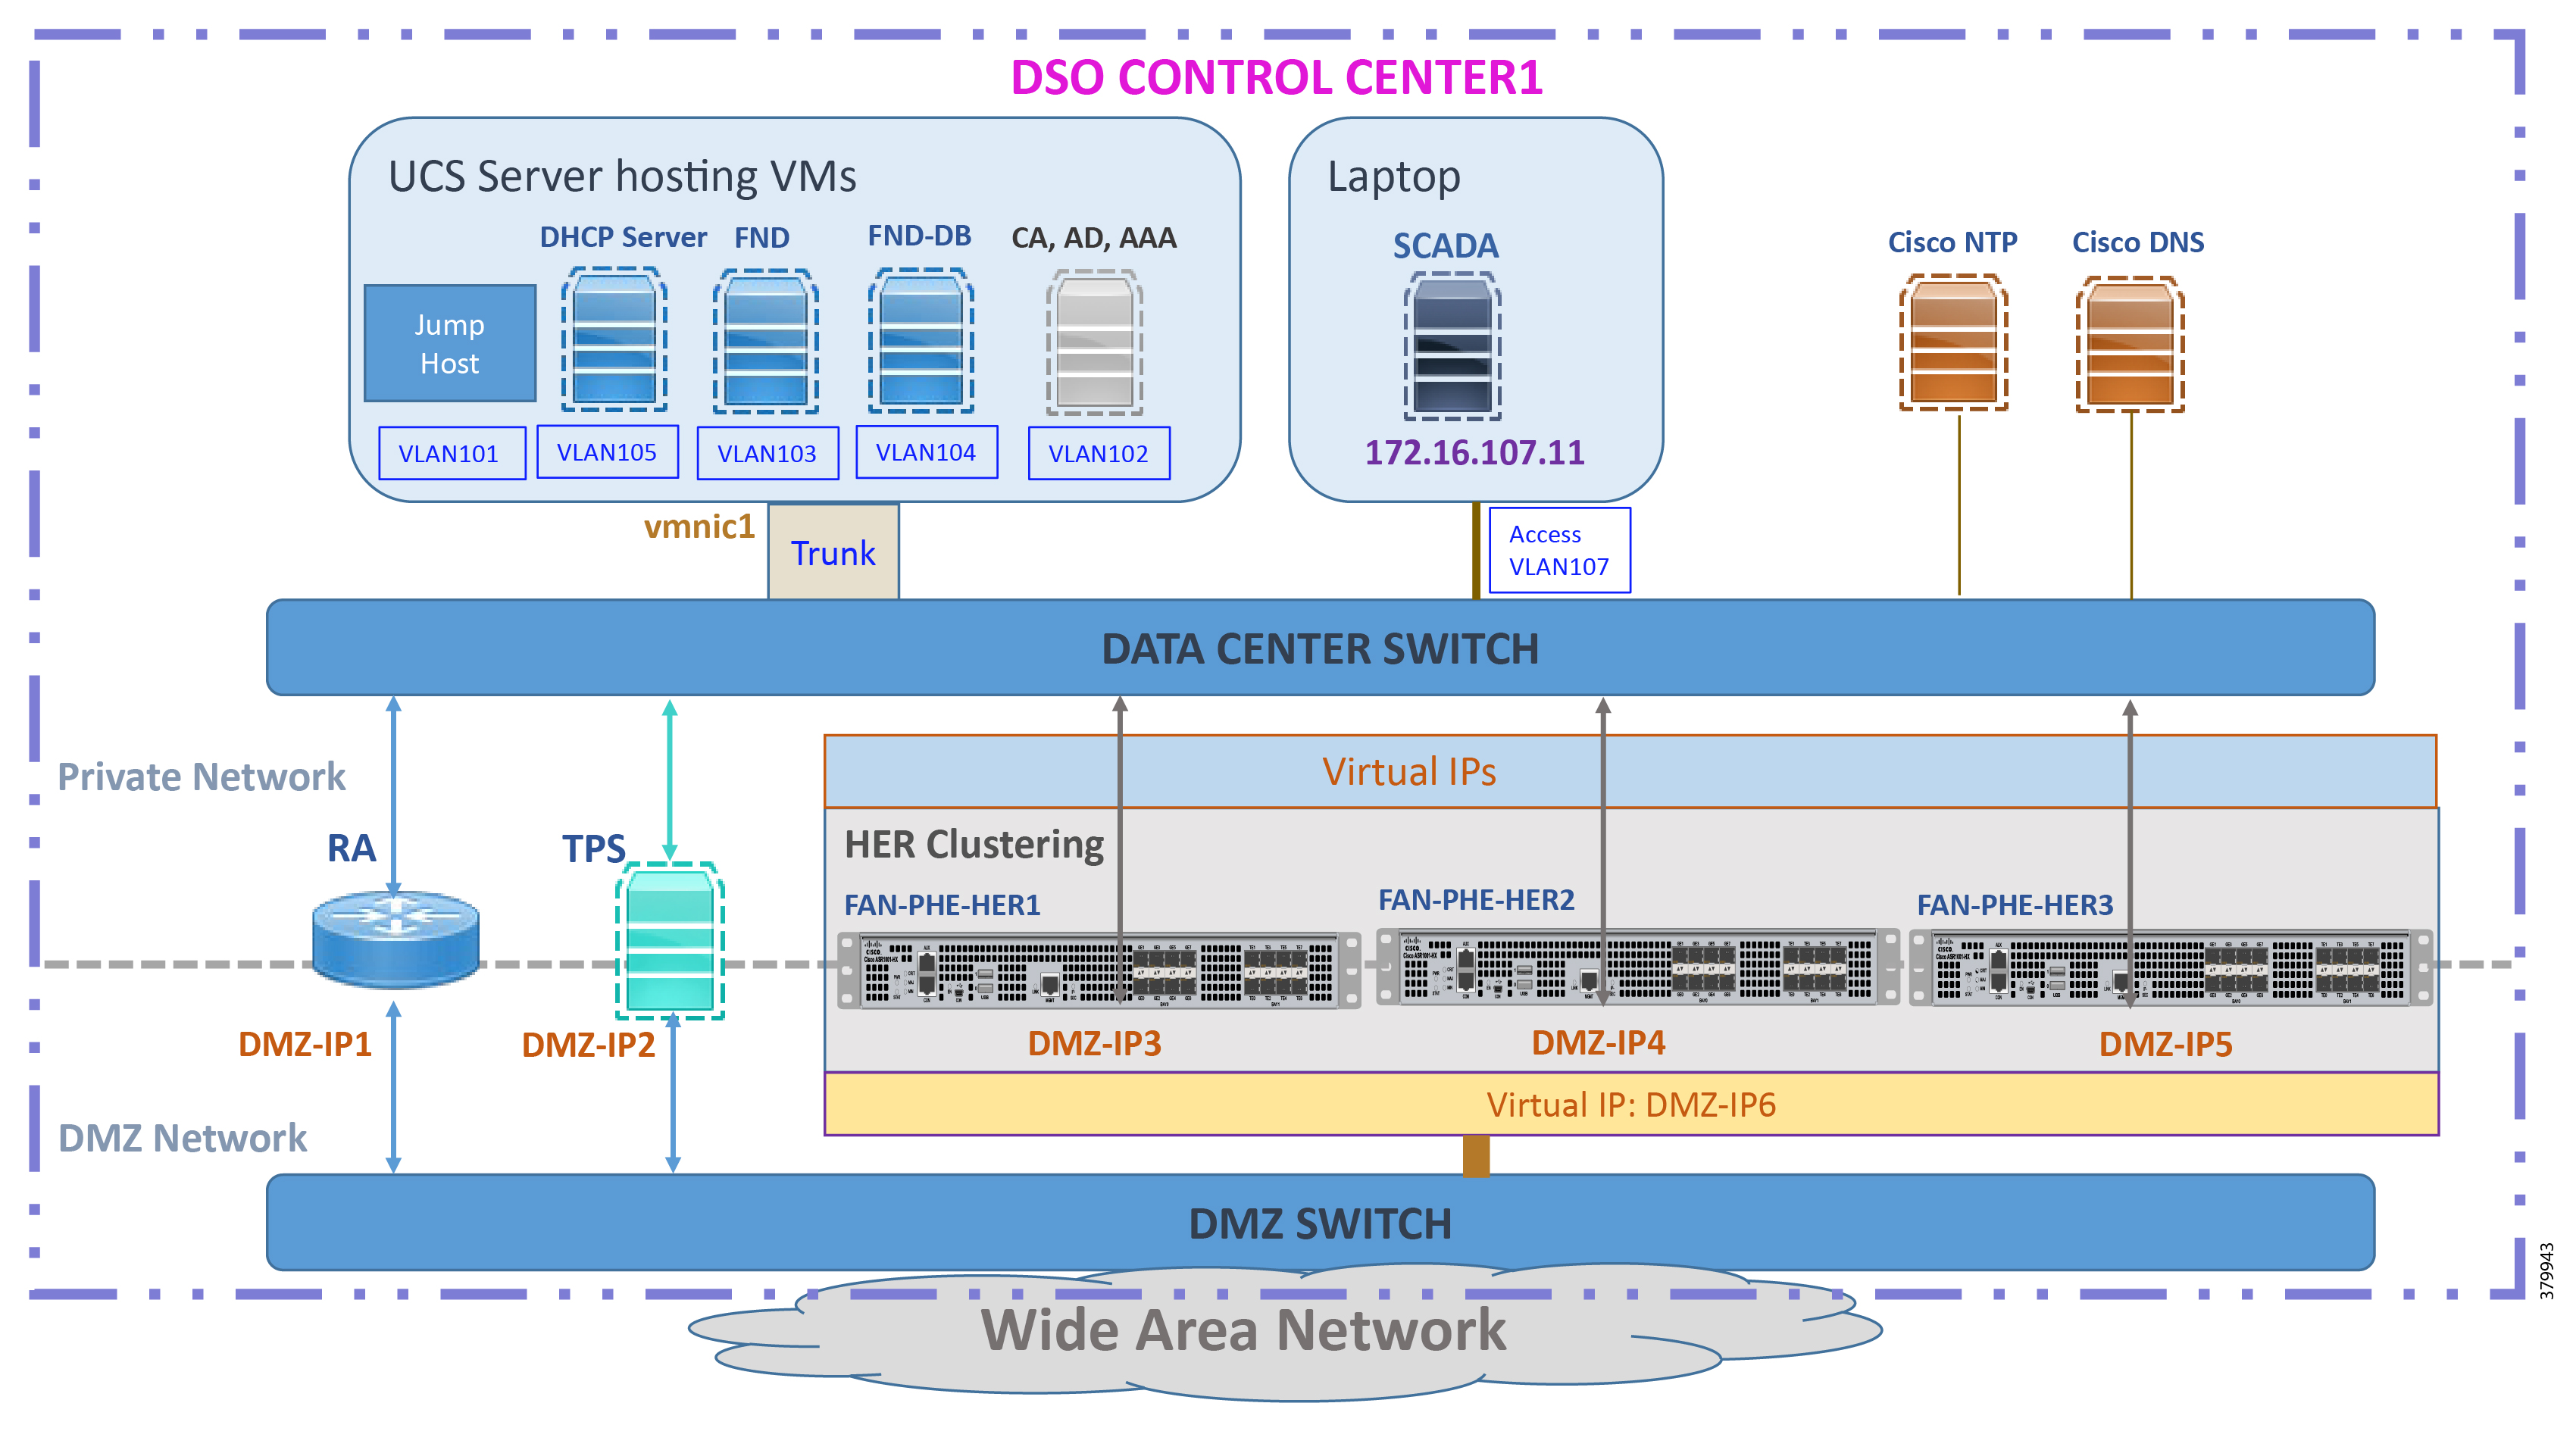
The DSO Control Center1 is composed of two different networks:
■![]() Addressing in the DMZ Network
Addressing in the DMZ Network
■![]() Addressing in the Private Network
Addressing in the Private Network
Addressing Convention Followed in the Private Network Subnet Selection
Two prefixes are used in the private network of the Control Center:
■![]() 172.16.X.yy in the Engineering Lab Topology
172.16.X.yy in the Engineering Lab Topology
■![]() 192.168.X.yy in the Cisco DMZ Headend
192.168.X.yy in the Cisco DMZ Headend
For example, 172.16.103.X represents the network connecting to FND. 172.16.107.X represents the network connecting to the SCADA server.
Note: The third octet also signifies the VLAN used to connect to the corresponding component. For example, VLAN 103 is used for communication with the FND component and VLAN 107 is used for communication with the SCADA server component.
DSO Control Center1: Addressing in the DMZ Network
The topology in Figure 4 on the previous page shows that components that are located in the DMZ Network (reachable over WAN) include the following:
■![]() Tunnel Provisioning Server (TPS)
Tunnel Provisioning Server (TPS)
■![]() HER Cluster—Cluster of ASR 1000 series of routers.
HER Cluster—Cluster of ASR 1000 series of routers.
CC1: Addressing in the Simulated DMZ Network with Engineering Lab Topology
Table 3 and Table 4 capture the IPv4 and IPv6 addresses of the RA, TPS, and HER Cluster (represented in Figure 4) in the “Engineering Lab Topology”:
Note: The Virtual IP for FAN-PHE-HER1, FAN-PHE-HER2, and FAN-PHE-HER3 is 10.10.100.150 in the Engineering Lab Topology.
CC1: Addressing in the Real DMZ Network with Cisco DMZ Headend
This section captures the addressing details of the control center components located in the real DMZ network.
For security reasons, instead of referencing real Cisco DMZ IPv4 and IPv6 addresses, the following representations are used throughout this document:
DSO Control Center1: Addressing in the Private Network
Table 5 captures the addressing details of the components located in the Private Network of Control Center1:
Addressing in DSO Control Center2
Either the Cisco ASR 1000 series of physical routers or CSR1000v series of virtual routers could be used to serve the role of headend routers (HERs). In high scale deployments, the ASR 1000 is recommended while CSR1000v might be sufficient for low scale deployment. Scale is a metric of the number of SSRs or DA Gateways that needs to be aggregated at the control center.
The ASR 1000 has been validated as part of Control Center1 and CSR1000v has been validated as part of Control Center2.
Figure 5 DSO Control Center 2—Implementation Topology
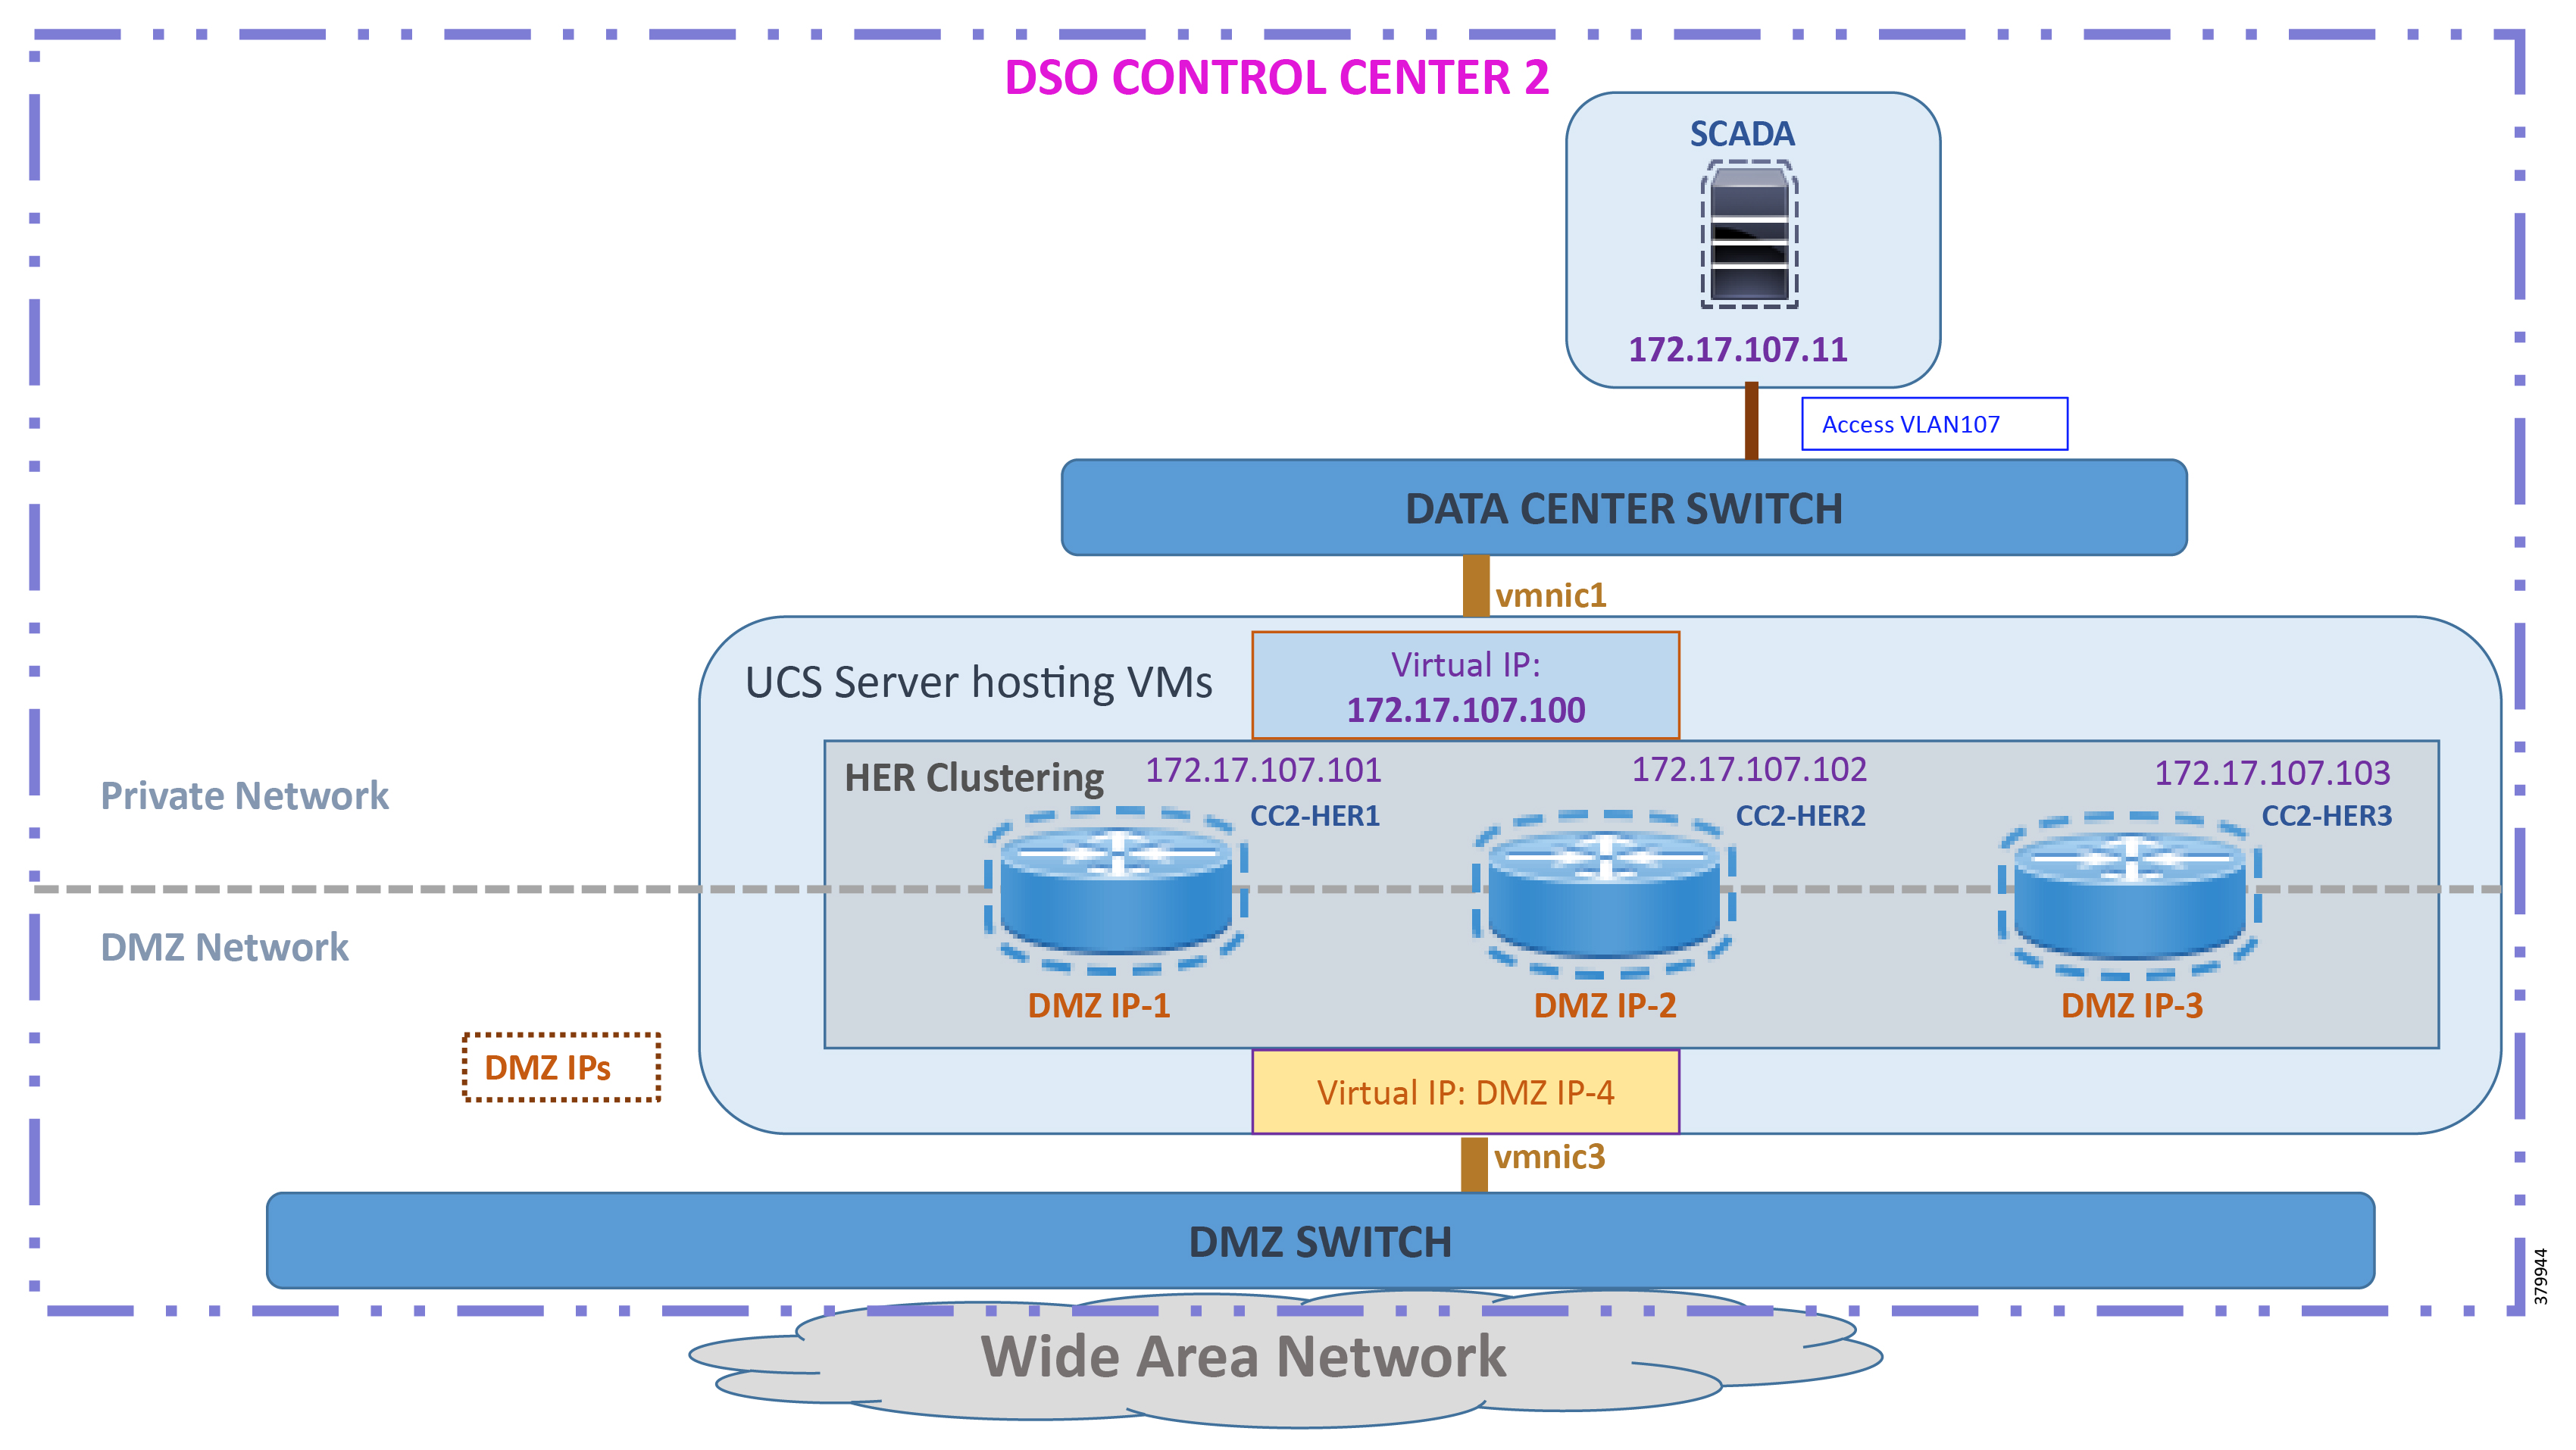
The DSO Control Center2 is comprised of two types of networks:
–![]() Simulated DMZ in the Engineering Lab Topology
Simulated DMZ in the Engineering Lab Topology
DSO Control Center2: Addressing in the DMZ Network
Similar to the DSO Control Center1, the DMZ Switch is the entry point of the WAN into the DSO Control Center2. The following components are located in the DMZ Network (reachable over WAN):
■![]() HER Cluster—implemented using CSR1000v series of virtual routers on UCS platform:
HER Cluster—implemented using CSR1000v series of virtual routers on UCS platform:
–![]() The HER Cluster performs the role of aggregating the secure tunnels from the DA Gateways and SSRs and provides connectivity to the SCADA server and other application servers.
The HER Cluster performs the role of aggregating the secure tunnels from the DA Gateways and SSRs and provides connectivity to the SCADA server and other application servers.
CC2: Addressing in the Simulated DMZ Network with Engineering Lab Topology
Table 6 and Table 7 capture the IPv4 and IPv6 addresses of the HER Cluster with the instance of the solution validation topology positioned in the Engineering Lab Topology:
Note: The Virtual IP for HER1, HER2, and HER3 is 10.10.101.100 in the Engineering Lab Topology.
CC2: Addressing in the Real DMZ Network with Cisco DMZ Headend
Table 7 captures the addressing details of the Control Center2 components located in the real DMZ network. For security reasons, instead of referencing real Cisco DMZ IPv4 and IPv6 addresses, the following representations are used throughout this document:
DSO Control Center2: Addressing in the Private Network
Table 8 captures the addressing details of the components located in the Private Network of the Control Center2:
IoT Gateway Onboarding and Management
This chapter includes the following major topics:
■![]() Two Logical Categories of Tunnel Provisioning Server/Field Network Director
Two Logical Categories of Tunnel Provisioning Server/Field Network Director
■![]() Bootstrapping of the IoT Gateway
Bootstrapping of the IoT Gateway
■![]() Deployment of the Cisco IoT Gateway
Deployment of the Cisco IoT Gateway
■![]() Bootstrapping and ZTD of the Cisco IoT Gateway at the Deployment Location
Bootstrapping and ZTD of the Cisco IoT Gateway at the Deployment Location
■![]() IoT Gateway Validation Matrix
IoT Gateway Validation Matrix
This chapter corresponds to the “Zero Touch Onboarding of Cisco IOS Routers” chapter in the Distribution Automation - Secondary Substation Design Guide. Field Network Director (FND) is used as the NMS in this solution.
IoT Gateway Onboarding has been made very simple:
1.![]() The brand new IoT Gateway could be unpacked from the box.
The brand new IoT Gateway could be unpacked from the box.
2.![]() It could be subjected to bootstrapping using plug-and-play (PnP) infrastructure.
It could be subjected to bootstrapping using plug-and-play (PnP) infrastructure.
3.![]() After bootstrapping, the IoT Gateway could be powered off and deployed at the desired deployment location. In some cases, bootstrapping could occur directly out of the deployment location itself.
After bootstrapping, the IoT Gateway could be powered off and deployed at the desired deployment location. In some cases, bootstrapping could occur directly out of the deployment location itself.
4.![]() When powered on, ZTD then happens with the IoT Gateway.
When powered on, ZTD then happens with the IoT Gateway.
5.![]() As a result, the device could be made fully operational with zero manual configuration.
As a result, the device could be made fully operational with zero manual configuration.
As part of IoT Gateway onboarding with ZTD, the IoT Gateways are registered with the FND. From that point onwards, the FND located in the Control Center could be used to remotely monitor/manage/troubleshoot the IoT Gateways (which are spread across the entire Distribution Automation Network) and the Secondary Substations.
This process has three phases:
1.![]() Bootstrapping of the IoT Gateway
Bootstrapping of the IoT Gateway
2.![]() Deployment of the IoT Gateway
Deployment of the IoT Gateway
3.![]() Remote Monitoring/Management/Troubleshooting of the IoT Gateway.
Remote Monitoring/Management/Troubleshooting of the IoT Gateway.
The design guide talks about the following two different approaches for bootstrapping versus deployment of the IoT Gateway:
■![]() Approach 1—IoT Gateway Bootstrapped in staging location, deployed in a different location
Approach 1—IoT Gateway Bootstrapped in staging location, deployed in a different location
■![]() Approach 2—IoT Gateway Bootstrapped straight out of deployed location
Approach 2—IoT Gateway Bootstrapped straight out of deployed location
Both approaches are now supported by Cisco IoT Gateways and this guide supports both the approaches.
With Approach 1, bootstrapping of the IoT Gateways is done at the dedicated staging location. Once the devices are bootstrapped successfully, they are powered off and transported to the final deployment locations, where the devices are deployed and powered on.
With Approach 2, bootstrapping of the IOT Gateways is done at the deployment location. Once the devices are bootstrapped successfully, the ZTD process begins and no manual intervention is required,
Two Logical Categories of Tunnel Provisioning Server/Field Network Director
Bootstrapping TPS/FND
The TPS/FND located in the staging/bootstrapping environment that helps with PnP bootstrapping of the IoT Gateways is referred to as bootstrapping TPS and bootstrapping FND.
Network Operating Center TPS/FND
The TPS/FND located in the NOC/Control Center environment that helps with ZTD of IoT Gateways is referred to as the NOC or Control Center TPS/FND. This TPS/FND located in the DSO Control Center helps with management of the IoT Gateways.
Note: The bootstrapping TPS/FND could be the same as or different from the NOC TPS/FND depending upon the chosen approach. With Approach 1, two different pairs of TPS/FND have been implemented. They are referred to as:
With Approach 2, the same pair of TPS/FND serves the purpose of bootstrapping TPS/FND and NOC TPS/FND.
For general implementation of TPS/FND, please refer to the detailed steps covered in the following sections of the Cisco FAN-Headend Deep Dive Implementation and FAN Use Cases guide:
■![]() Implementing Tunnel Provisioning Server
Implementing Tunnel Provisioning Server
■![]() Implementing Field Network Director
Implementing Field Network Director
The Cisco IoT Field Network Director Installation Guide could also be referred to for implementation of TPS/FND.
Note: This guide focuses on the implementation details for enhancing the TPS/FND servers to also serve the functionality of Bootstrapping TPS and Bootstrapping FND.
Note: Please refer to the “Certificate/Considerations for PnP and ZTD ” section in the Distribution Automation - Secondary Substation Design Guide for Common Name and Subject Alternate Name requirements while creating certificates for the Bootstrapping TPS/FND and NOC TPS/FND.
Bootstrapping of the IoT Gateway
Bootstrapping can also be referred to with the following terminology:
■![]() Application of manufacturing configuration onto IoT Gateway
Application of manufacturing configuration onto IoT Gateway
■![]() Generation of Express Configuration
Generation of Express Configuration
On the bootstrapping FND, import the bootstrapping csv file and then assign the IoT Gateways to the correct bootstrapping group. Bootstrapping will occur automatically when the IoT gateway is powered on.
Note: To bootstrap the IoT Gateway, in the case of Approach 1, just connect the IoT Gateway to the Ethernet PnP Staging switch, and then power it on. In the case of Approach 2, just insert the LTE SIM cards (or connect the Ethernet link) with internet access on the IoT Gateway and power it on.
Bootstrapping is achieved with the help of the Cisco Network PnP solution. This section focuses on building the infrastructure required for bootstrapping to happen. The “Cisco Network PnP - Available Methods” section of the Design Guide discusses multiple methods for PnP server discovery. Three PnP server discovery methods, which have been implemented as part of this guide, are:
■![]() PnP server discovery through Cisco PnP Connect—validated with Approach 2
PnP server discovery through Cisco PnP Connect—validated with Approach 2
■![]() PnP server discovery through DHCP server—validated with Approach 1
PnP server discovery through DHCP server—validated with Approach 1
■![]() PnP server discovery through manual PnP profile—validated with Approach 1
PnP server discovery through manual PnP profile—validated with Approach 1
Preparing the Bootstrapping Infrastructure
The bootstrapping infrastructure, which involves multiple actors, is captured in Table 9:
This section is discussed in the following phases:
■![]() Certificate Creation and Installation
Certificate Creation and Installation
■![]() Installation of Bootstrapping TPS
Installation of Bootstrapping TPS
■![]() Installation of Bootstrapping FND
Installation of Bootstrapping FND
Prerequisites
Prerequisites include the following:
■![]() TPS and FND server must be up and running.
TPS and FND server must be up and running.
■![]() This section focuses only on the incremental portions to make the regular TPS/FND as bootstrapping TPS/FND.
This section focuses only on the incremental portions to make the regular TPS/FND as bootstrapping TPS/FND.
■![]() Routing reachability over IPv4 and/or IPv6 networks from IoT Gateways to TPS.
Routing reachability over IPv4 and/or IPv6 networks from IoT Gateways to TPS.
Certificate Creation and Installation
This section captures the parameters that need to be considered while creating the certificate for the TPS (PnP Proxy) and FND (PnP server).
Note: For detailed instructions about certificate creation, please refer to the section “Creation of Certificate Templates and Certificates” of the Cisco FAN-Headend Deep Dive Guide at the following URL:
■![]() https://salesconnect.cisco.com/#/content-detail/da249429-ec79-49fc-9471-0ec859e83872
https://salesconnect.cisco.com/#/content-detail/da249429-ec79-49fc-9471-0ec859e83872
Implementation and FAN Use Cases are available under Cisco SalesConnect.
Certificate Creation for Bootstrapping TPS
The certificate for the TPS must be created with both the Subject Name and the Subject Alternative Name fields populated.
Figure 6 TPS Certificate Parameters for PnP Bootstrapping
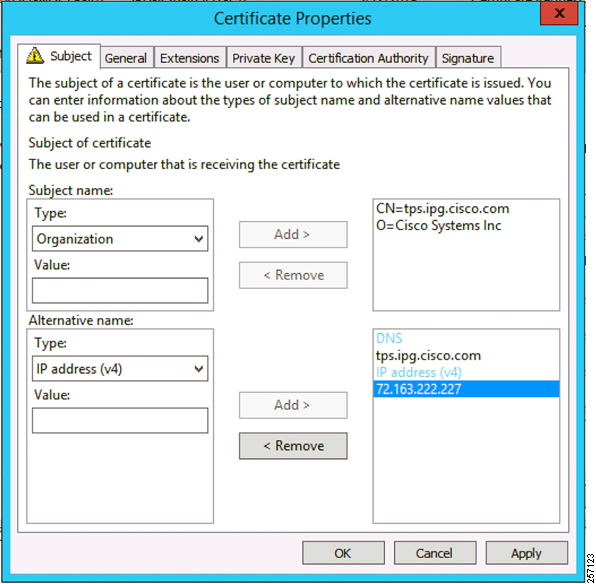
The Subject Name is the Common Name that must be set to the FQDN of the PnP Proxy.
The Subject Alternative Name must be set to the FQDN of the PnP Proxy, along with the optional IP address. The Subject Alternative Name is required for PnP to work.
The enrolled certificate is exported as PnP-TPS.pfx and is protected with a password.
Certificate Creation for Bootstrapping FND
The FND certificate must be created with both the Subject Name and Subject Alternative Name fields populated.
Figure 7 FND Certificate Parameters for FND Bootstrapping
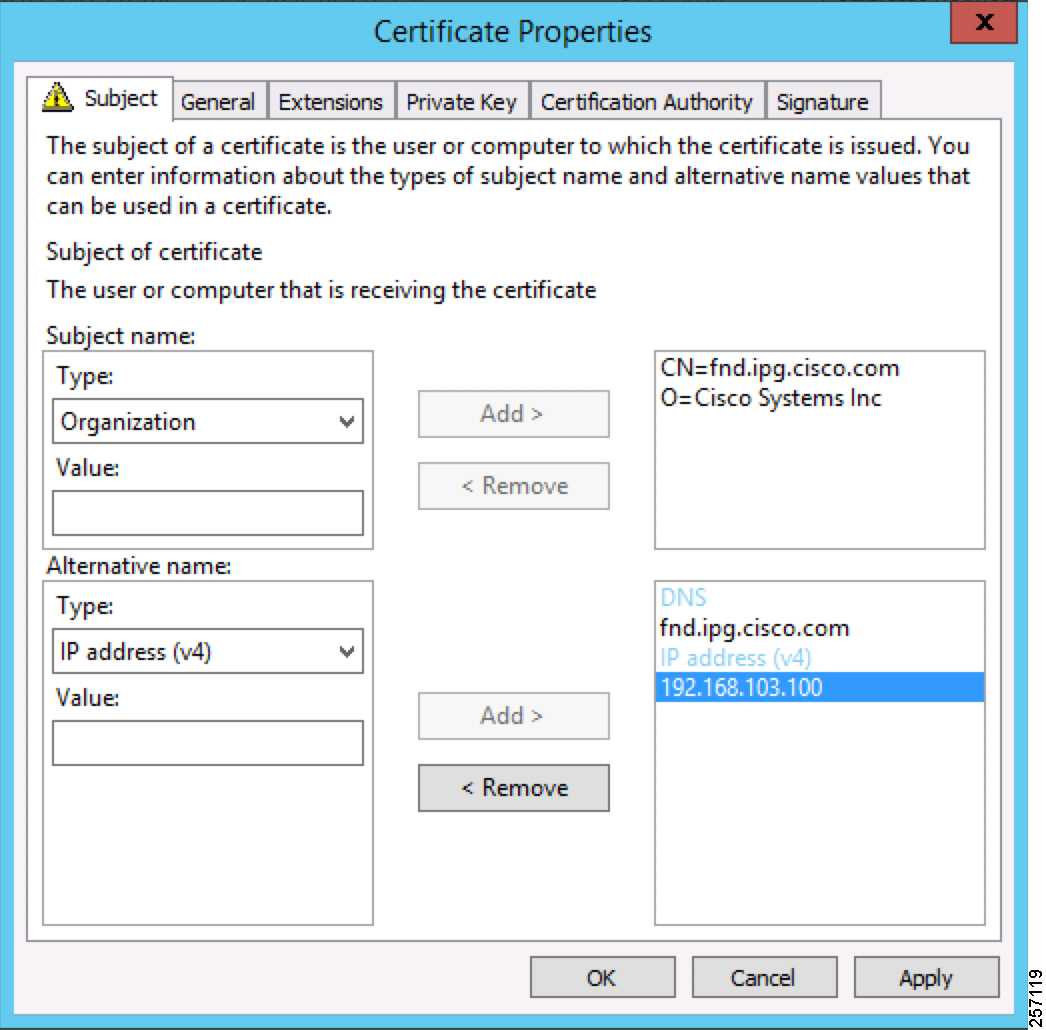
The Subject Name is the Common Name that must be set to the FQDN of the PnP Server.
The Subject Alternative Name must be set to the FQDN of the PnP Server, along with the optional IP address. The Subject Alternative Name is required for PnP to work.
The enrolled certificate is exported as PnP-FND.pfx and is protected with a password.
Installation of Bootstrapping TPS
The bootstrapping procedure in this implementation considers the use of TPS as PnP Proxy.
Note: As TPS is used in this implementation, TPS would represent itself as the PnP server for the IoT Gateways. Therefore, TPS is referred to as the PnP Proxy.
For installation of TPS, please refer to the detailed steps covered under the section “Implementing Tunnel Provisioning Server” of the Cisco FAN-Headend Deep Dive Implementation and FAN Use Cases guide at the following URL:
■![]() https://salesconnect.cisco.com/#/content-detail/da249429-ec79-49fc-9471-0ec859e83872
https://salesconnect.cisco.com/#/content-detail/da249429-ec79-49fc-9471-0ec859e83872
TPS Certificate Installation on the Bootstrapping TPS
For installation of the certificate on the Bootstrapping TPS, please refer to the detailed steps covered under the section
“Certificate Enrollment Phase for TPS Proxy Server” of the Cisco FAN - Headend Deep Dive Implementation and FAN Use Cases Guide.
Note: Please use PnP-TPS.pfx instead of TPS.pfx while enrolling the certificate on the TPS.
Following are the crisp steps:
# To view the content of the “Pnp-TPS.pfx” certificate:
Cisco SUDI Certificate Installation on the Bootstrapping TPS
Cisco SUDI CA can be installed into the cgms_keystore of TPS using the following command:
The Cisco SUDI CA file “cisco-sudi-ca.pem” can be fetched from the FND.
Installation of Bootstrapping FND
For installation of FND, please refer to the detailed steps covered under the section “Implementing Field Network Director” of the Cisco FAN-Headend Deep Dive Implementation and FAN Use Cases Guide at the following URL:
■![]() https://salesconnect.cisco.com/#/content-detail/da249429-ec79-49fc-9471-0ec859e83872
https://salesconnect.cisco.com/#/content-detail/da249429-ec79-49fc-9471-0ec859e83872
FND Certificate Installation on the Bootstrapping FND
For installation of certificate on the Bootstrapping FND, please refer to the detailed steps covered under the section “Certificate Enrollment onto FND's Keystore” of the Cisco FAN Headend Deep Dive Implementation and FAN Use Cases Guide.
Note: Please use PnP-FND.pfx instead of FND.pfx while enrolling the certificate on the FND.
Cisco SUDI Certificate Installation on the Bootstrapping FND
Cisco SUDI CA can be installed into the cgms_keystore of FND using the following command:
Configuration of Bootstrapping TPS
This section covers the configuration steps and the final verification steps on the TPS.
TPS Proxy Properties Configuration
TPS Proxy Properties file needs to be configured with the following details:
■![]() inbound-bsproxy-destination: Address to which the bootstrapping requests be forwarded.
inbound-bsproxy-destination: Address to which the bootstrapping requests be forwarded.
■![]() enable-bootstrap-service: Is bootstrapping service enabled/disabled?
enable-bootstrap-service: Is bootstrapping service enabled/disabled?
■![]() bootstrap-proxy-listen-port: Port on which the PnP Proxy must be listening for processing bootstrapping requests (default port is 9125).
bootstrap-proxy-listen-port: Port on which the PnP Proxy must be listening for processing bootstrapping requests (default port is 9125).
Name resolution entries have to be present for FND FQDN in the /etc/hosts file.
Mandatory Verification Checks on TPS Proxy
The verification checks include the following:
■![]() FND FQDN entry in /etc/hosts.
FND FQDN entry in /etc/hosts.
■![]() TPS must have three certificates installed into the cgms_keystore:
TPS must have three certificates installed into the cgms_keystore:
–![]() Certificate signed by Utility PKI for TPS (with private key)
Certificate signed by Utility PKI for TPS (with private key)
–![]() Public Certificate of the Utility PKI CA server
Public Certificate of the Utility PKI CA server
–![]() Public Certificate of the Cisco SUDI CA
Public Certificate of the Cisco SUDI CA
■![]() Hostname consistency with the certificate.
Hostname consistency with the certificate.
■![]() There shouldn't be any unreachable name servers in /etc/resolv.conf.
There shouldn't be any unreachable name servers in /etc/resolv.conf.
■![]() NTP daemon should be running. Time should be synchronized.
NTP daemon should be running. Time should be synchronized.
■![]() Necessary firewall ports must have been opened up, if the firewall/iptables/ip6tables are enabled:
Necessary firewall ports must have been opened up, if the firewall/iptables/ip6tables are enabled:
–![]() TCP Port 9125 to process http communication
TCP Port 9125 to process http communication
–![]() TCP port 9120 to process https communication
TCP port 9120 to process https communication
TPS must have three certificates installed into the cgms_keystore:
■![]() The certificate entry 'root' represents the Utility PKI CA certificate.
The certificate entry 'root' represents the Utility PKI CA certificate.
■![]() The certificate entry 'sudi' represents the Cisco SUDI CA certificate.
The certificate entry 'sudi' represents the Cisco SUDI CA certificate.
■![]() The certificate entry 'cgms' represents the private certificate of the TPS server signed by the (custom) Utility PKI CA server.
The certificate entry 'cgms' represents the private certificate of the TPS server signed by the (custom) Utility PKI CA server.
keytool -list -keystore /opt/cgms-tpsproxy/conf/cgms_keystore:
Hostname should match certificate Common Name/SAN:
No unreachable name servers should exist. Either the name servers should be present and reachable or they should be empty. Any unreachable name server address entry must be taken care of or removed under the network interface configuration.
NTP daemon should be running. Time should be synchronized:
Note: The TPS server should be time synchronized. Otherwise, the https communication from the IoT Gateway might not reach the TPS Proxy Application.
Configuration of Bootstrapping FND
This section covers the configuration steps and the final verification steps on the FND.
The CGMS Properties file needs to be configured with the following details:
■![]() proxy-bootstrap-ip: Address of the PnP Proxy from which the bootstrapping requests are processed
proxy-bootstrap-ip: Address of the PnP Proxy from which the bootstrapping requests are processed
■![]() enable-bootstrap-service: Enable/Disable the bootstrapping service
enable-bootstrap-service: Enable/Disable the bootstrapping service
■![]() bootstrap-fnd-alias: The trust point alias to be used during bootstrapping of the IoT Gateway
bootstrap-fnd-alias: The trust point alias to be used during bootstrapping of the IoT Gateway
■![]() ca-fingerprint: fingerprint of the 'root' trustpoint
ca-fingerprint: fingerprint of the 'root' trustpoint
Name resolution entries have to be present for TPS FQDN in the /etc/hosts file.
The IOT gateway should be able to communicate with the value given against the proxy-bootstrap-ip. IF IPv4 is used, it must be reachable from the IOT gateway. If FQDN is used, it must be DNS resolvable and reachable from the IoT gateway.
Mandatory Verification Checks on FND
Verification checks include the following:
■![]() TPS FQDN entry in the /etc/hosts file.
TPS FQDN entry in the /etc/hosts file.
■![]() FND must have three certificates installed into the cgms_keystore:
FND must have three certificates installed into the cgms_keystore:
–![]() Certificate signed by Utility PKI for FND (with private key)
Certificate signed by Utility PKI for FND (with private key)
–![]() Public Certificate of the Utility PKI CA server
Public Certificate of the Utility PKI CA server
–![]() Public Certificate of the Cisco SUDI CA
Public Certificate of the Cisco SUDI CA
■![]() Hostname must be consistent with the certificate.
Hostname must be consistent with the certificate.
■![]() No unreachable name servers in /etc/resolv.conf should exist.
No unreachable name servers in /etc/resolv.conf should exist.
■![]() NTP daemon should be running. Time should be synchronized.
NTP daemon should be running. Time should be synchronized.
■![]() Necessary firewall ports must have been opened up if the firewall/iptables/ip6tables are enabled:
Necessary firewall ports must have been opened up if the firewall/iptables/ip6tables are enabled:
–![]() TCP Port 9125 to process http communication
TCP Port 9125 to process http communication
–![]() TCP port 9120 to process https communication
TCP port 9120 to process https communication
TPS/FND FQDN entry in the /etc/hosts file:
[root@tps-san ~]#
FND must have three certificates installed into the cgms_keystore:
■![]() The certificate entry 'root' represents the Utility PKI CA certificate.
The certificate entry 'root' represents the Utility PKI CA certificate.
■![]() The certificate entry 'sudi' represents the Cisco SUDI CA certificate.
The certificate entry 'sudi' represents the Cisco SUDI CA certificate.
■![]() The certificate entry 'cgms' represents the private certificate of the FND server signed by the (custom) Utility PKI CA server.
The certificate entry 'cgms' represents the private certificate of the FND server signed by the (custom) Utility PKI CA server.
Hostname should match the certificate Common Name/SAN:
No unreachable name servers should exist. Either the name servers should be present and reachable or they should be empty. Any unreachable name server address entry must be taken care or removed under the network interface configuration:
NTP daemon should be running. Time should be synchronized:
Note: The FND server should be time synchronized. Otherwise, the https communication from the IoT Gateway might not reach the FND (cgms) application.
A sample csv file that can be imported into FND for bootstrapping of IoT Gateway is shown below:
Obtain the <encrypted_pwd> for the adminPassword field using the following step (from FND Linux shell prompt):
/opt/cgms-tools/bin/signature-tool encrypt /opt/cgms/server/cgms/conf/cgms_keystore password-file.txt
For more details, please refer to the following URL:
■![]() https://www.cisco.com/c/en/us/support/docs/cloud-systems-management/iot-field-network-director/210446-Prepare-csv-Comma-Separated-Value-fil.html
https://www.cisco.com/c/en/us/support/docs/cloud-systems-management/iot-field-network-director/210446-Prepare-csv-Comma-Separated-Value-fil.html
Figure 8 Bootstrapping CSV Import at Bootstrapping FND
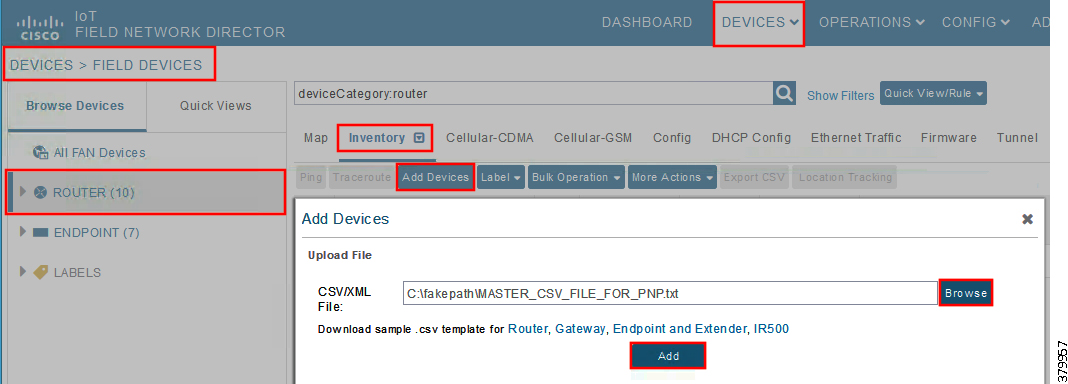
In bootstrapping FND, from Devices > Field Devices, click Router in the left pane, click the Inventory tab on the middle pane, click Add Devices, browse the csv file created in the previous step, and then click Add to import the IoT Gateway CSV list into the bootstrapping FND.
PnP Server Discovery through DHCP and Bootstrapping
This section is discussed in the following phases:
■![]() Bootstrapping in the IPv4 Network
Bootstrapping in the IPv4 Network
Prerequisites
PnP Proxy must be reachable either over the LAN or over the WAN/Internet. As TPS is used in this implementation, TPS acts as the PnP server for the IoT Gateways. The DHCP server advertises TPS details in place of the PnP server details.
Bootstrapping in the IPv4 Network
This section discusses the DHCP server-assisted bootstrapping of the IoT Gateways over the IPv4 network.
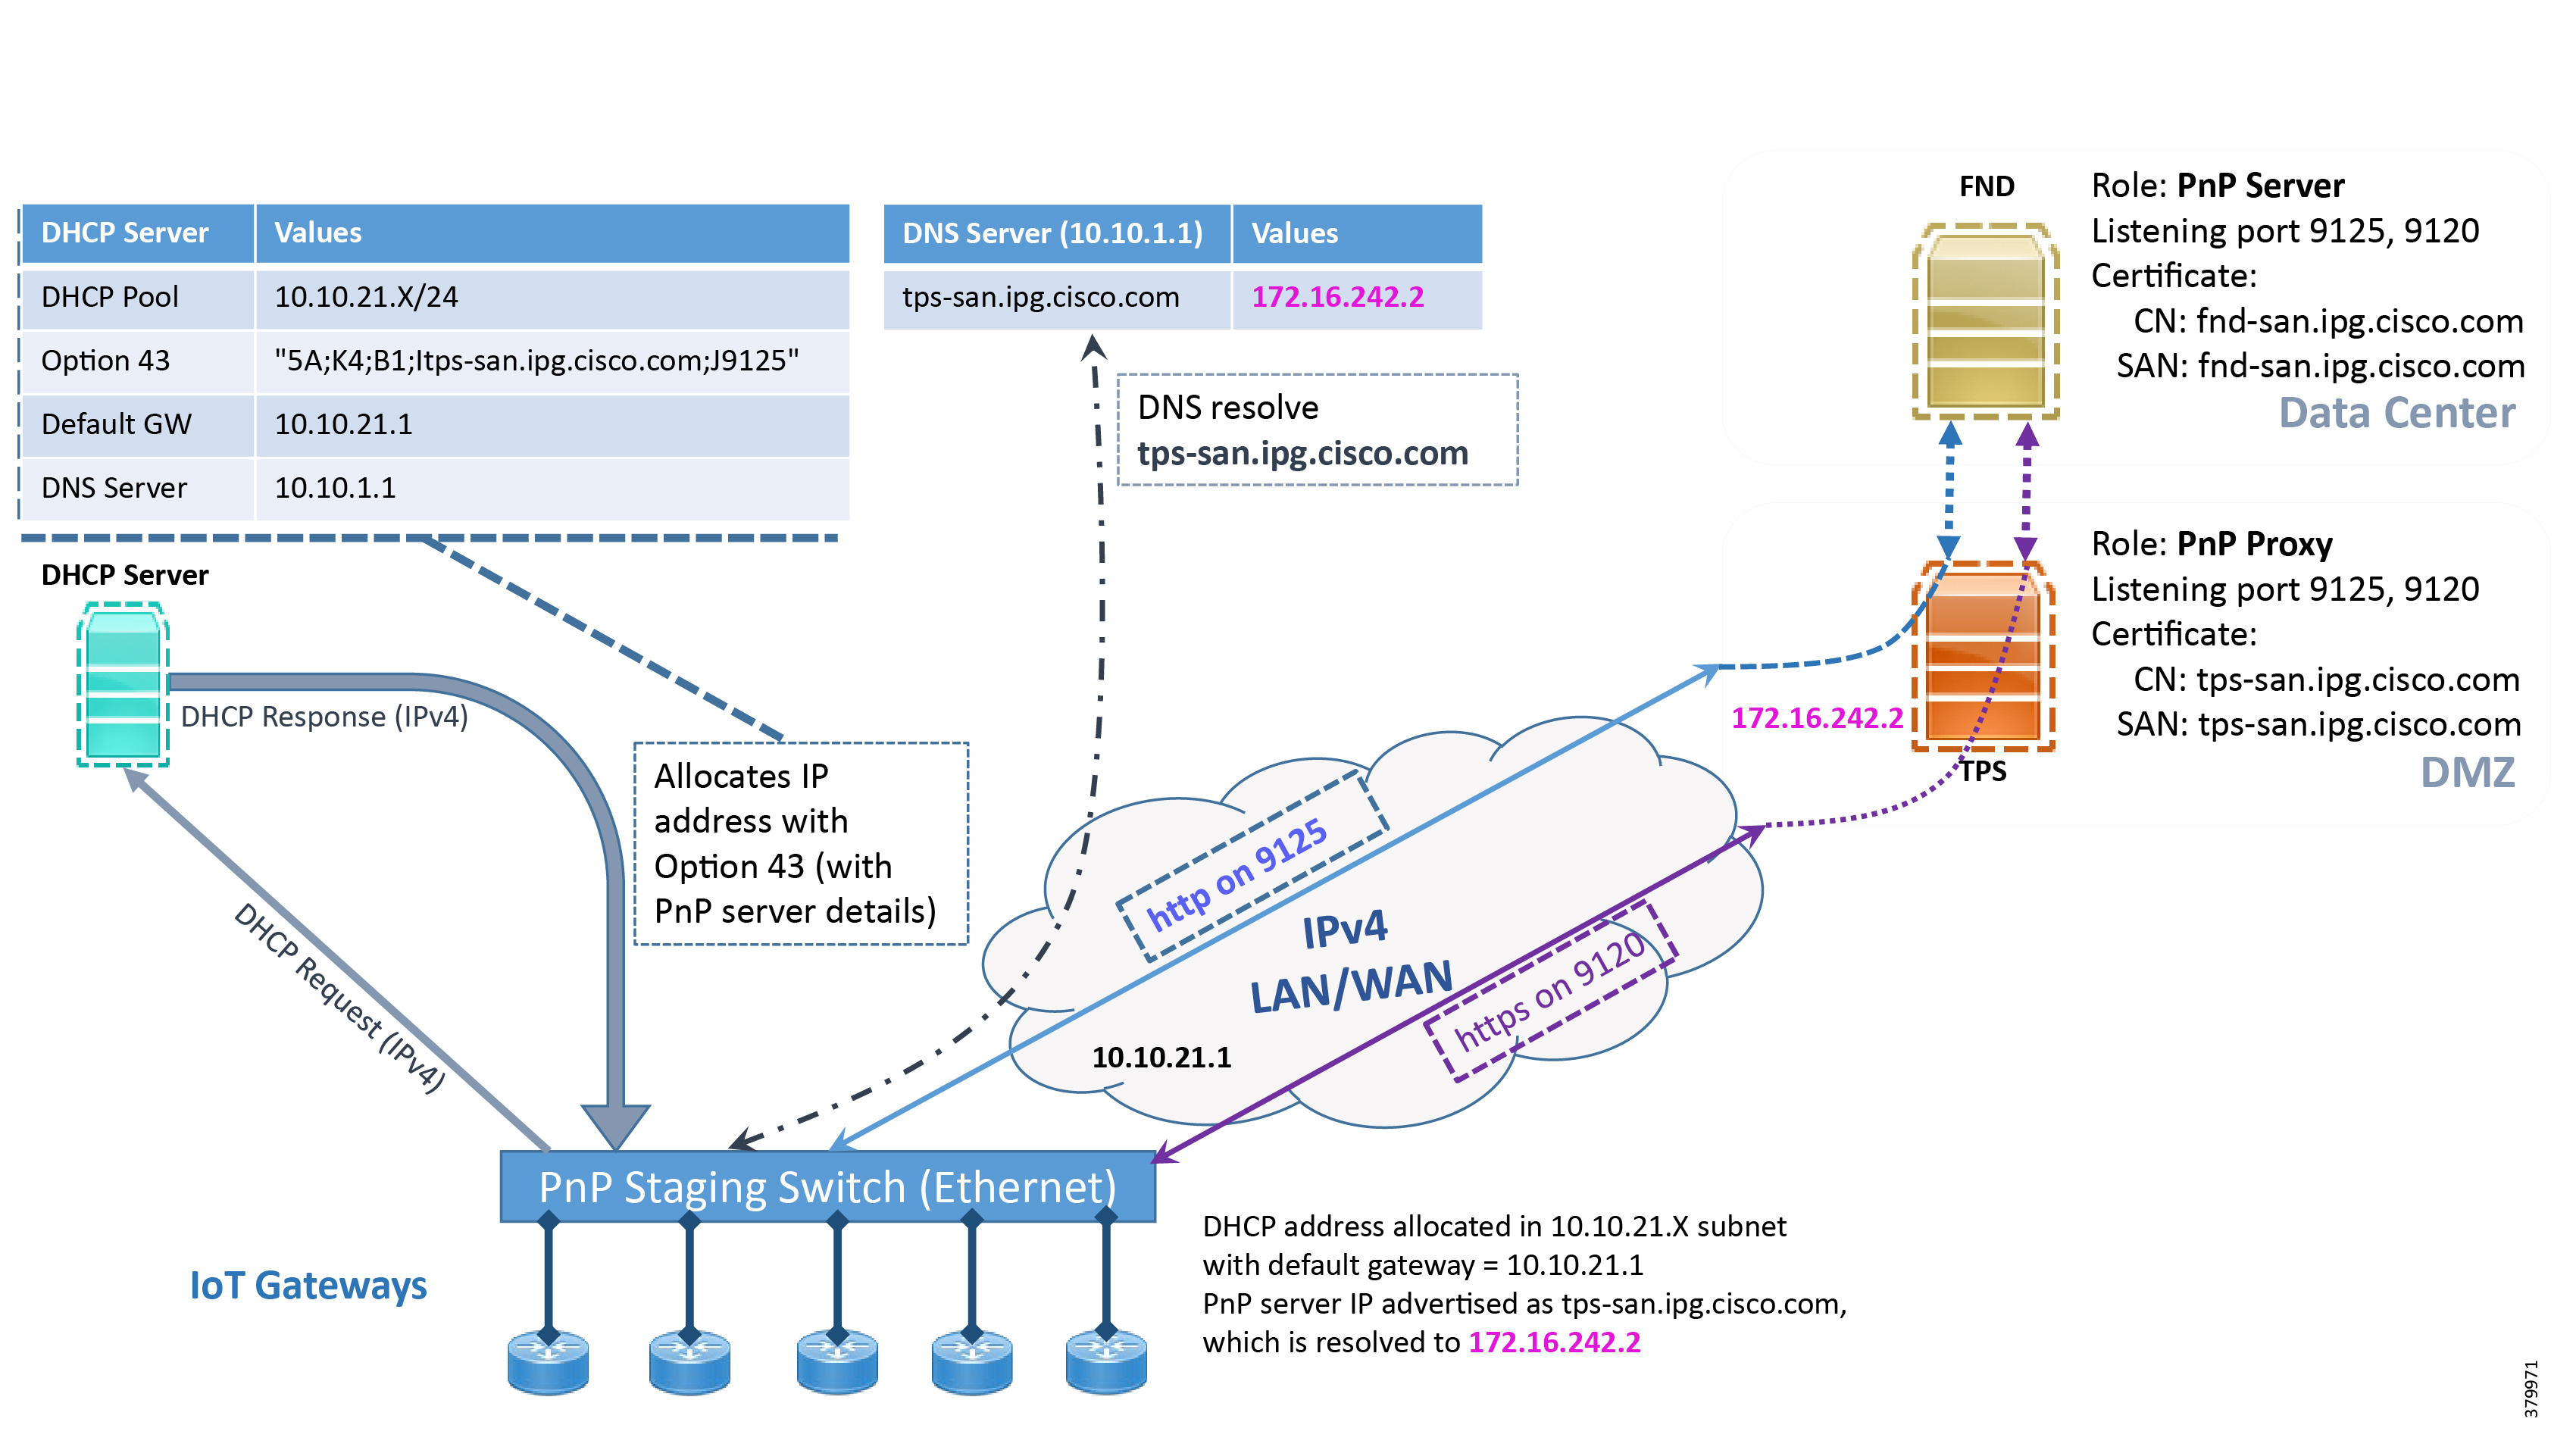
In Figure 9, IoT Gateways obtain the IP address dynamically from the DHCP server along with details of the PnP server (which, in this case, is actually that of PnP Proxy, as TPS is deployed).
■![]() The PnP server details are received using DHCP option 43.
The PnP server details are received using DHCP option 43.
■![]() The PnP agent (residing on the IoT Gateway) then reaches out to PnP Proxy over IPv4 LAN/WAN network over http on port 9125 and then over https on port 9120.
The PnP agent (residing on the IoT Gateway) then reaches out to PnP Proxy over IPv4 LAN/WAN network over http on port 9125 and then over https on port 9120.
Figure 9 DHCP Server-Assisted Bootstrapping of IoT Gateways over IPv4 Network
Bootstrapping in the IPv6 Network
This section discusses the DHCP server-assisted bootstrapping of the IoT Gateways over the IPv6 network.
In Figure 10:
■![]() IoT Gateways obtains the IP address dynamically from the DHCP server along with details of the PnP server (which, in this case, is actually that of PnP Proxy, as TPS is deployed).
IoT Gateways obtains the IP address dynamically from the DHCP server along with details of the PnP server (which, in this case, is actually that of PnP Proxy, as TPS is deployed).
■![]() The PnP server details are received using DHCP option 9.
The PnP server details are received using DHCP option 9.
■![]() The PnP agent (residing on the IoT Gateway) then reaches out to PnP Proxy over IPv6 LAN/WAN network over http on port 9125 and then over https on port 9120.
The PnP agent (residing on the IoT Gateway) then reaches out to PnP Proxy over IPv6 LAN/WAN network over http on port 9125 and then over https on port 9120.
Figure 10 DHCP Server-Assisted Bootstrapping of IoT Gateways over IPv6 Network

Logical Call Flow
This section discusses the logical call flow sequence with the DHCP server-assisted bootstrapping of the IoT Gateways over the IPv4/IPv6 network.
The actors shown in Figure 10 are the following:
Figure 11 DHCP Server-Assisted Bootstrapping of IoT Gateways—Logical Call Flow
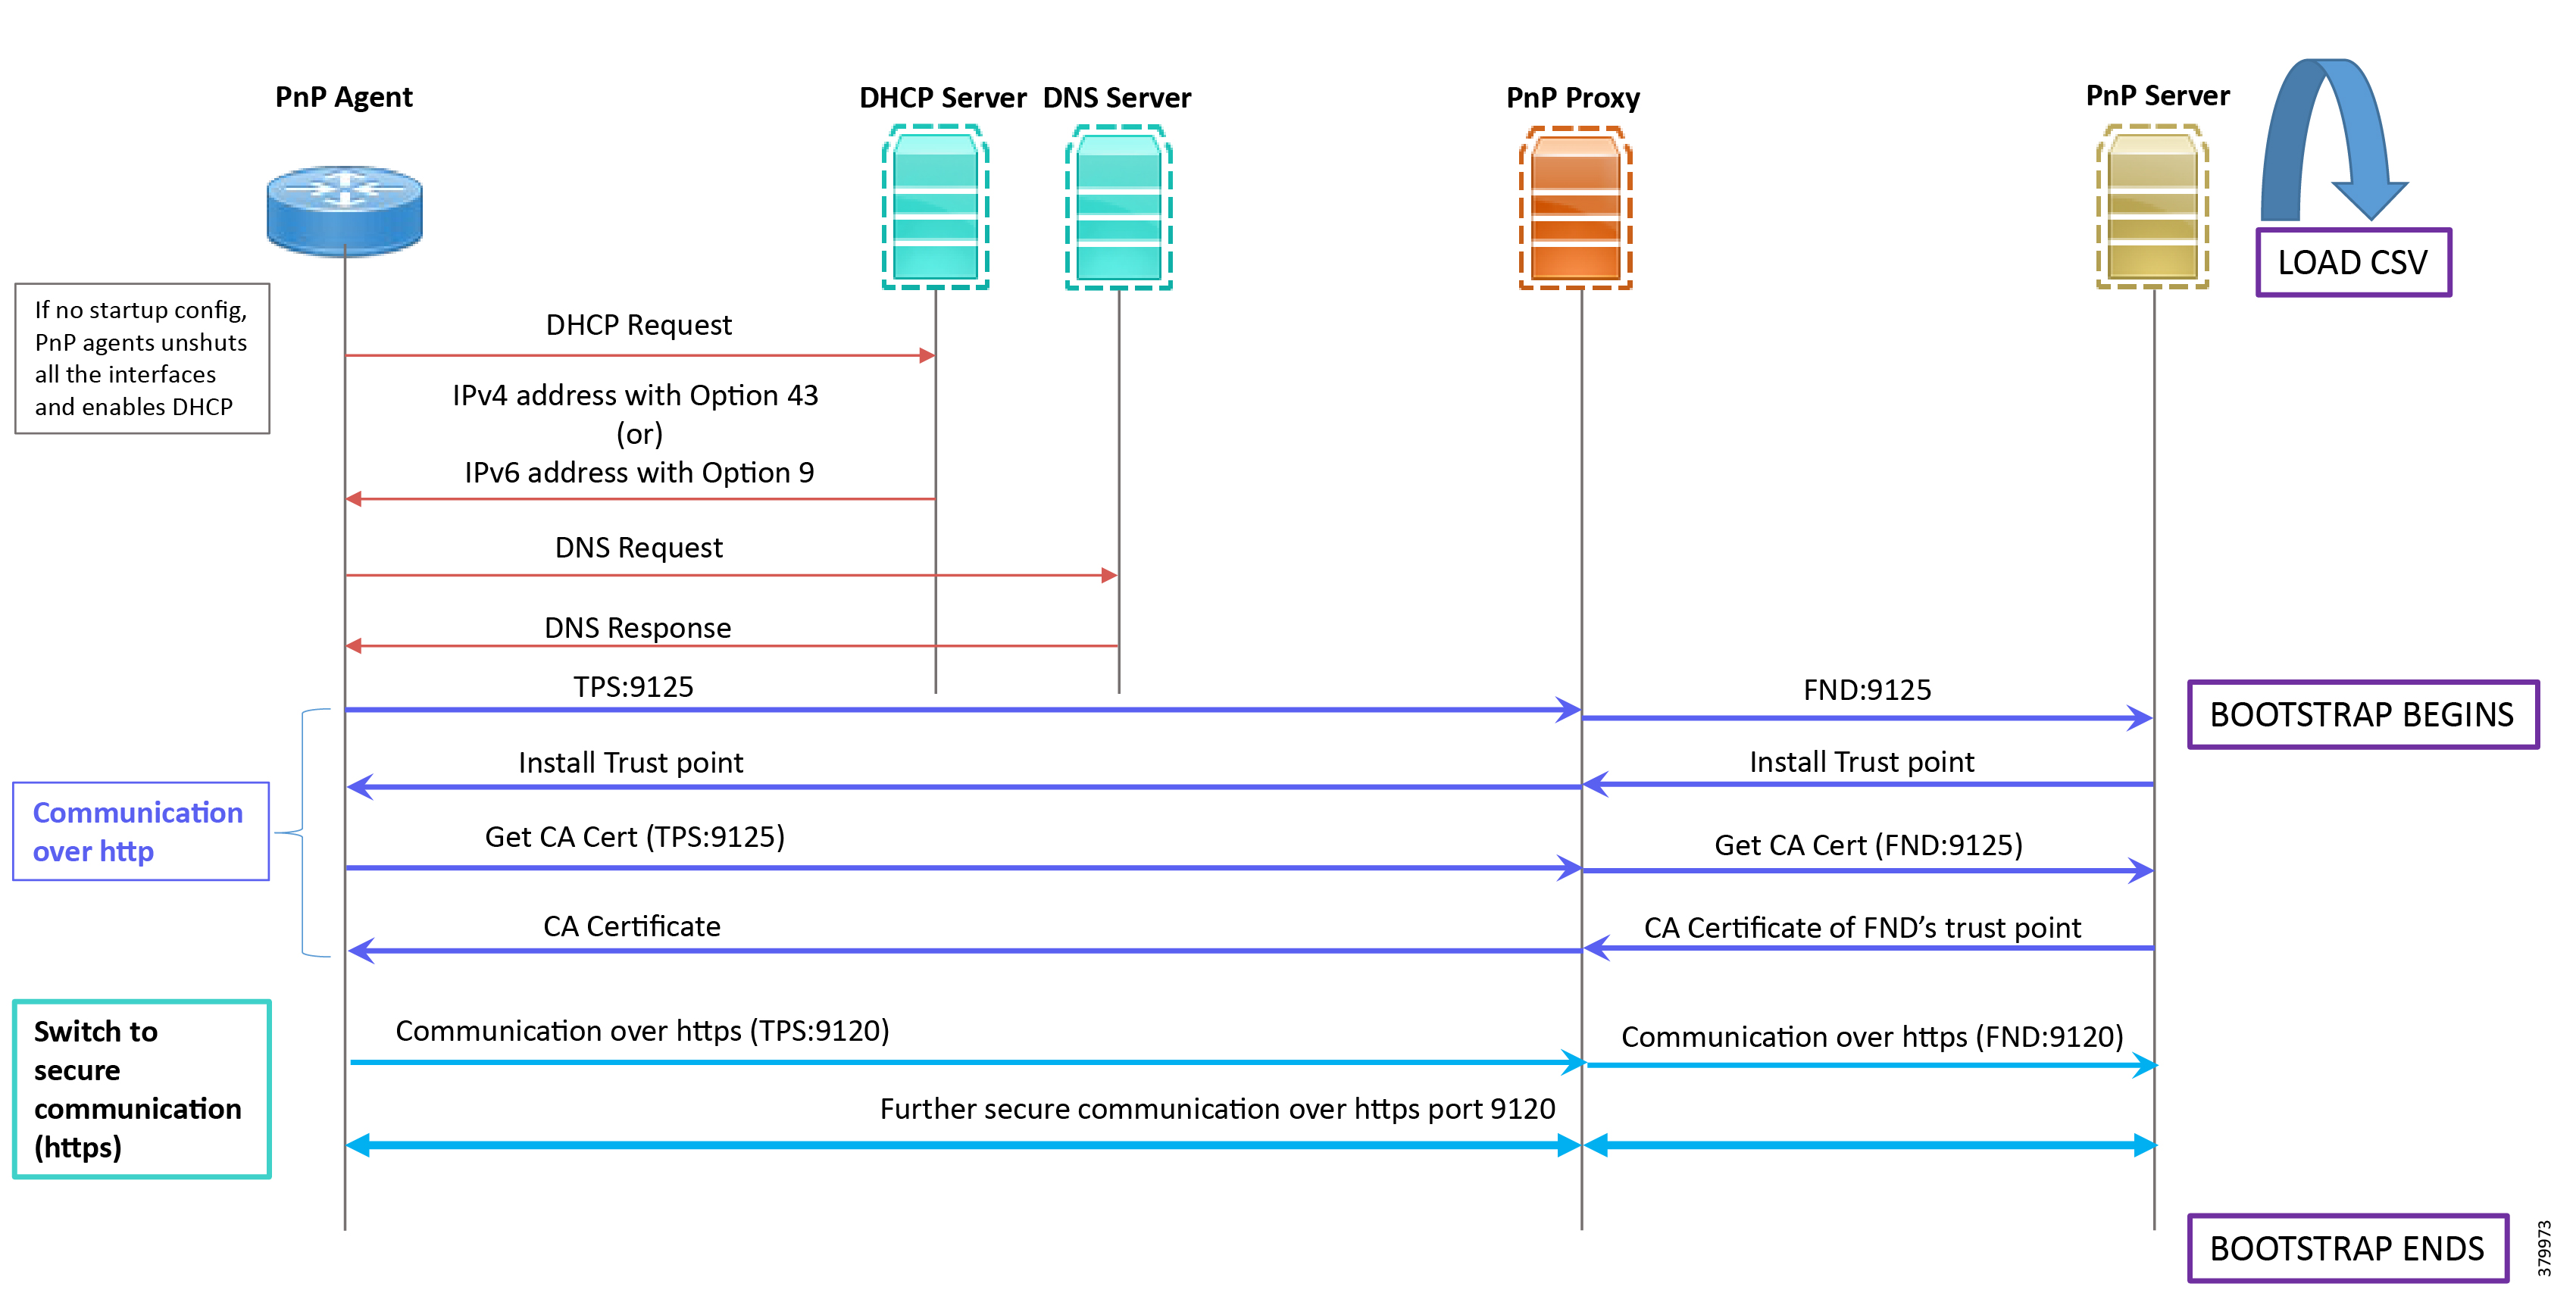
1.![]() When the IoT Gateway is powered on, the PnP Agent on the IoT Gateway checks for the presence of the startup configuration. If the startup configuration is not found, then the PnP agent performs “no shut” on all the interfaces and enables DHCP on all of them.
When the IoT Gateway is powered on, the PnP Agent on the IoT Gateway checks for the presence of the startup configuration. If the startup configuration is not found, then the PnP agent performs “no shut” on all the interfaces and enables DHCP on all of them.
2.![]() The IOS on the IoT Gateway sends out a DHCP request, which reaches the DHCP server (either directly or with the help of DHCP relay agent).
The IOS on the IoT Gateway sends out a DHCP request, which reaches the DHCP server (either directly or with the help of DHCP relay agent).
3.![]() The DHCP server responds back with the IPv4 address along with option 43, or the IPv6 address along with option 9. The option contains the FQDN of the PnP server to talk to (for example, tps-san.ipg.cisco.com) and the port number (for example, 9125) on which the PnP Proxy/Server is expected to be listening. The PnP server detail advertised as part of the DHCP option is the IP address of the PnP Proxy instead of the actual PnP server (with TPS deployed as part of the solution).
The DHCP server responds back with the IPv4 address along with option 43, or the IPv6 address along with option 9. The option contains the FQDN of the PnP server to talk to (for example, tps-san.ipg.cisco.com) and the port number (for example, 9125) on which the PnP Proxy/Server is expected to be listening. The PnP server detail advertised as part of the DHCP option is the IP address of the PnP Proxy instead of the actual PnP server (with TPS deployed as part of the solution).
4.![]() The IoT Gateway then sends out a name resolution request to DNS server to resolve the FQDN to its corresponding IPv4/IPv6 address.
The IoT Gateway then sends out a name resolution request to DNS server to resolve the FQDN to its corresponding IPv4/IPv6 address.
5.![]() The PnP Agent attempts its communication with the PnP Proxy over port 9125 (over http). PnP Proxy, in turn, communicates with the FND on port 9125. Bootstrapping begins at the FND from this point. The prerequisite to processing this bootstrapping request from the IoT Gateway is the addition of IoT Gateway details into the FND with the loading of the csv file, and placing the IoT gateway under the respective “Tunnel Group” on FND (which contains the bootstrapping template under the Router Bootstrap Configuration tab).
The PnP Agent attempts its communication with the PnP Proxy over port 9125 (over http). PnP Proxy, in turn, communicates with the FND on port 9125. Bootstrapping begins at the FND from this point. The prerequisite to processing this bootstrapping request from the IoT Gateway is the addition of IoT Gateway details into the FND with the loading of the csv file, and placing the IoT gateway under the respective “Tunnel Group” on FND (which contains the bootstrapping template under the Router Bootstrap Configuration tab).
6.![]() The FND installs the trust point on the IoT Gateway.
The FND installs the trust point on the IoT Gateway.
7.![]() The IoT Gateway sends out a Get CA Certificate request to PnP Proxy, which, in turn, proxies the communication to the FND. The FND would respond back with the CA certificate of the FND's trust point, which would then be installed on the IoT Gateway.
The IoT Gateway sends out a Get CA Certificate request to PnP Proxy, which, in turn, proxies the communication to the FND. The FND would respond back with the CA certificate of the FND's trust point, which would then be installed on the IoT Gateway.
The following PnP States would have transitioned at the FND:
8.![]() From this point onwards, the further communication switches over to https on port 9120. The IoT Gateway would communicate with the TPS IP on port 9120, which, in turn, is sent to the FND IP on port 9120. The rest of the IoT Gateway bootstrapping happens over this secure https communication established on port 9120.
From this point onwards, the further communication switches over to https on port 9120. The IoT Gateway would communicate with the TPS IP on port 9120, which, in turn, is sent to the FND IP on port 9120. The rest of the IoT Gateway bootstrapping happens over this secure https communication established on port 9120.
Note: Since the communication is over https, time synchronization and certificate parameters matching must be addressed:
–![]() For example, if https://<TPS_FQDN>:9120 is attempted, then the certificate installed on the TPS must have CN/SAN configured with <TPS_FQDN>.
For example, if https://<TPS_FQDN>:9120 is attempted, then the certificate installed on the TPS must have CN/SAN configured with <TPS_FQDN>.
–![]() Similarly, if the https://<TPS_IP>:9120 is attempted, then the certificate installed on the TPS must also have CN/SAN configured with <TPS_IP>. Otherwise, SSL failure might occur and the https message from IoT Gateway might not reach the TPS Proxy Application on port 9120.
Similarly, if the https://<TPS_IP>:9120 is attempted, then the certificate installed on the TPS must also have CN/SAN configured with <TPS_IP>. Otherwise, SSL failure might occur and the https message from IoT Gateway might not reach the TPS Proxy Application on port 9120.
FND would transition through the following PnP states while the bootstrapping progresses:
–![]() PUSHING_BOOTSTRAP_CONFIG_FILE
PUSHING_BOOTSTRAP_CONFIG_FILE
–![]() PUSHING_BOOTSTRAP_CONFIG_VERIFY_HASH
PUSHING_BOOTSTRAP_CONFIG_VERIFY_HASH
9.![]() Bootstrapping would be complete with the “BOOTSTRAP_DONE” PnP State.
Bootstrapping would be complete with the “BOOTSTRAP_DONE” PnP State.
PnP Server Definition through Manual PnP Profile and Bootstrapping
This section is discussed in the following phases:
■![]() Bootstrapping over IPv4 Network
Bootstrapping over IPv4 Network
■![]() Bootstrapping over IPv6 Network
Bootstrapping over IPv6 Network
As a gateway of last resort, if dynamic ways of learning the PnP Server are not an option, an option does exist to enable learning about the PnP server with minimal manual configuration.
Manual PnP profile configuration with PnP server details:
Note: Only the PnP Server detail is manually configured. Bootstrapping and Deployment (the rest of ZTD) still happens dynamically.
Prerequisites
■![]() The PnP server must be reachable either over the LAN or over the WAN/Internet.
The PnP server must be reachable either over the LAN or over the WAN/Internet.
■![]() As TPS is used in this implementation, TPS acts as a PnP server for the IoT Gateways.
As TPS is used in this implementation, TPS acts as a PnP server for the IoT Gateways.
Bootstrapping over IPv4 Network
This section focuses on the bootstrapping of the IoT Gateways over the IPv4 network in the absence of the DHCP server, DNS server, and Cisco Cloud redirector server to provide the PnP server details. IoT Gateways are informed about the PnP server detail directly through the Cisco IOS configuration commands.
In Figure 12, the manual PnP profile configuration on the IoT Gateways lets the IoT Gateways learn about the PnP server that should be reached out to and the desired PnP port number. For example, the custom PnP profile is configured to reach out to the PnP server ( tps-san.ipg.cisco.com) over the http on port 9125.
Figure 12 Custom PnP Profile-Assisted Bootstrapping of IoT Gateways over IPv4 Network
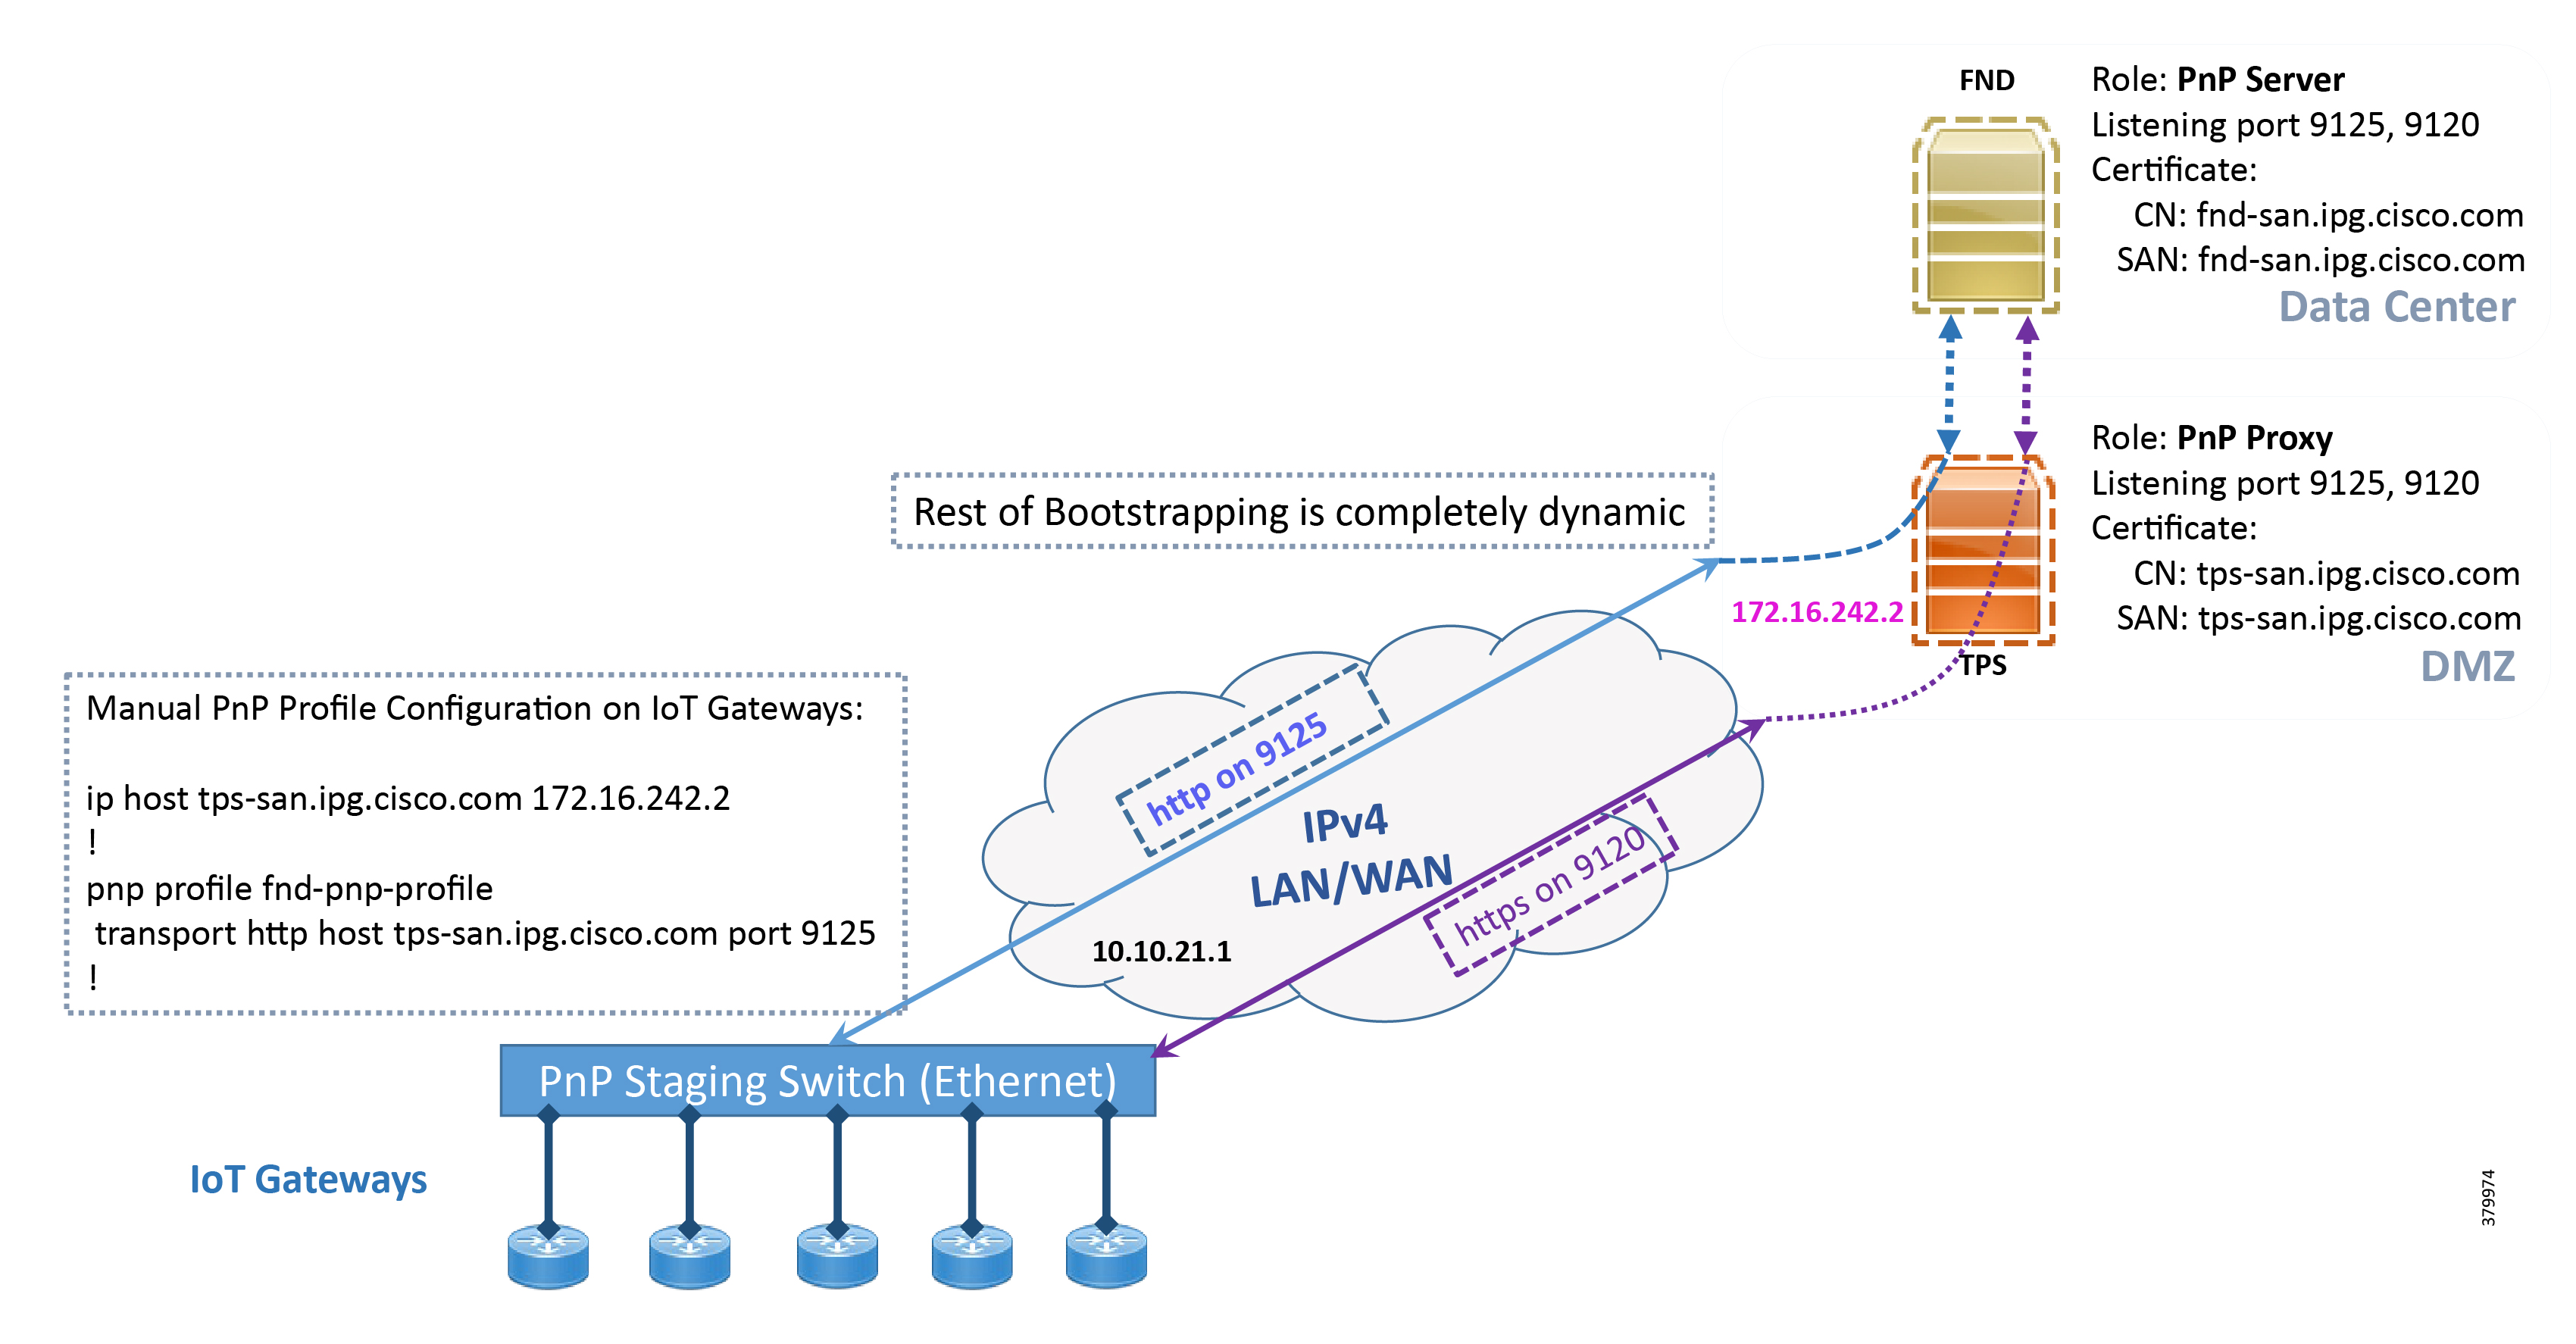
Based on the manual PnP profile configuration on the IoT Gateways, communication is initially established with PnP Proxy on http://tps-san.ipg.cisco.com:9125. Later, the communication is established with the PnP Proxy on https://tps-san.ipg.cisco.com:9120.
Note: Only the PnP server discovery is made manual. The rest of the bootstrapping procedure is the same as the DHCP server-assisted PnP provisioning discussed above.
Bootstrapping over IPv6 Network
This section focuses on the bootstrapping of the IoT Gateways over the IPv6 network in the absence of the DHCP server, DNS server, and Cisco Cloud Redirector Server to provide the PnP server details. IoT Gateways are informed about the PnP server detail directly through the Cisco IOS configuration commands in order to enable bootstrapping of the IoT Gateways over the IPv6 network.
In Figure 13, based on the manual PNP profile configuration on the IoT Gateways, initially communication is established with the PnP Proxy on http://tps-san.ipg.cisco.com:9125. Later, the communication is established with PnP Proxy on https://tps-san.ipg.cisco.com:9120.
Name resolution happens to an IPv6 address, and the bootstrapping happens over an IPv6 network.
Note: Only the PnP server discovery is made manual. The rest of the bootstrapping procedure (PnP communication on port 9120 and 9125) is still dynamic.
Figure 13 Custom PnP Profile-Assisted Bootstrapping of IoT Gateways over IPv6 Network
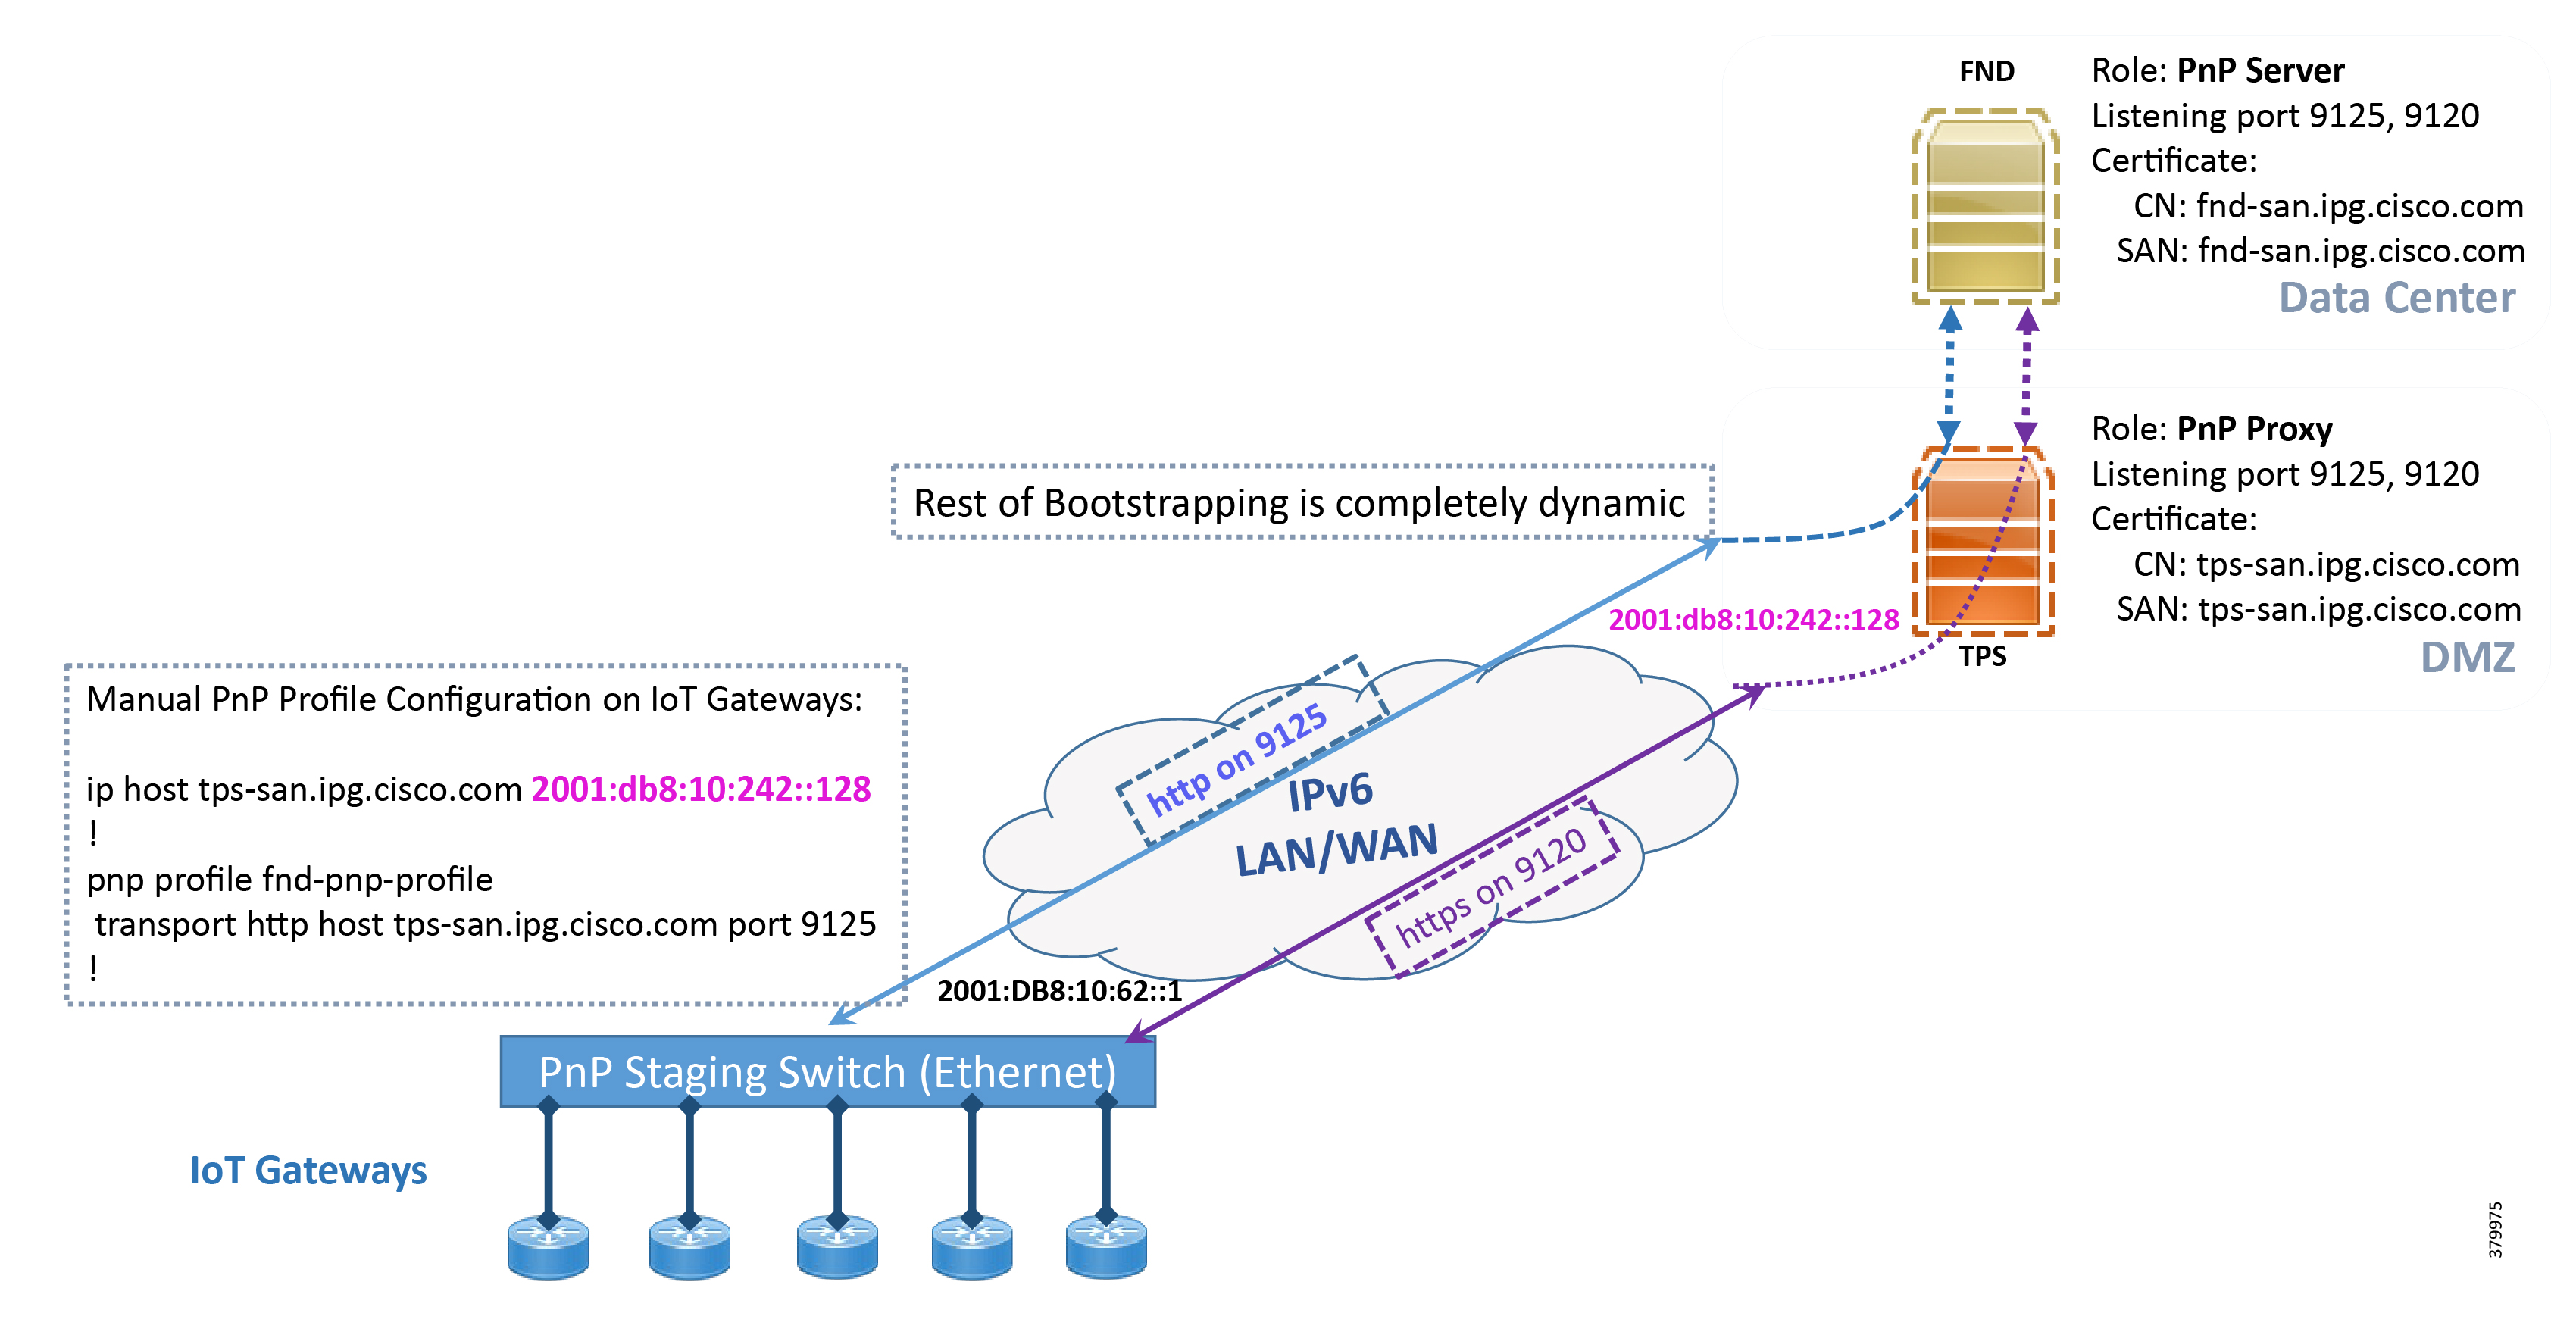
Logical Call Flow
This section discusses the logical call flow sequence with the Custom PnP profile-assisted bootstrapping of the IoT Gateways over the IPv4/IPv6 network.
Figure 14 Custom PnP Profile-Assisted Bootstrapping of IoT Gateways—Logical Call Flow
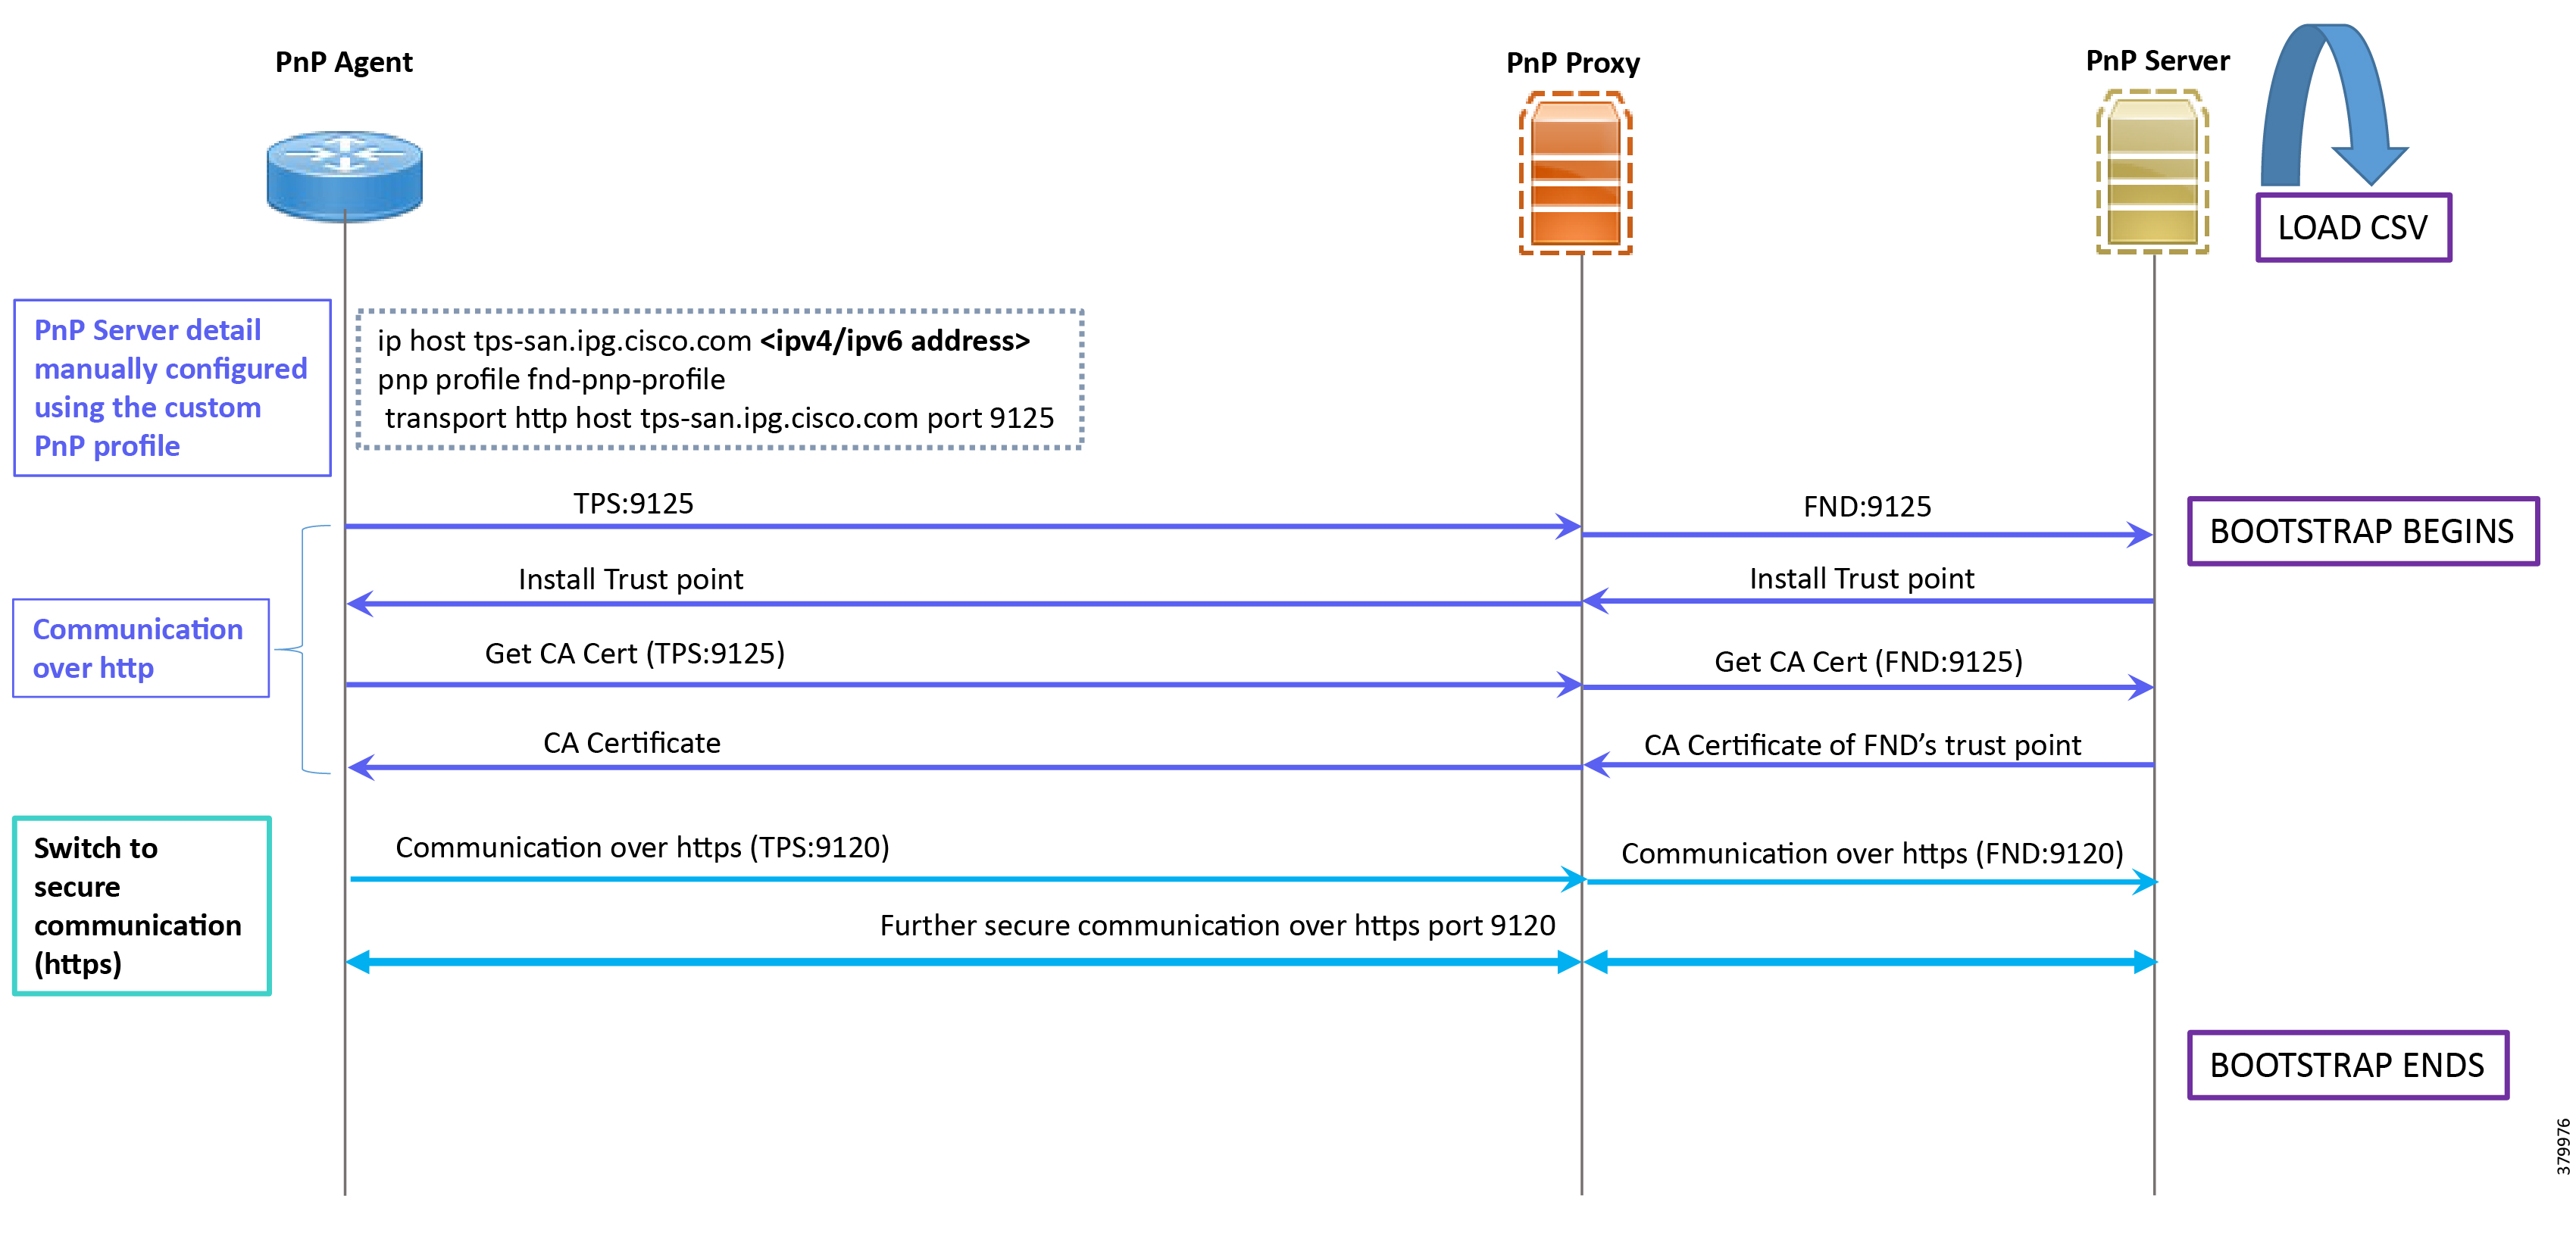
In Figure 14:
■![]() PnP server detail is learned out of the custom PnP profile, configured manually.
PnP server detail is learned out of the custom PnP profile, configured manually.
■![]() The IoT Gateway reaches out to the PnP server in the configuration, which is http://tps- san.ipg.cisco.com:9125.
The IoT Gateway reaches out to the PnP server in the configuration, which is http://tps- san.ipg.cisco.com:9125.
■![]() The communication reaches TPS, and is then sent to FND. Bootstrapping of the IoT Gateway begins at the FND.
The communication reaches TPS, and is then sent to FND. Bootstrapping of the IoT Gateway begins at the FND.
■![]() The rest of the procedure is exactly the same as the bootstrapping steps discussed as part of DHCP server-assisted PnP Provisioning:
The rest of the procedure is exactly the same as the bootstrapping steps discussed as part of DHCP server-assisted PnP Provisioning:
–![]() Initial communication happens on http://tps-san.ipg.cisco.com:9125
Initial communication happens on http://tps-san.ipg.cisco.com:9125
–![]() Later communication happens on https://tps-san.ipg.cisco.com:9120
Later communication happens on https://tps-san.ipg.cisco.com:9120
PnP Server Discovery through Cisco PnP Connect and Bootstrapping
Prerequisites
PnP Proxy must be reachable either over the WAN/Internet. As TPS is used in this implementation, TPS acts as the PnP server for the IoT Gateways. The controller profile on “software.cisco.com” should be configured with the correct TPS address. The controller profile advertises TPS details in place of the PnP server details.
To create the controller profile, login to software.cisco.com. Go to Network Plug and Play > Select controller profile from the tool bar and add the details.
Figure 15 shows the controller profile added on software.cisco.com :

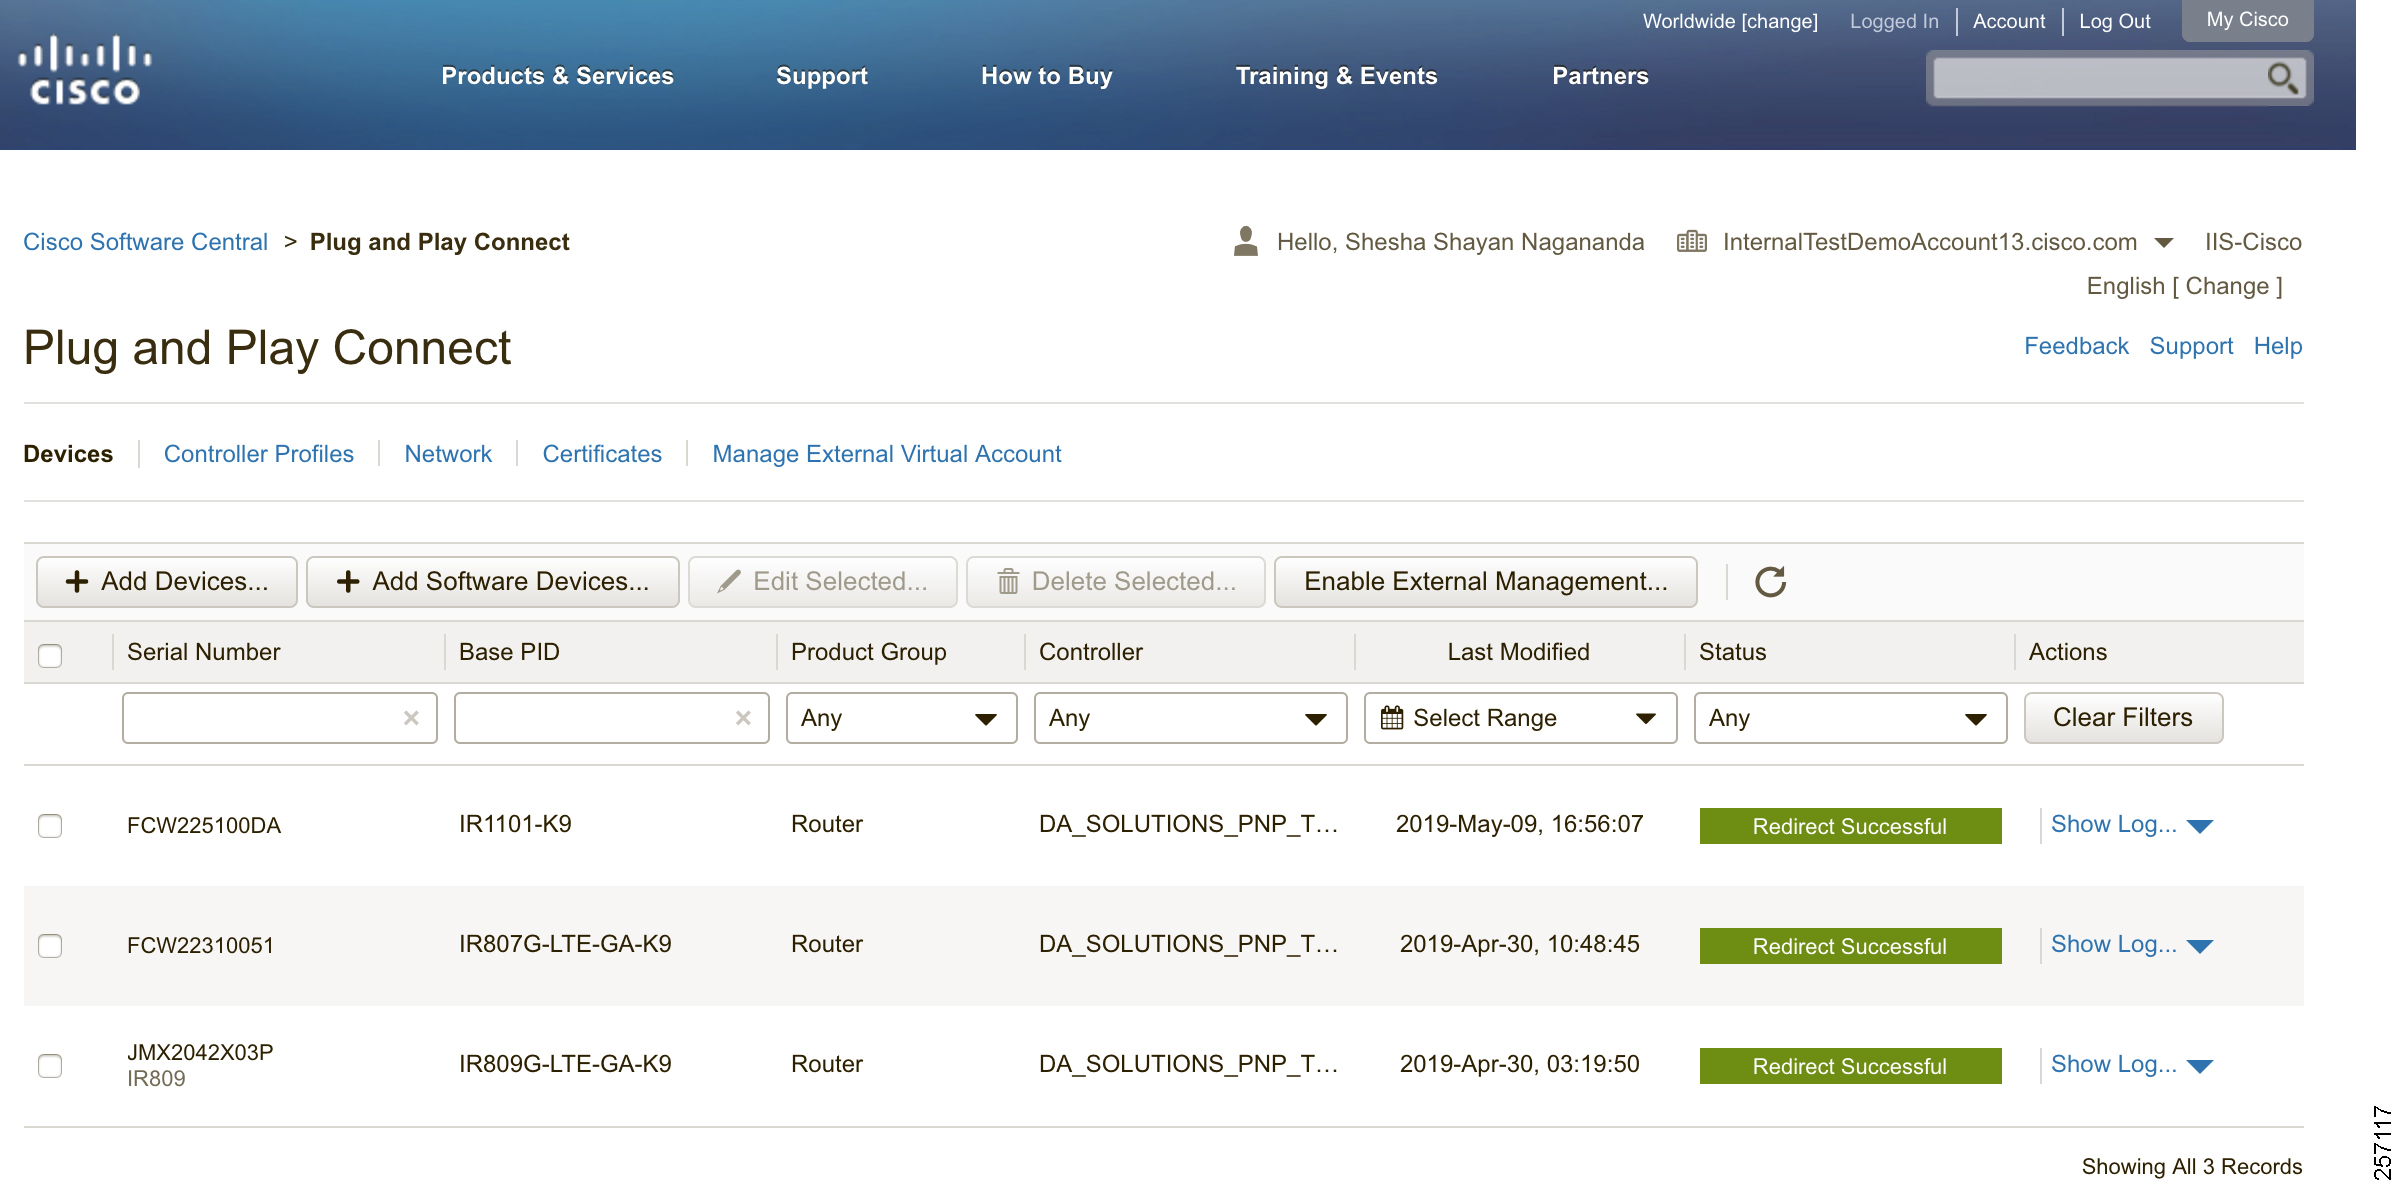
When a device is ordered through CCW, the device must be attached with the Smart account. For the PnP discovery to be successful using PnP Connect, a device must be added on the software.cisco.com portal. The device can be added either manually or by uploading a csv file. You can refer to “PnP Server Discovery Through Cisco PnP Connect” in the Cisco Distribution Automation Secondary Substation Design Guide. Figure 16 shows adding a device manually:
Figure 16 Manual Addition of Device
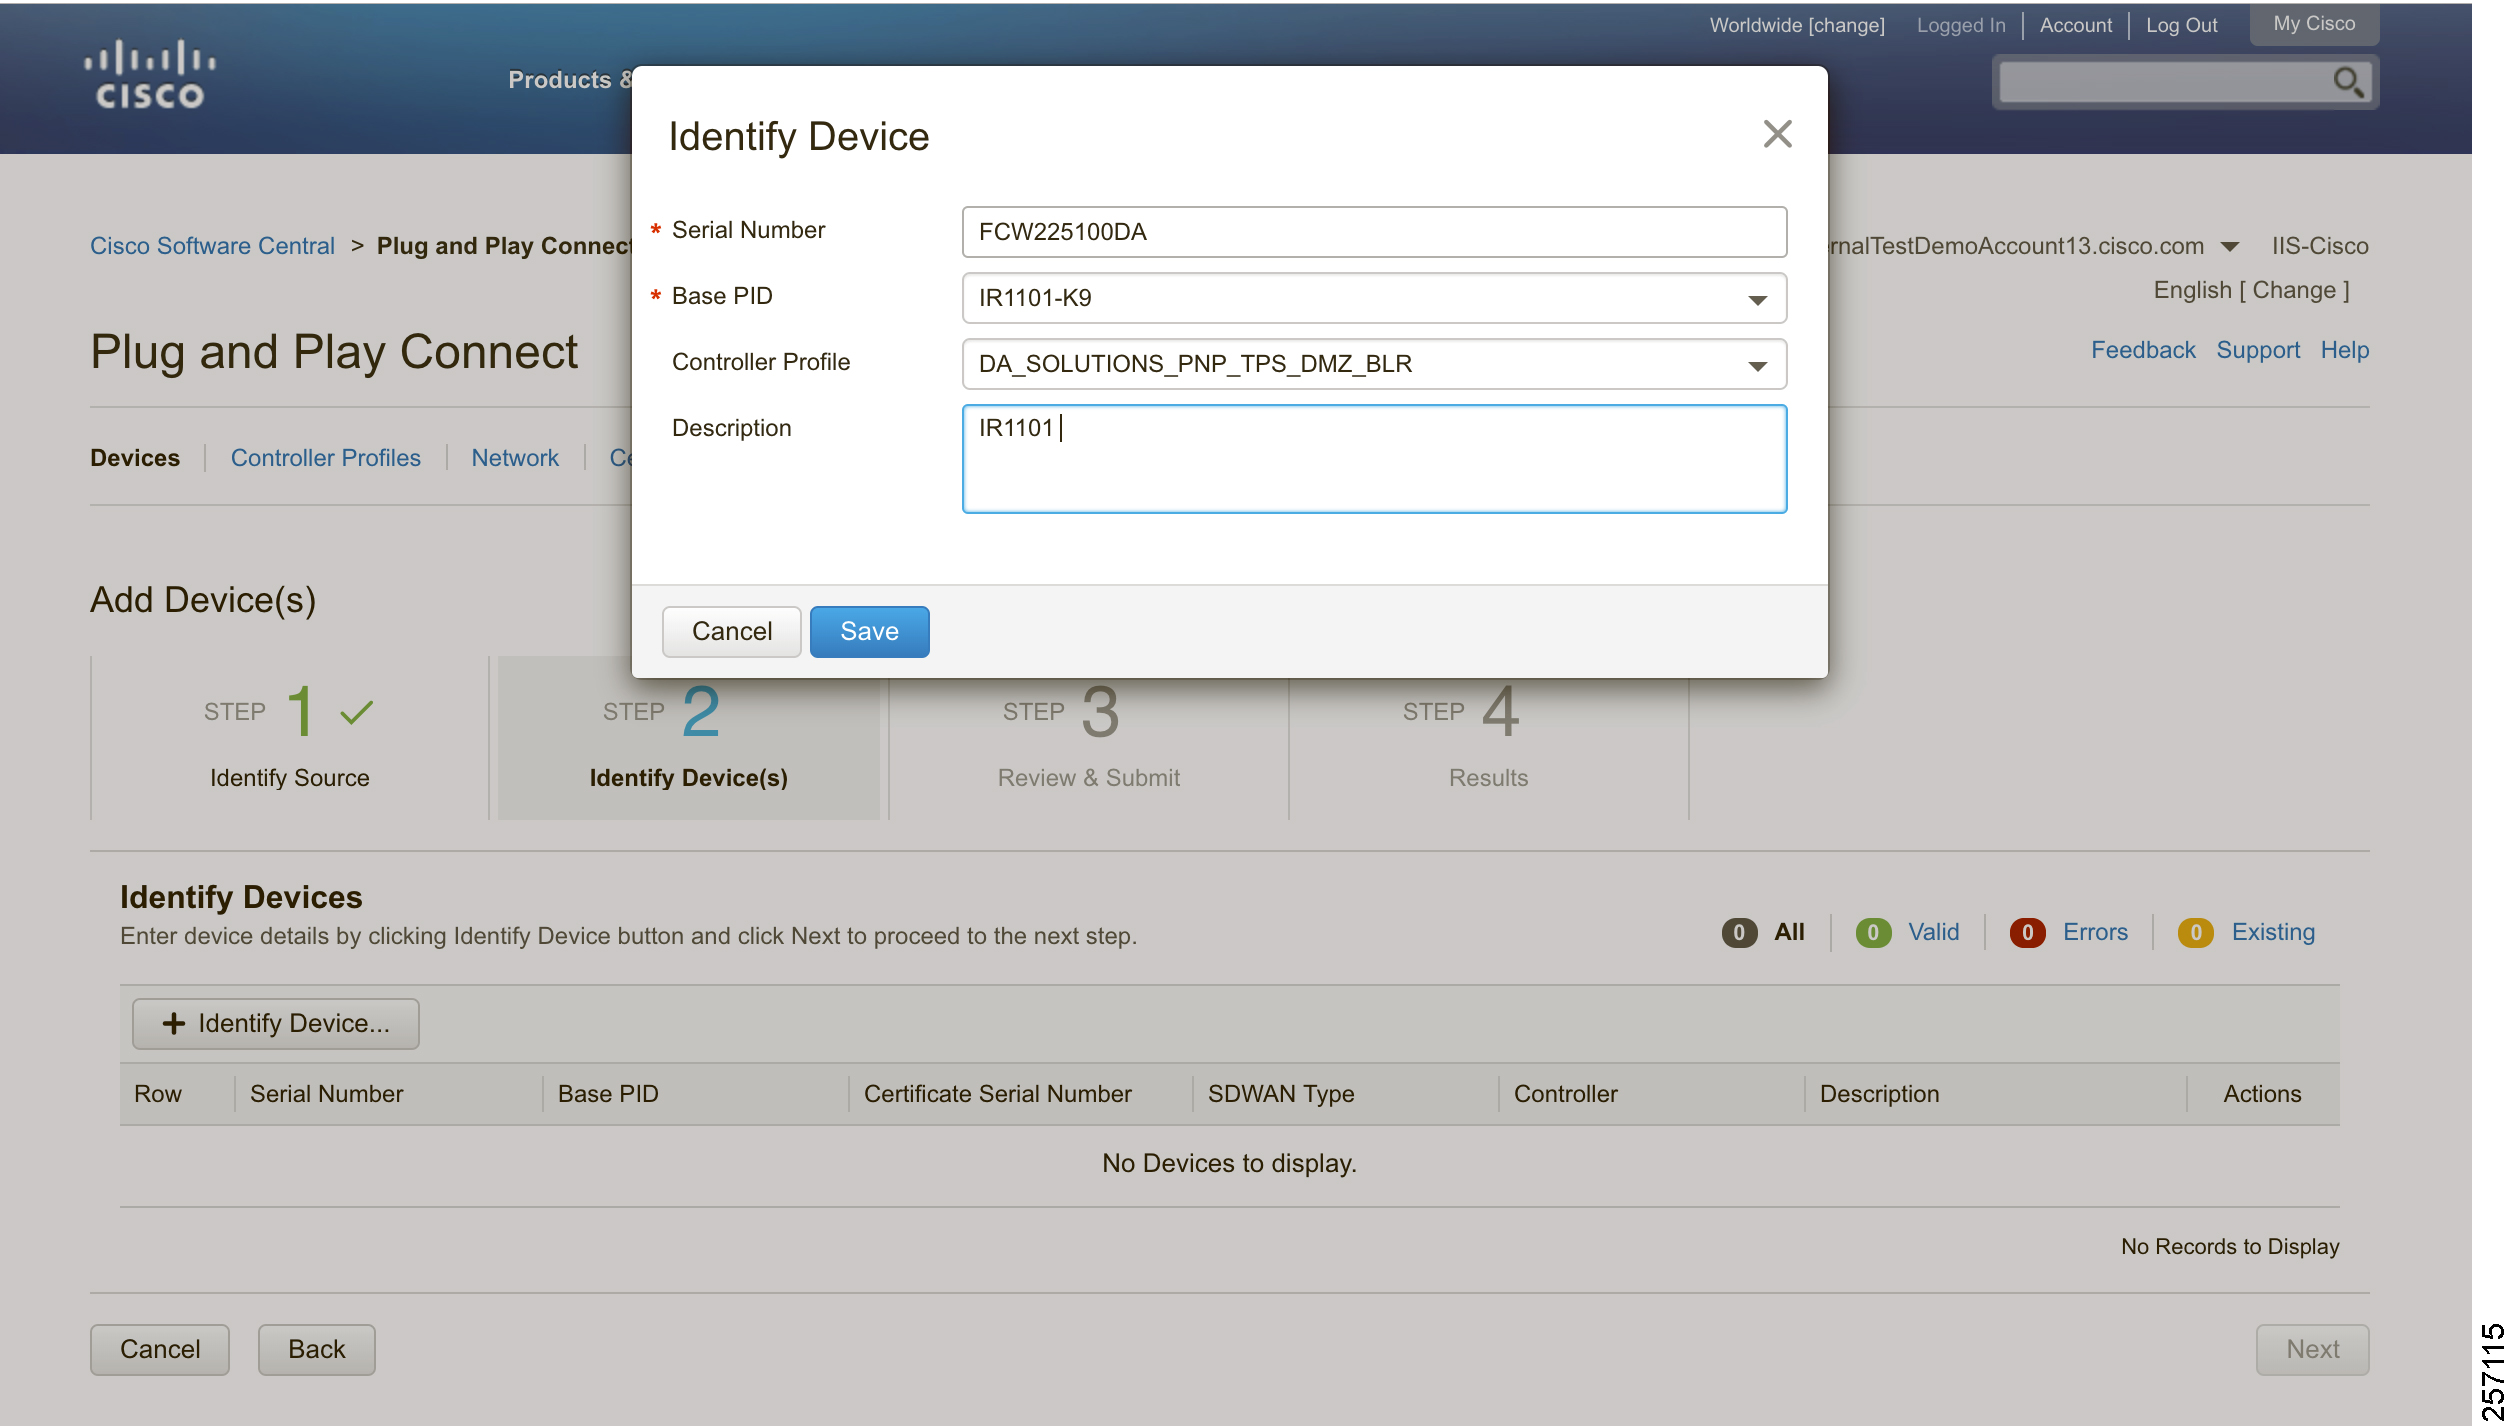
After manually adding the device in the PnP Connect portal, the request is yet to received from the device and the status for PnP redirection will be pending. This is shown in Figure 17:
Figure 17 PnP Redirect Pending after Manual Device Addition
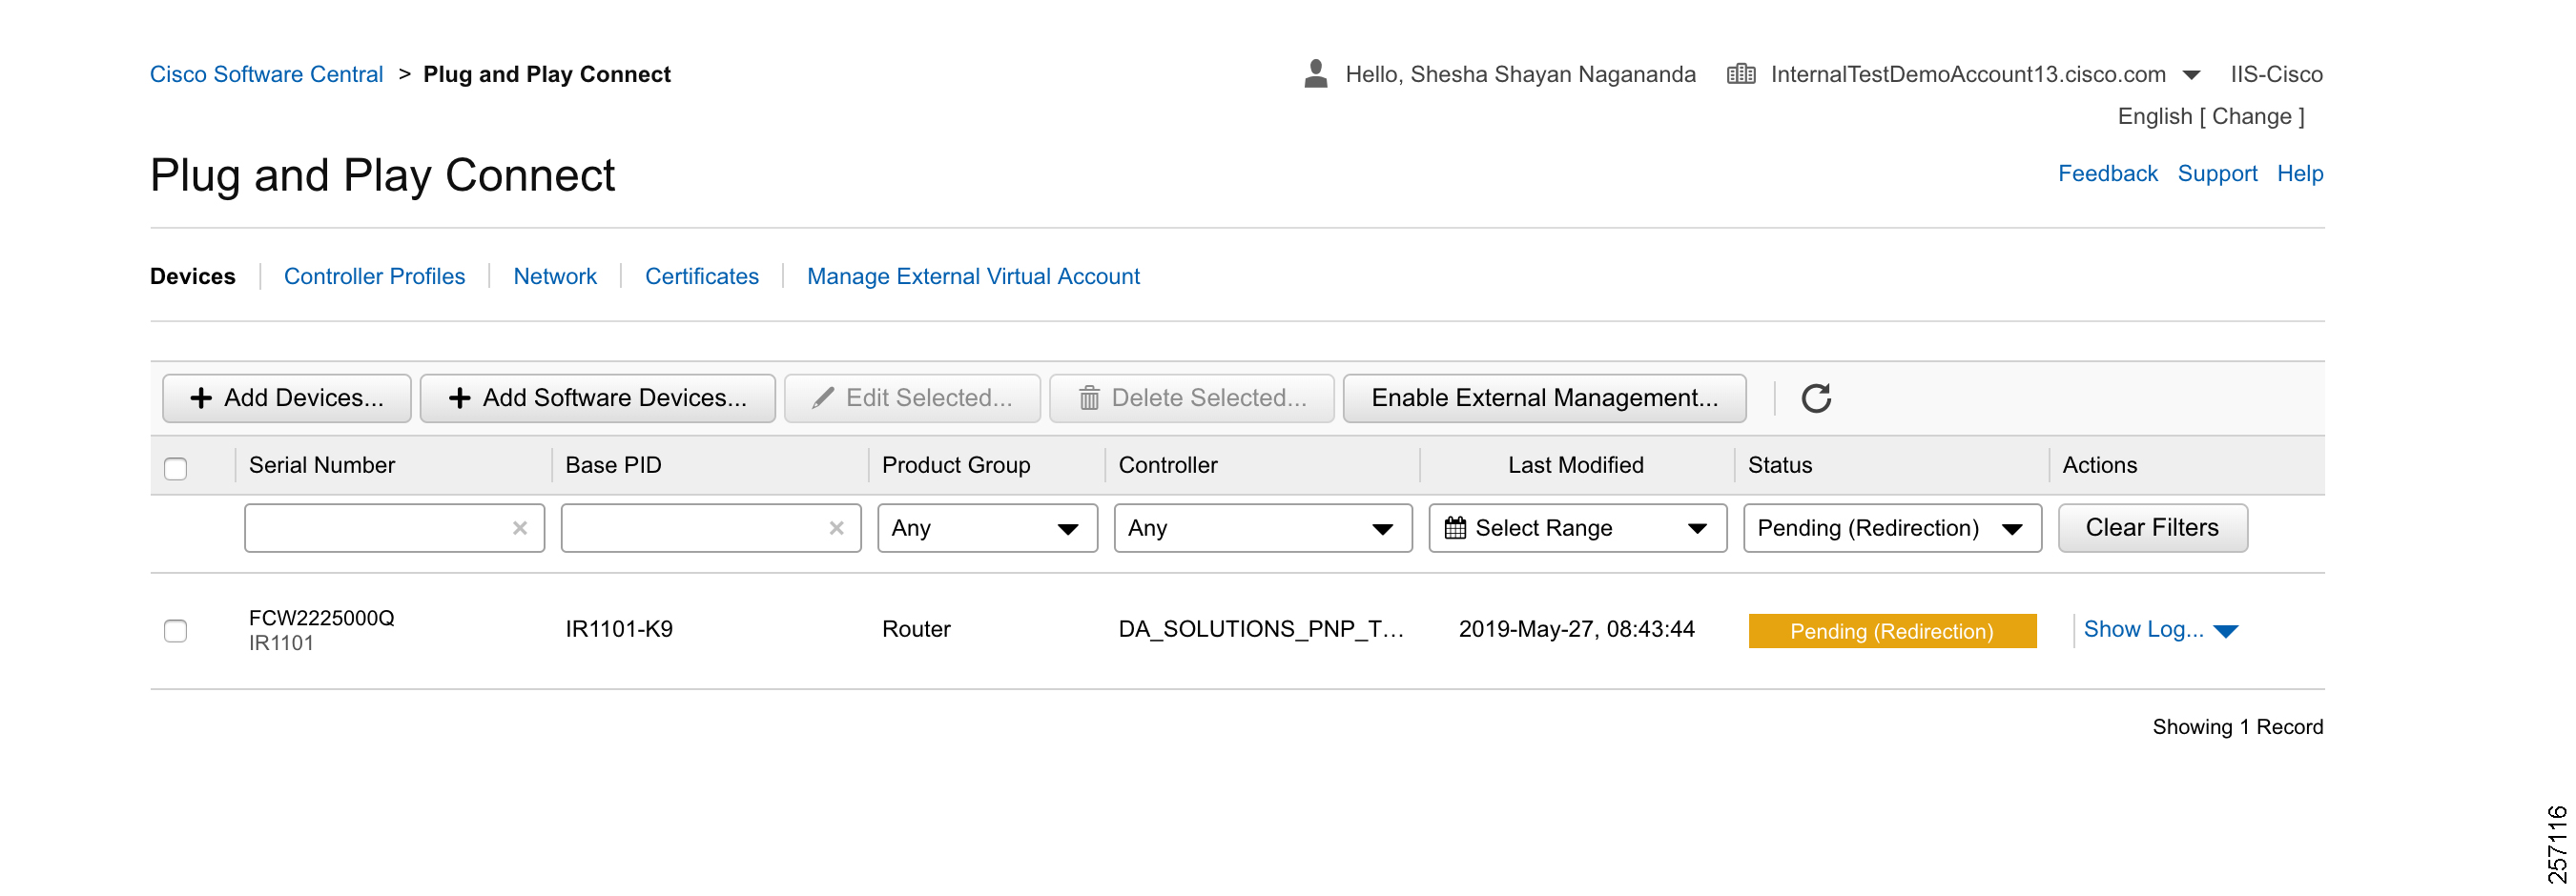
Finally, when the device is added successfully, it should be populated in the devices list as shown in Figure 17, which lists the devices for when the Redirect was successful.
Bootstrapping
This section discusses the PnP Connect-Assisted bootstrapping of the IoT Gateways over the IPv4 network.
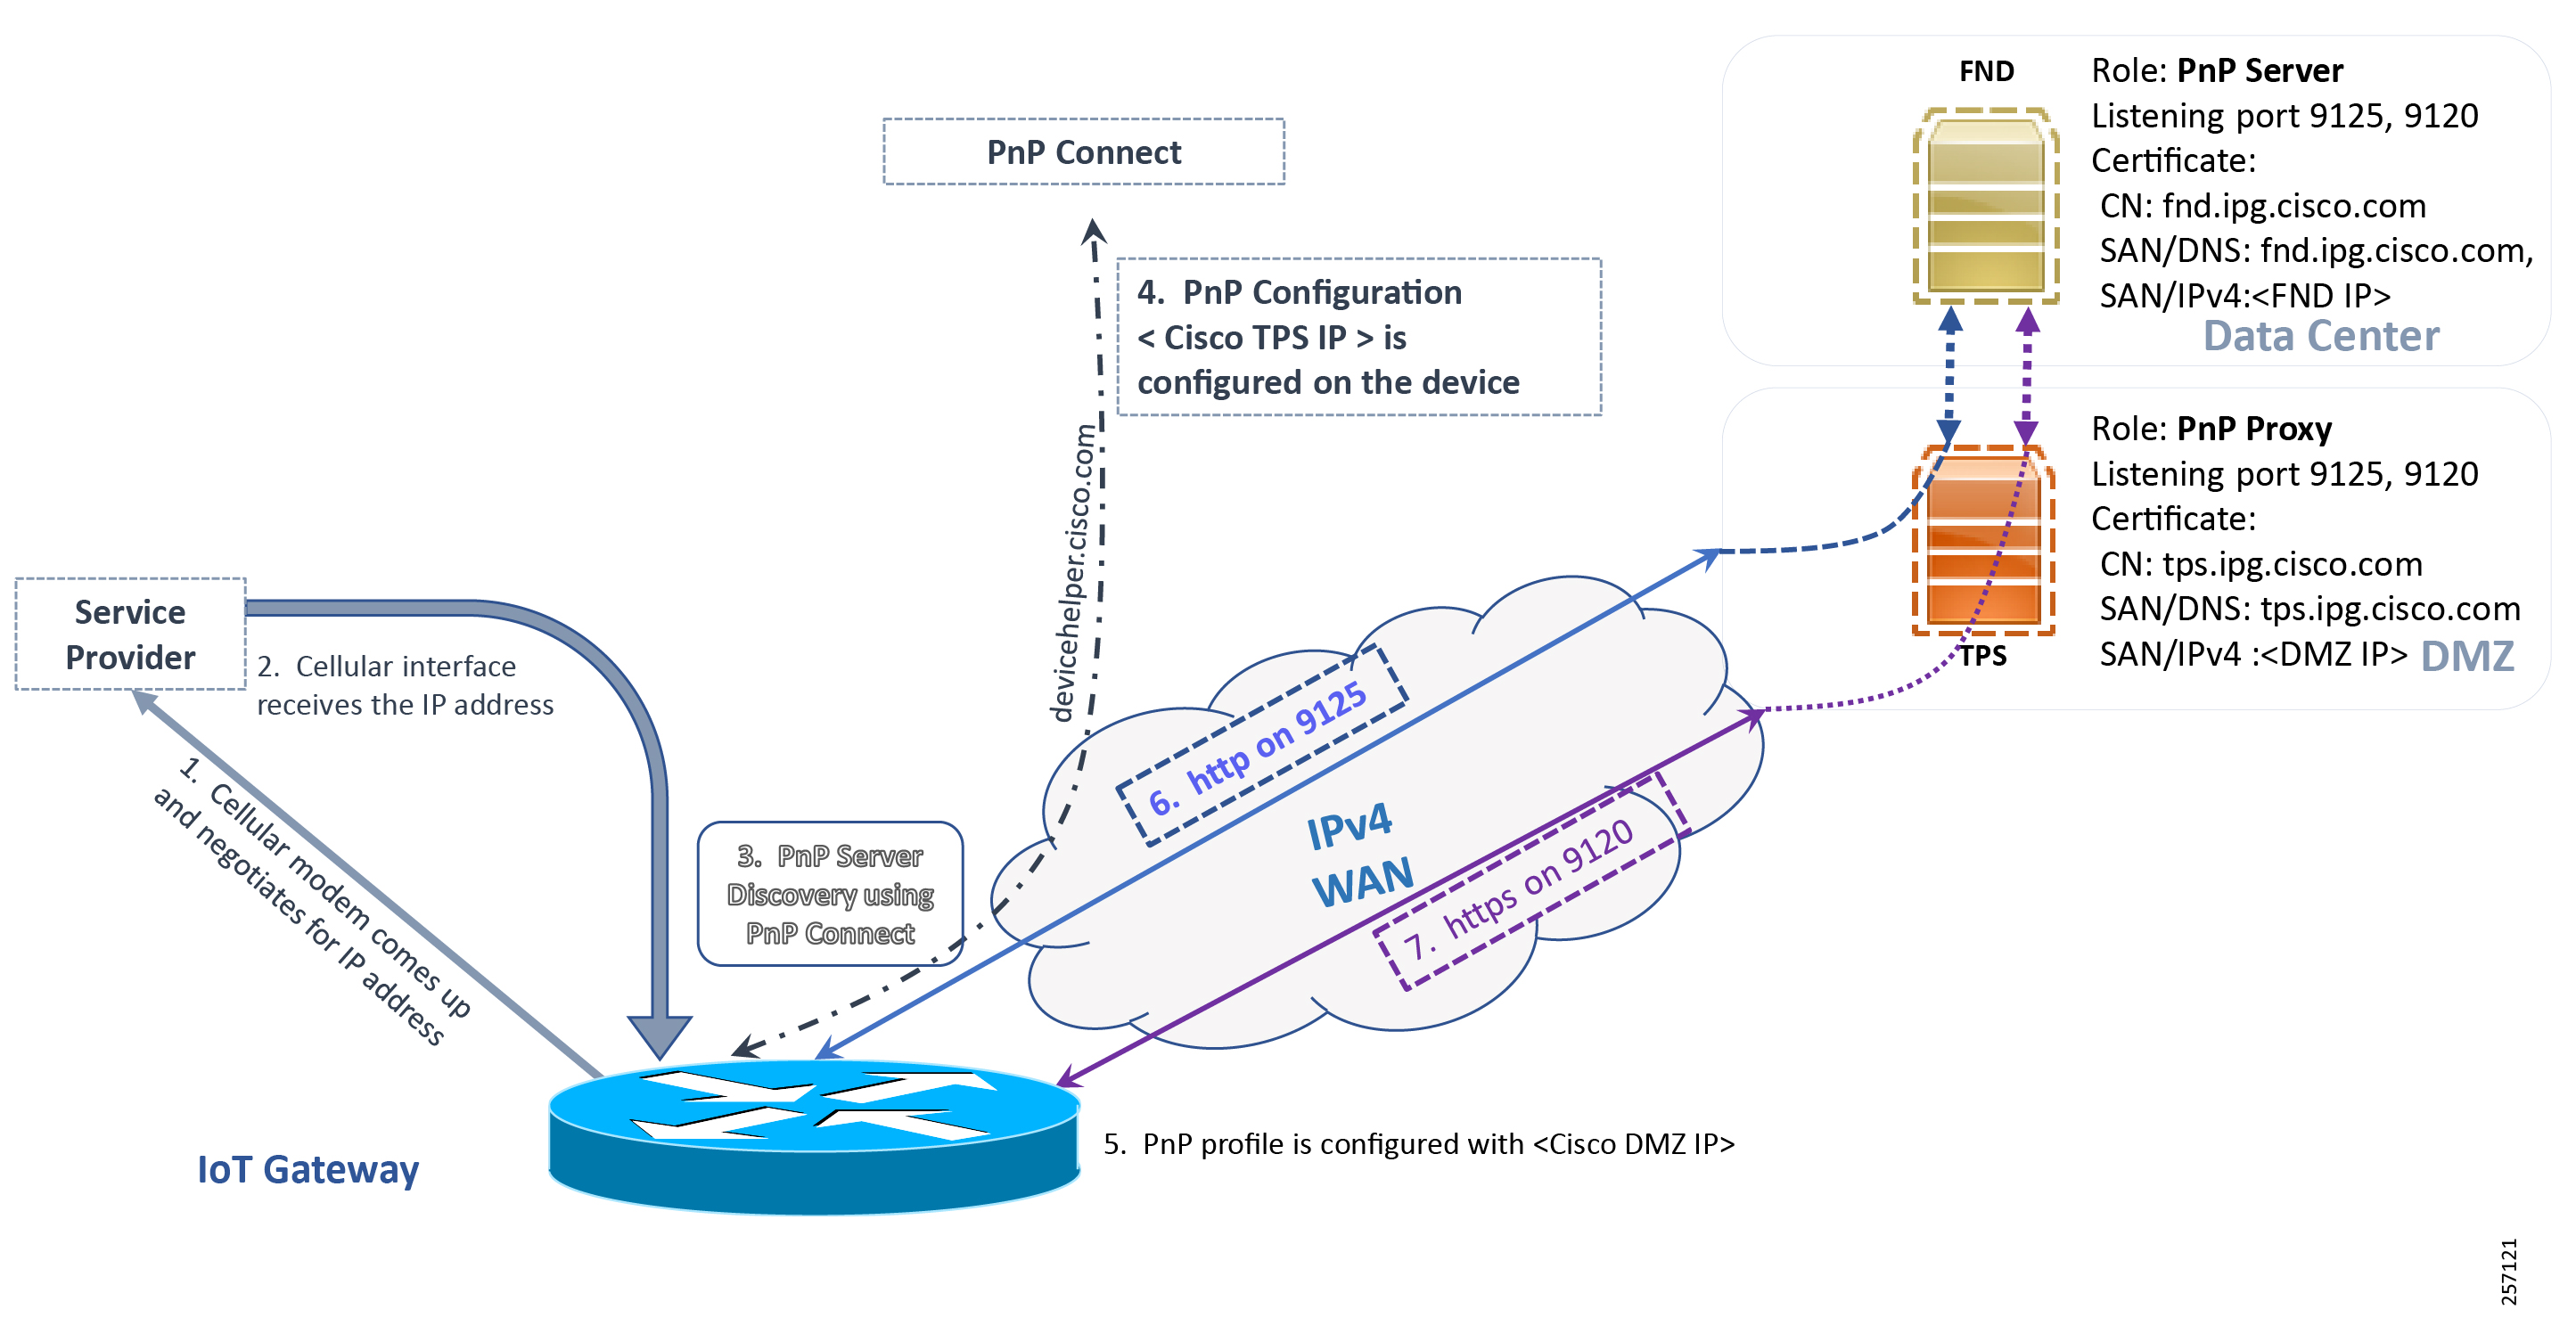
In Figure 18, IoT Gateways obtain the IP address dynamically from the service provider:
■![]() The PnP agent (residing on the IoT Gateway) then reaches out to PnP Proxy over IPv4 LAN/WAN network over http on port 9125 and then over https on port 9120.
The PnP agent (residing on the IoT Gateway) then reaches out to PnP Proxy over IPv4 LAN/WAN network over http on port 9125 and then over https on port 9120.
Figure 18 PnP Connect—Assisted Bootstrapping of IoT Gateways
Logical Call Flow
This section discusses the logical call flow sequence with the DHCP server-assisted bootstrapping of the IoT Gateways over the IPv4/IPv6 network.
The actors shown in Figure 19 are the following:
■![]() PnP Cloud Re-direction Service PnP Connect Portal
PnP Cloud Re-direction Service PnP Connect Portal
Figure 19 PnP Connect—Assisted Bootstrapping of IoT Gateways—Logical Call Flow
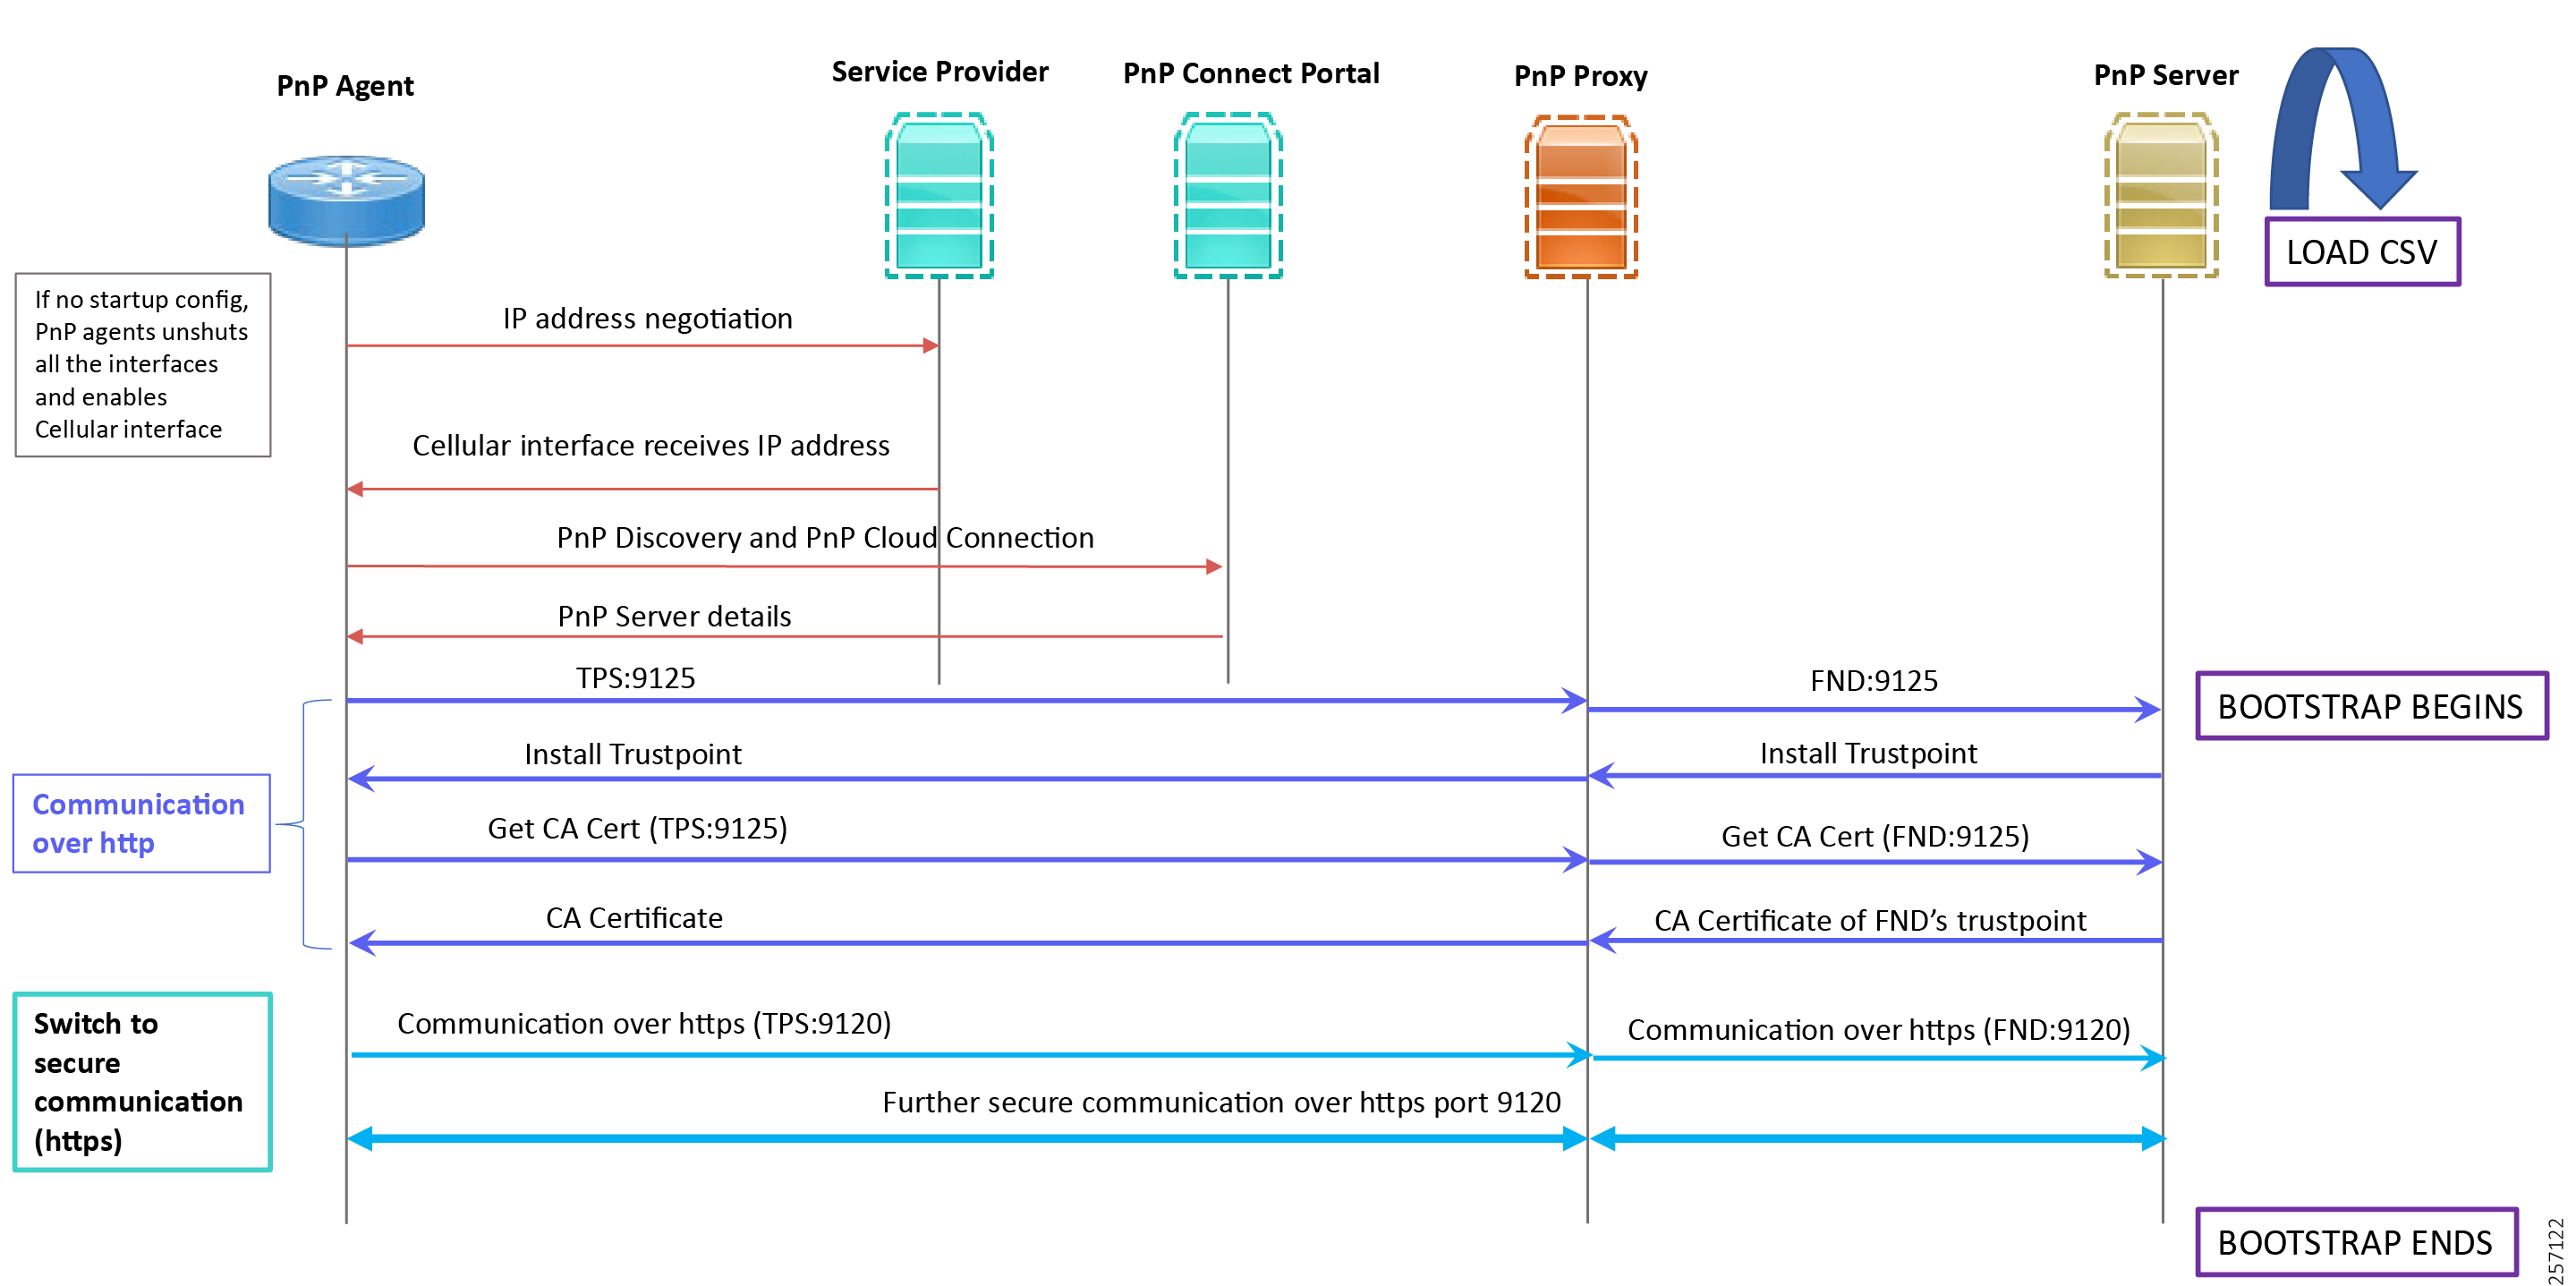
1.![]() When the IoT Gateway is powered on, the PnP Agent on the IoT Gateway checks for the presence of the startup configuration. If the startup configuration is not found, then the PnP agent performs “no shut” on all the cellular interfaces.
When the IoT Gateway is powered on, the PnP Agent on the IoT Gateway checks for the presence of the startup configuration. If the startup configuration is not found, then the PnP agent performs “no shut” on all the cellular interfaces.
2.![]() The IOS on the IoT Gateway sends out a request to the service provider.
The IOS on the IoT Gateway sends out a request to the service provider.
3.![]() The service provider responds back with the IPv4 address.
The service provider responds back with the IPv4 address.
4.![]() The IOT gateway proceeds for PnP server discovery and connects to the PnP cloud re-direction service connect portal. After successfully connecting the server devicehelper.cisco.com, the server PnP Connect portal sends the publicly reachable TPS DMZ IP(A.B.C.D) PnP proxy IP and the port number (9125) on which the proxy server is listening. The serial number of the gateway should be added to the Cisco Cloud PnP Connect portal for the re-direction service to be successful. Figure 20 shows that the PnP redirection is successful.
The IOT gateway proceeds for PnP server discovery and connects to the PnP cloud re-direction service connect portal. After successfully connecting the server devicehelper.cisco.com, the server PnP Connect portal sends the publicly reachable TPS DMZ IP(A.B.C.D) PnP proxy IP and the port number (9125) on which the proxy server is listening. The serial number of the gateway should be added to the Cisco Cloud PnP Connect portal for the re-direction service to be successful. Figure 20 shows that the PnP redirection is successful.
5.![]() Once the PnP discovery is successful, the PnP profile is configured on the device with the publicly reachable TPS DMZ IP. Once the profile is configured, the bootstrapping begins.
Once the PnP discovery is successful, the PnP profile is configured on the device with the publicly reachable TPS DMZ IP. Once the profile is configured, the bootstrapping begins.
6.![]() The rest of the procedure is exactly the same as the bootstrapping steps discussed as part of PnP server discovery through DHCP server.
The rest of the procedure is exactly the same as the bootstrapping steps discussed as part of PnP server discovery through DHCP server.
Figure 20 PnP Redirection Successful
Bootstrapping Configuration Template on Bootstrapping FND
Like the tunnel provisioning template, the bootstrapping template has to be defined on FND. This template initiates the deployment process when the gateway is deployed in the desired location.
The bootstrapping template is a configuration template residing on the bootstrapping FND. As part of the bootstrapping procedure, when the bootstrapping request is received from the IoT Gateway, this bootstrap configuration template is translated into the Cisco IOS configuration, which is then pushed onto the IoT Gateway.
In the previous section, we discussed three PnP server discovery methods. In this section, we will discuss the bootstrapping template creation for enabling the gateway to undergo the deployment process without any manual intervention.
Once this Cisco IOS configuration is pushed onto the IoT Gateway and copied onto a running configuration successfully, the bootstrapping is said to be SUCCESSFUL.
This bootstrapping of Cisco IoT Gateways from Cisco IoT FND (PnP Server) is entirely Zero Touch.
This implementation section includes the following sections:
Creation of Bootstrap Configuration Template Group
This section covers the steps required for configuring the bootstrapping group.
Figure 21 CREATE Bootstrap—CONFIG—Tunnel Provisioning

1.![]() From the CONFIG Menu, select the Tunnel Provisioning option.
From the CONFIG Menu, select the Tunnel Provisioning option.
Figure 22 CREATE Bootstrap—Add Group

2.![]() With the Router Group selected in the left pane, click the “+” sign (Add Group icon) located in the top right of the left pane.
With the Router Group selected in the left pane, click the “+” sign (Add Group icon) located in the top right of the left pane.
Figure 23 CREATE Bootstrap—Add IPv4 Group

3.![]() Configure the group name IPv4-BOOTSTRAP, and click Add.
Configure the group name IPv4-BOOTSTRAP, and click Add.
Figure 24 CREATE Bootstrap—Add IPv6 Group

4.![]() Similarly, configure another group name IPv6-BOOTSTRAP for bootstrapping over the IPv6 network. Click Add:
Similarly, configure another group name IPv6-BOOTSTRAP for bootstrapping over the IPv6 network. Click Add:
Figure 25 CREATE Bootstrap—List of Bootstrap Groups
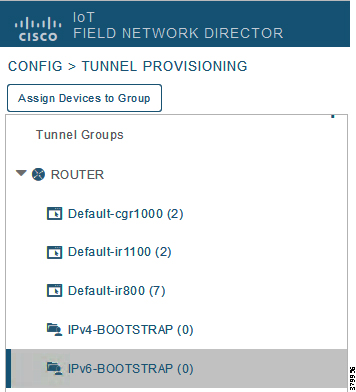
The two newly created bootstrapping groups are displayed in the left pane:
■![]() IPv4-BOOTSTRAP (created to handle bootstrapping over the IPv4 network)
IPv4-BOOTSTRAP (created to handle bootstrapping over the IPv4 network)
■![]() IPv6-BOOTSTRAP (created to handle bootstrapping over the IPv6 network)
IPv6-BOOTSTRAP (created to handle bootstrapping over the IPv6 network)
Moving Devices under the Bootstrapping Group
Multiple bootstrapping groups could be configured on the bootstrapping FND. IoT Gateways have to be moved under the correct group in order to have it bootstrapped with the appropriate configuration.
Complete the following steps to move IoT Gateways under the correct bootstrapping group:
1.![]() In Figure 26, two IoT Gateways are under the default group. The devices need to be moved to the newly created IPv4-BOOTSTRAP group. In the middle pane, select the Router in the pull-down menu, select the IoT Gateways to be moved under the new bootstrapping group, and then click Change Tunnel Group.
In Figure 26, two IoT Gateways are under the default group. The devices need to be moved to the newly created IPv4-BOOTSTRAP group. In the middle pane, select the Router in the pull-down menu, select the IoT Gateways to be moved under the new bootstrapping group, and then click Change Tunnel Group.
Figure 26 CHANGE Tunnel Group—Device Under Default Group

Figure 27 CHANGE Tunnel Group—Pull-Down Menu

2.![]() Choose the correct bootstrap group IPv4-BOOTSTRAP. To perform bootstrapping over the IPv6 network, choose the IPv6-BOOTSTRAP tunnel group.
Choose the correct bootstrap group IPv4-BOOTSTRAP. To perform bootstrapping over the IPv6 network, choose the IPv6-BOOTSTRAP tunnel group.
Figure 28 CHANGE Tunnel Group—Select IPv4 Group

3.![]() With the appropriate bootstrap group chosen, click Change Tunnel Group to move the IoT Gateway from the default group to the desired group.
With the appropriate bootstrap group chosen, click Change Tunnel Group to move the IoT Gateway from the default group to the desired group.
Figure 29 CHANGE Tunnel Group—Updated IPv4 Group
4.![]() Device migration to the desired group was successful.
Device migration to the desired group was successful.
Figure 30 CHANGE Tunnel Group—Devices Moved under IPv4 Group

5.![]() In Figure 30, it can be seen that IoT Gateways were moved under the correct bootstrapping group.
In Figure 30, it can be seen that IoT Gateways were moved under the correct bootstrapping group.
Router Bootstrap Configuration Groups—Populating Templates
This section shows where to populate the bootstrapping template in FND, and the template that needs to be chosen for bootstrapping of the IoT Gateways according to the network in which the IoT Gateway would be deployed (for example, IPv4/IPv6 network, located/not located behind NAT, etc).
Note: Working versions of bootstrapping templates can be found in Appendix A: PnP Profiles.
Figure 31 captures the Router Bootstrap Configuration section that needs to be populated for the purpose of bootstrapping:
Figure 31 Router Bootstrap Configuration
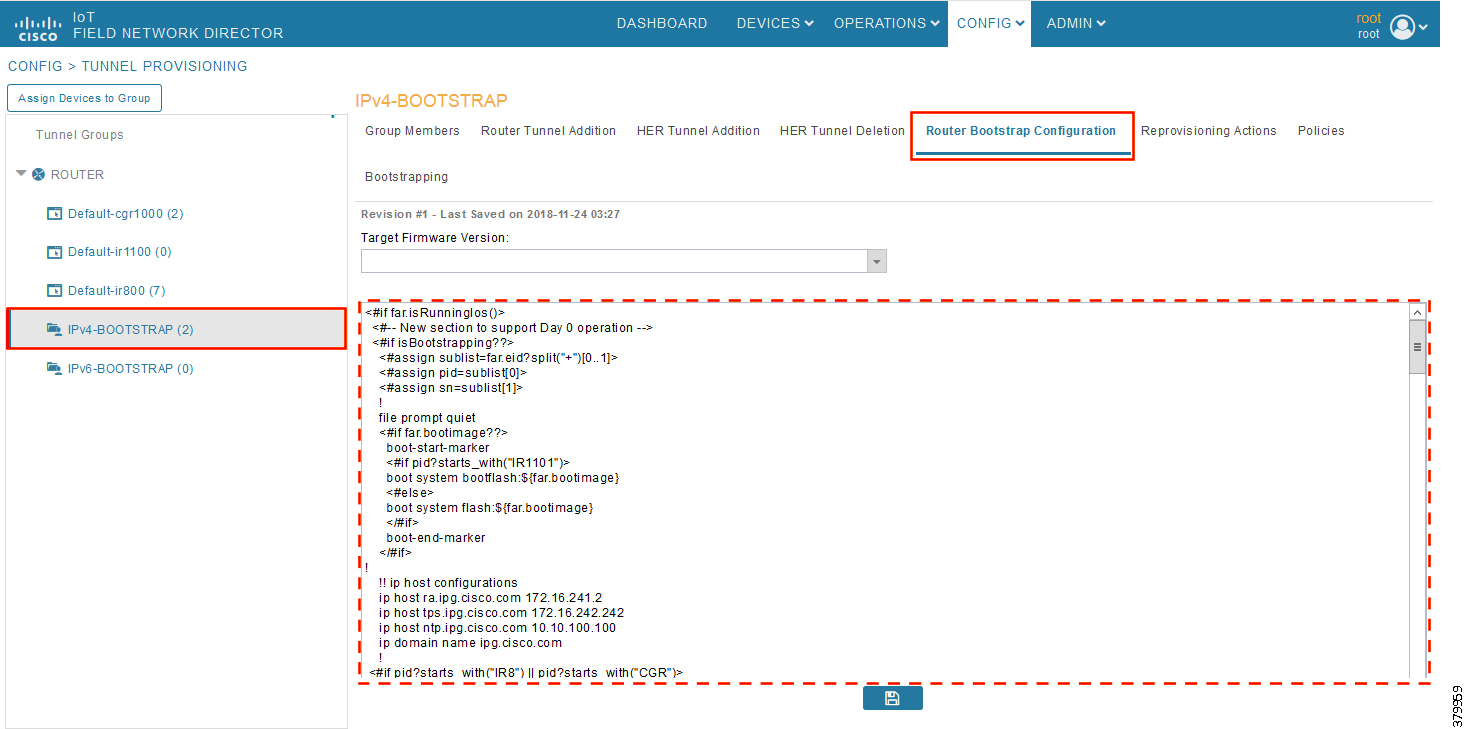
Every bootstrap group (referred as Tunnel Group in the left pane) can be populated with a unique Router Bootstrap configuration.
|
|
|
|
|---|---|---|
With reference to Table 11, for bootstrapping the IoT Gateways for deployment over the IPv4 network:
■![]() If IoT Gateways are located behind NAT, then the bootstrapping template IPv4-BOOTSTRAP-NAT could be used.
If IoT Gateways are located behind NAT, then the bootstrapping template IPv4-BOOTSTRAP-NAT could be used.
■![]() If IoT Gateways are not located behind NAT, then the bootstrapping template IPv4-BOOTSTRAP could be used.
If IoT Gateways are not located behind NAT, then the bootstrapping template IPv4-BOOTSTRAP could be used.
Similarly, for Bootstrapping the IoT Gateways for deployment over IPv6 network:
■![]() If IoT Gateways are located behind NAT, then the bootstrapping template IPv6-BOOTSTRAP-NAT could be used.
If IoT Gateways are located behind NAT, then the bootstrapping template IPv6-BOOTSTRAP-NAT could be used.
■![]() If IoT Gateways are not located behind NAT, then the bootstrapping template IPv6-BOOTSTRAP could be used.
If IoT Gateways are not located behind NAT, then the bootstrapping template IPv6-BOOTSTRAP could be used.
Deployment of the Cisco IoT Gateway
This section includes the following topics:
Prerequisites for Deployment
■![]() Cisco IoT Gateway should have gone through the bootstrapping procedure mentioned in Bootstrapping of the IoT Gateway, with the device being part of the appropriate bootstrapping group.
Cisco IoT Gateway should have gone through the bootstrapping procedure mentioned in Bootstrapping of the IoT Gateway, with the device being part of the appropriate bootstrapping group.
■![]() The CSV file should be imported for the IoT Gateways at the Control Center FND. Refer to Figure 171 available in Appendix B: FND Zero Touch Deployment Profiles, which shows the CSV file.
The CSV file should be imported for the IoT Gateways at the Control Center FND. Refer to Figure 171 available in Appendix B: FND Zero Touch Deployment Profiles, which shows the CSV file.
Deployment Infrastructure Readiness
■![]() Cisco IoT Gateway should be assigned an IPv4/IPv6 address dynamically over Ethernet/Cellular. If a static address needs to be used on the Cisco IoT Gateway, then assignment of address to the Cisco IoT Gateway's interface needs to be taken care as part of Bootstrapping.
Cisco IoT Gateway should be assigned an IPv4/IPv6 address dynamically over Ethernet/Cellular. If a static address needs to be used on the Cisco IoT Gateway, then assignment of address to the Cisco IoT Gateway's interface needs to be taken care as part of Bootstrapping.
■![]() Cisco Field Area Network—Headend (DSO Control Center1) should be UP and running:
Cisco Field Area Network—Headend (DSO Control Center1) should be UP and running:
–![]() If it needs to be set up, the Cisco FAN-Headend Deep Dive Implementation and FAN Use Cases' guide could be referenced to set up the headend in the DSO Control Center or NOC.
If it needs to be set up, the Cisco FAN-Headend Deep Dive Implementation and FAN Use Cases' guide could be referenced to set up the headend in the DSO Control Center or NOC.
■![]() All the required headend components like the CA server (RSA), AAA, AD, Registration Authority, NOC TPS/FND, DHCP server, and HERs are expected to be up and running in the DSO Control Center1.
All the required headend components like the CA server (RSA), AAA, AD, Registration Authority, NOC TPS/FND, DHCP server, and HERs are expected to be up and running in the DSO Control Center1.
■![]() NOC TPS, RA, and HERs must have static IP addresses configured and should be reachable from the Cisco IoT Gateways that are located in the secondary substation or along the Distribution network.
NOC TPS, RA, and HERs must have static IP addresses configured and should be reachable from the Cisco IoT Gateways that are located in the secondary substation or along the Distribution network.
Note: If the prerequisites for deployment are addressed, ZTD of the IoT Gateways should happen successfully after the gateway is deployed at the desired location and powered on, with the Ethernet cable connected or the LTE SIM card inserted.
Deployment over IPv4 Cellular Network with NAT
Note: This section has no implementation steps. As the name “ZTD” states, it's a zero touch deployment. As long as bootstrapping happened successfully by having the IoT Gateway part of the correct bootstrapping group, this deployment should happen successfully with no manual steps.
Figure 32 captures the deployment steps for IoT Gateway over LTE Cellular:
Figure 32 Deployment over IPv4 Cellular Network with Cisco DMZ Headend
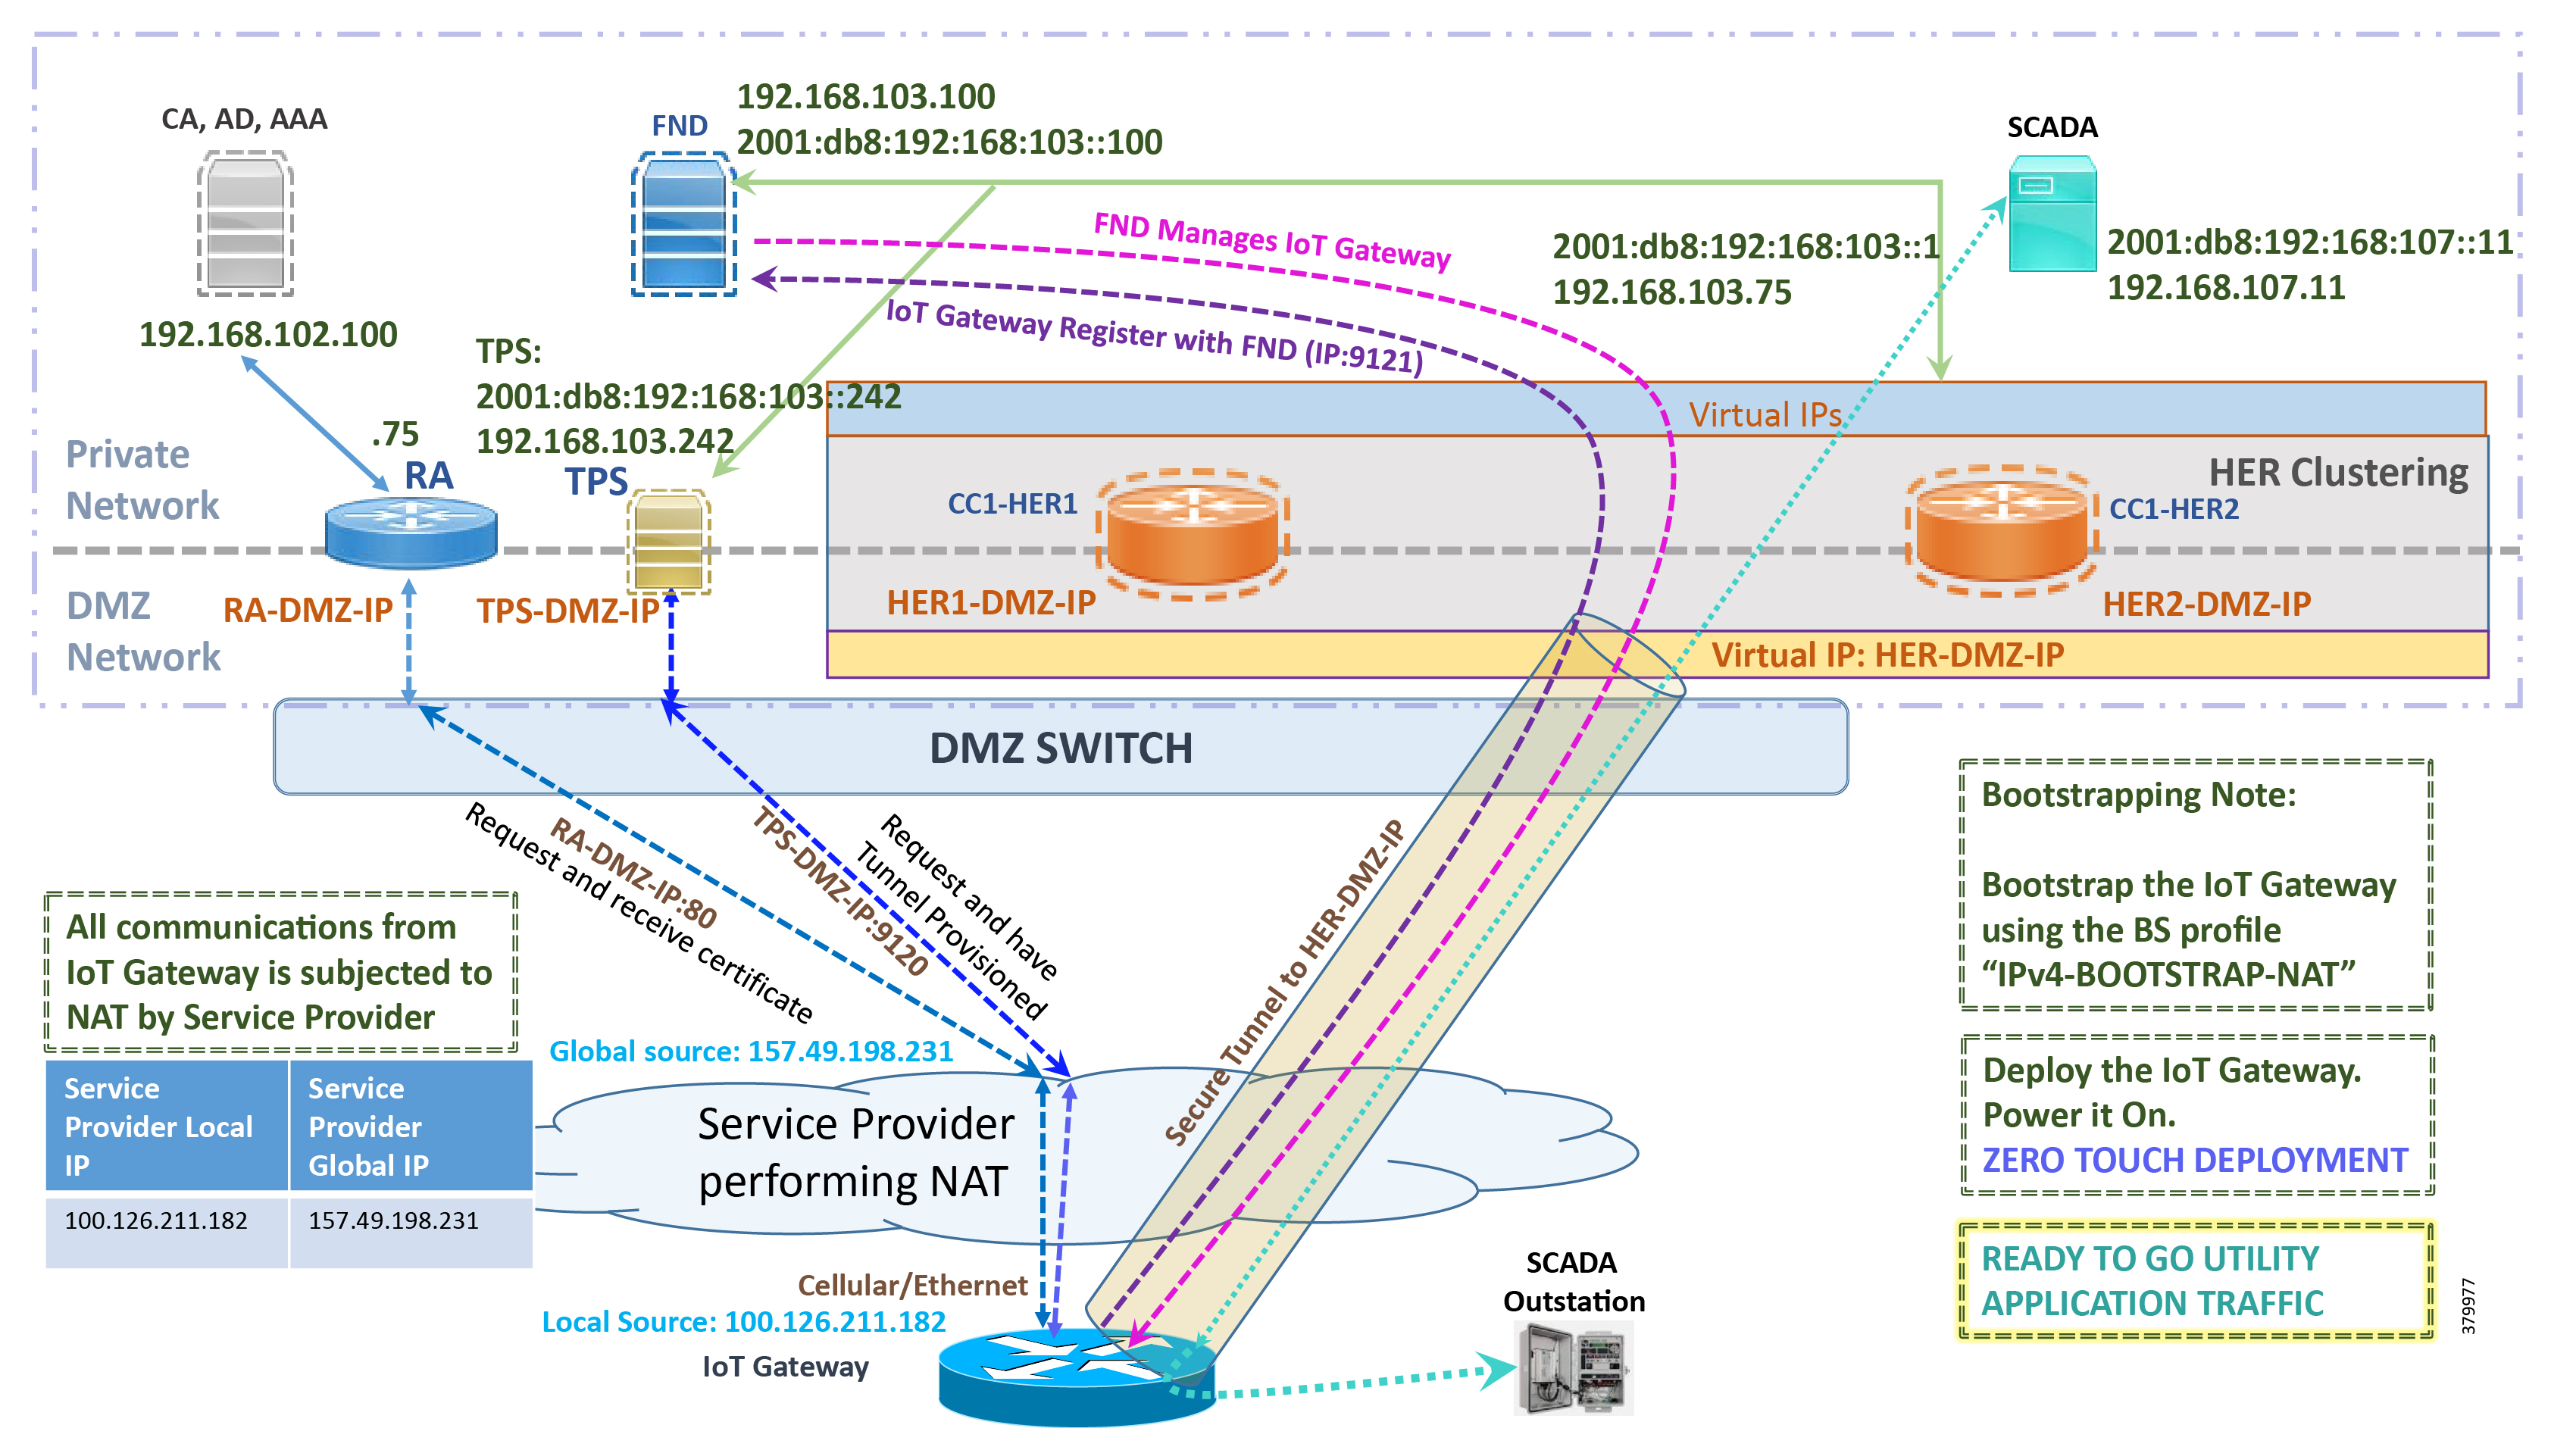
Note: This scenario has been validated with the headend located in the Cisco DMZ.
The following is the summary sequence of steps that occurs during the deployment:
1.![]() The IoT Gateway is powered on. When up, it obtains the IP address over LTE Cellular interface.
The IoT Gateway is powered on. When up, it obtains the IP address over LTE Cellular interface.
2.![]() The EEM Script for ZTD kicks in and waits for the time to be synchronized. Then, SCEP enrollment happens over port 80 with RA-DMZ-IP.
The EEM Script for ZTD kicks in and waits for the time to be synchronized. Then, SCEP enrollment happens over port 80 with RA-DMZ-IP.
3.![]() Once the certificate is received for the IoT Gateway (from the RA/CA), the ZTD script disables itself and activates the CGNA profile for tunnel provisioning (cgna initiator-profile cg-nms-tunnel).
Once the certificate is received for the IoT Gateway (from the RA/CA), the ZTD script disables itself and activates the CGNA profile for tunnel provisioning (cgna initiator-profile cg-nms-tunnel).
Note: “cgna initiator-profile cg-nms-tunnel” must be used when the IoT Gateway is behind NAT, whereas “ cgna profile cg-nms-tunnel” must be used when no NAT exists between IoT Gateway and TPS. This CGNA profile is configured as part of bootstrapping.
4.![]() TPS/FND provisions the secure FlexVPN tunnel with the HER Cluster located in the DSO Control Center1.
TPS/FND provisions the secure FlexVPN tunnel with the HER Cluster located in the DSO Control Center1.
5.![]() As an overlay routing, FND and SCADA routes are advertised (by the HER) to the IoT Gateway through the secure FlexVPN tunnel.
As an overlay routing, FND and SCADA routes are advertised (by the HER) to the IoT Gateway through the secure FlexVPN tunnel.
6.![]() The IoT Gateway sends out a registration request to FND on port 9121. Once registered successfully, the IOT Gateway is remotely manageable from the FND.
The IoT Gateway sends out a registration request to FND on port 9121. Once registered successfully, the IOT Gateway is remotely manageable from the FND.
7.![]() As part of the device registration with the FND, FND also pushes SCADA Traffic enablement configurations to the IoT Gateway, which enables the communication between the SCADA Master in the Control Center and the SCADA Outstation located in the Secondary Substation/Distribution Network.
As part of the device registration with the FND, FND also pushes SCADA Traffic enablement configurations to the IoT Gateway, which enables the communication between the SCADA Master in the Control Center and the SCADA Outstation located in the Secondary Substation/Distribution Network.
Deployment over IPv4 Network without NAT
Note: This section has no implementation steps. As the name “ZTD” suggests, it's a zero touch deployment. As long as bootstrapping happened successfully by having the IoT Gateway part of the right bootstrapping group, this deployment should happen successfully with no manual steps.
Figure 33 captures the deployment steps for IoT Gateway without NAT over the IPv4 network:
Figure 33 Deployment over IPv4 Ethernet Network in Engineering Lab Topology
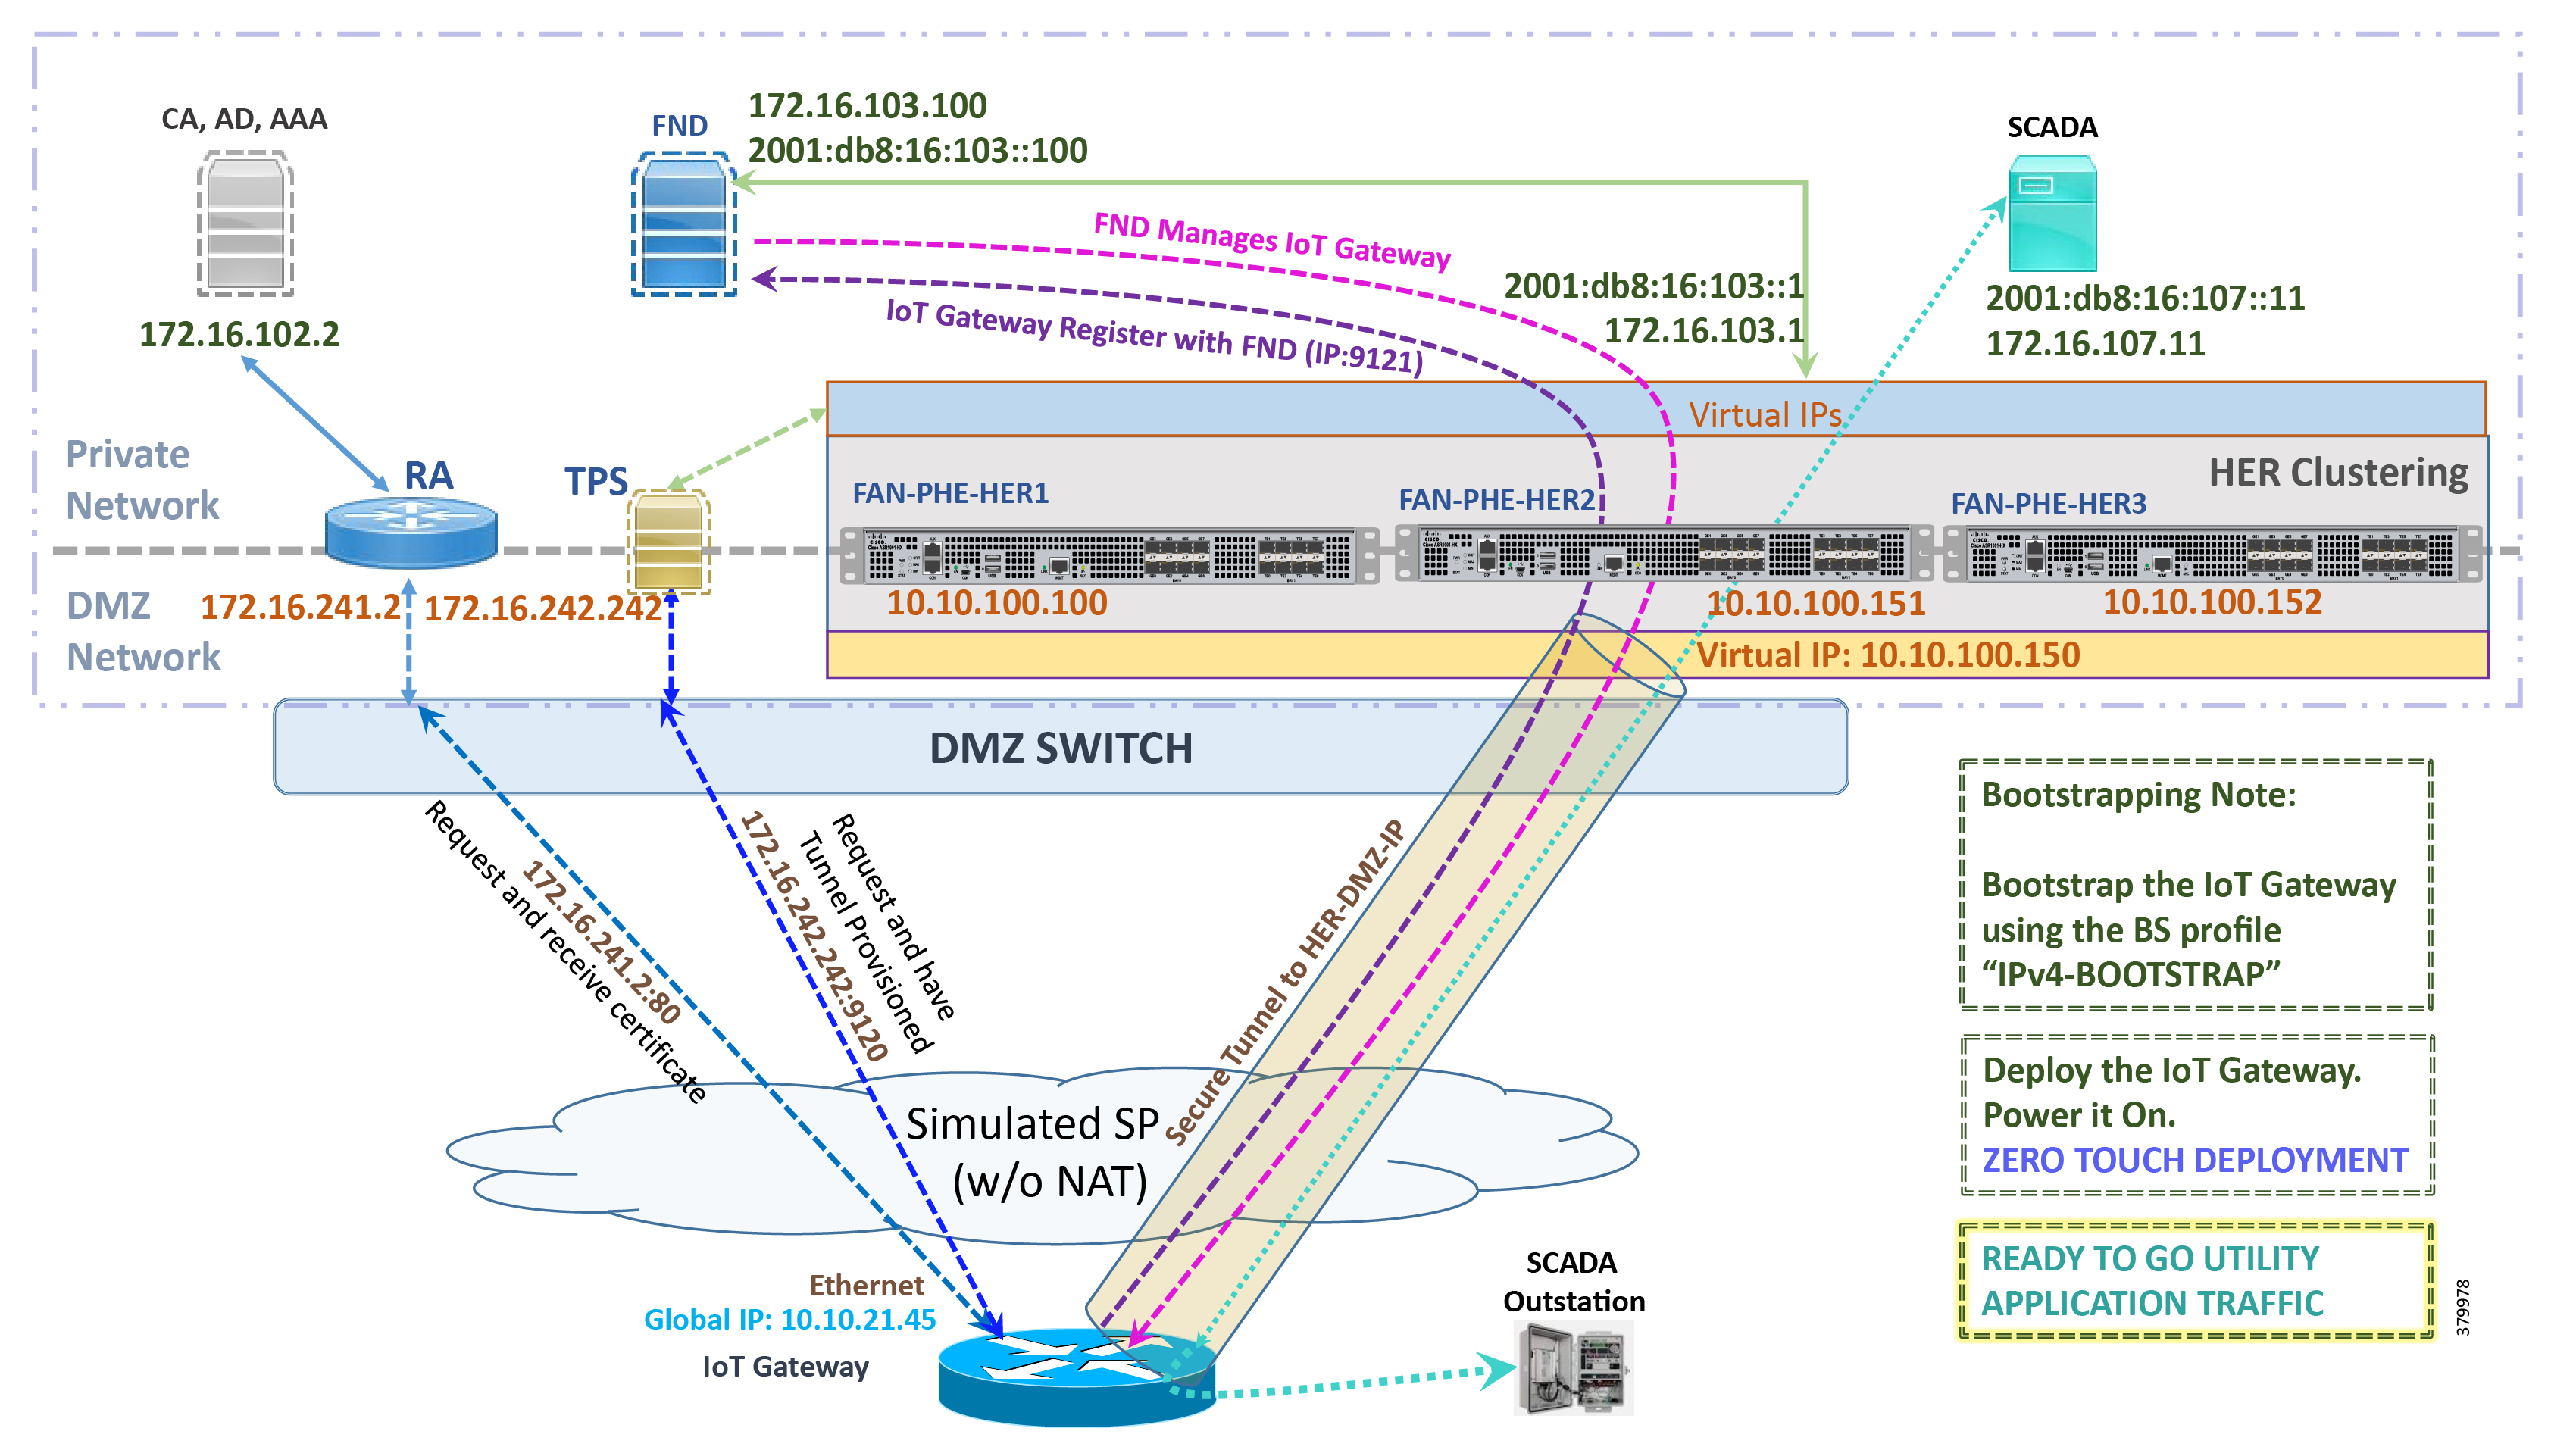
Note: This scenario has been validated with the headend located in the Engineering Lab Topology.
The following is the summary sequence of steps that happens during the deployment:
1.![]() The IoT Gateway is powered on. When up, it obtains the IP address over the Ethernet interface.
The IoT Gateway is powered on. When up, it obtains the IP address over the Ethernet interface.
2.![]() The EEM Script for ZTD kicks in and waits for the time to be synchronized. Then, SCEP enrollment happens with RA IP (172.16.241.2) on port 80.
The EEM Script for ZTD kicks in and waits for the time to be synchronized. Then, SCEP enrollment happens with RA IP (172.16.241.2) on port 80.
3.![]() Once the certificate is received for the IoT Gateway (from the RA/CA), the ZTD script disables itself, and activates the CGNA profile for tunnel provisioning (cgna profile cg-nms- tunnel).
Once the certificate is received for the IoT Gateway (from the RA/CA), the ZTD script disables itself, and activates the CGNA profile for tunnel provisioning (cgna profile cg-nms- tunnel).
Note: “cgna profile cg-nms-tunnel ” must be used when there is no NAT between IoT Gateway and TPS. This CGNA profile has already been configured as part of IoT Gateway bootstrapping. TPS/FND provisions secure FlexVPN tunnel with the HER Cluster located in the DSO Control Center1.
4.![]() As an overlay routing, FND (172.16.103.100 and 2001:db8:16:103::100) and SCADA (172.16.107.11 and 2001:db8:16:107::11) routes are advertised (by HER) to the IoT Gateway through the secure FlexVPN tunnel.
As an overlay routing, FND (172.16.103.100 and 2001:db8:16:103::100) and SCADA (172.16.107.11 and 2001:db8:16:107::11) routes are advertised (by HER) to the IoT Gateway through the secure FlexVPN tunnel.
5.![]() IoT Gateway sends out a registration request to FND IPv4 address 172.16.103.100 (or) IPv6 address 2001:db8:16:103::100 on port 9121. Once registered successfully, the IOT Gateway is remotely manageable from the FND.
IoT Gateway sends out a registration request to FND IPv4 address 172.16.103.100 (or) IPv6 address 2001:db8:16:103::100 on port 9121. Once registered successfully, the IOT Gateway is remotely manageable from the FND.
6.![]() As part of the device registration with the FND, FND also pushes SCADA Traffic enablement configurations to the IoT Gateway, which enables the communication between SCADA Master in the Control Center and the SCADA Outstation located in the Secondary Substation/Distribution Network.
As part of the device registration with the FND, FND also pushes SCADA Traffic enablement configurations to the IoT Gateway, which enables the communication between SCADA Master in the Control Center and the SCADA Outstation located in the Secondary Substation/Distribution Network.
Deployment over Native IPv6 Ethernet Network
Note: This section has no implementation steps. As the name “ZTD” suggests, it's a zero touch deployment. As long as bootstrapping happened successfully by having the IoT Gateway part of the right bootstrapping group, this deployment should happen successfully with no manual steps being synchronized.
Figure 34 captures the deployment steps for the IoT Gateway over the Native IPv6 network:
Figure 34 Deployment over Native IPv6 Ethernet Network in Engineering Lab Topology
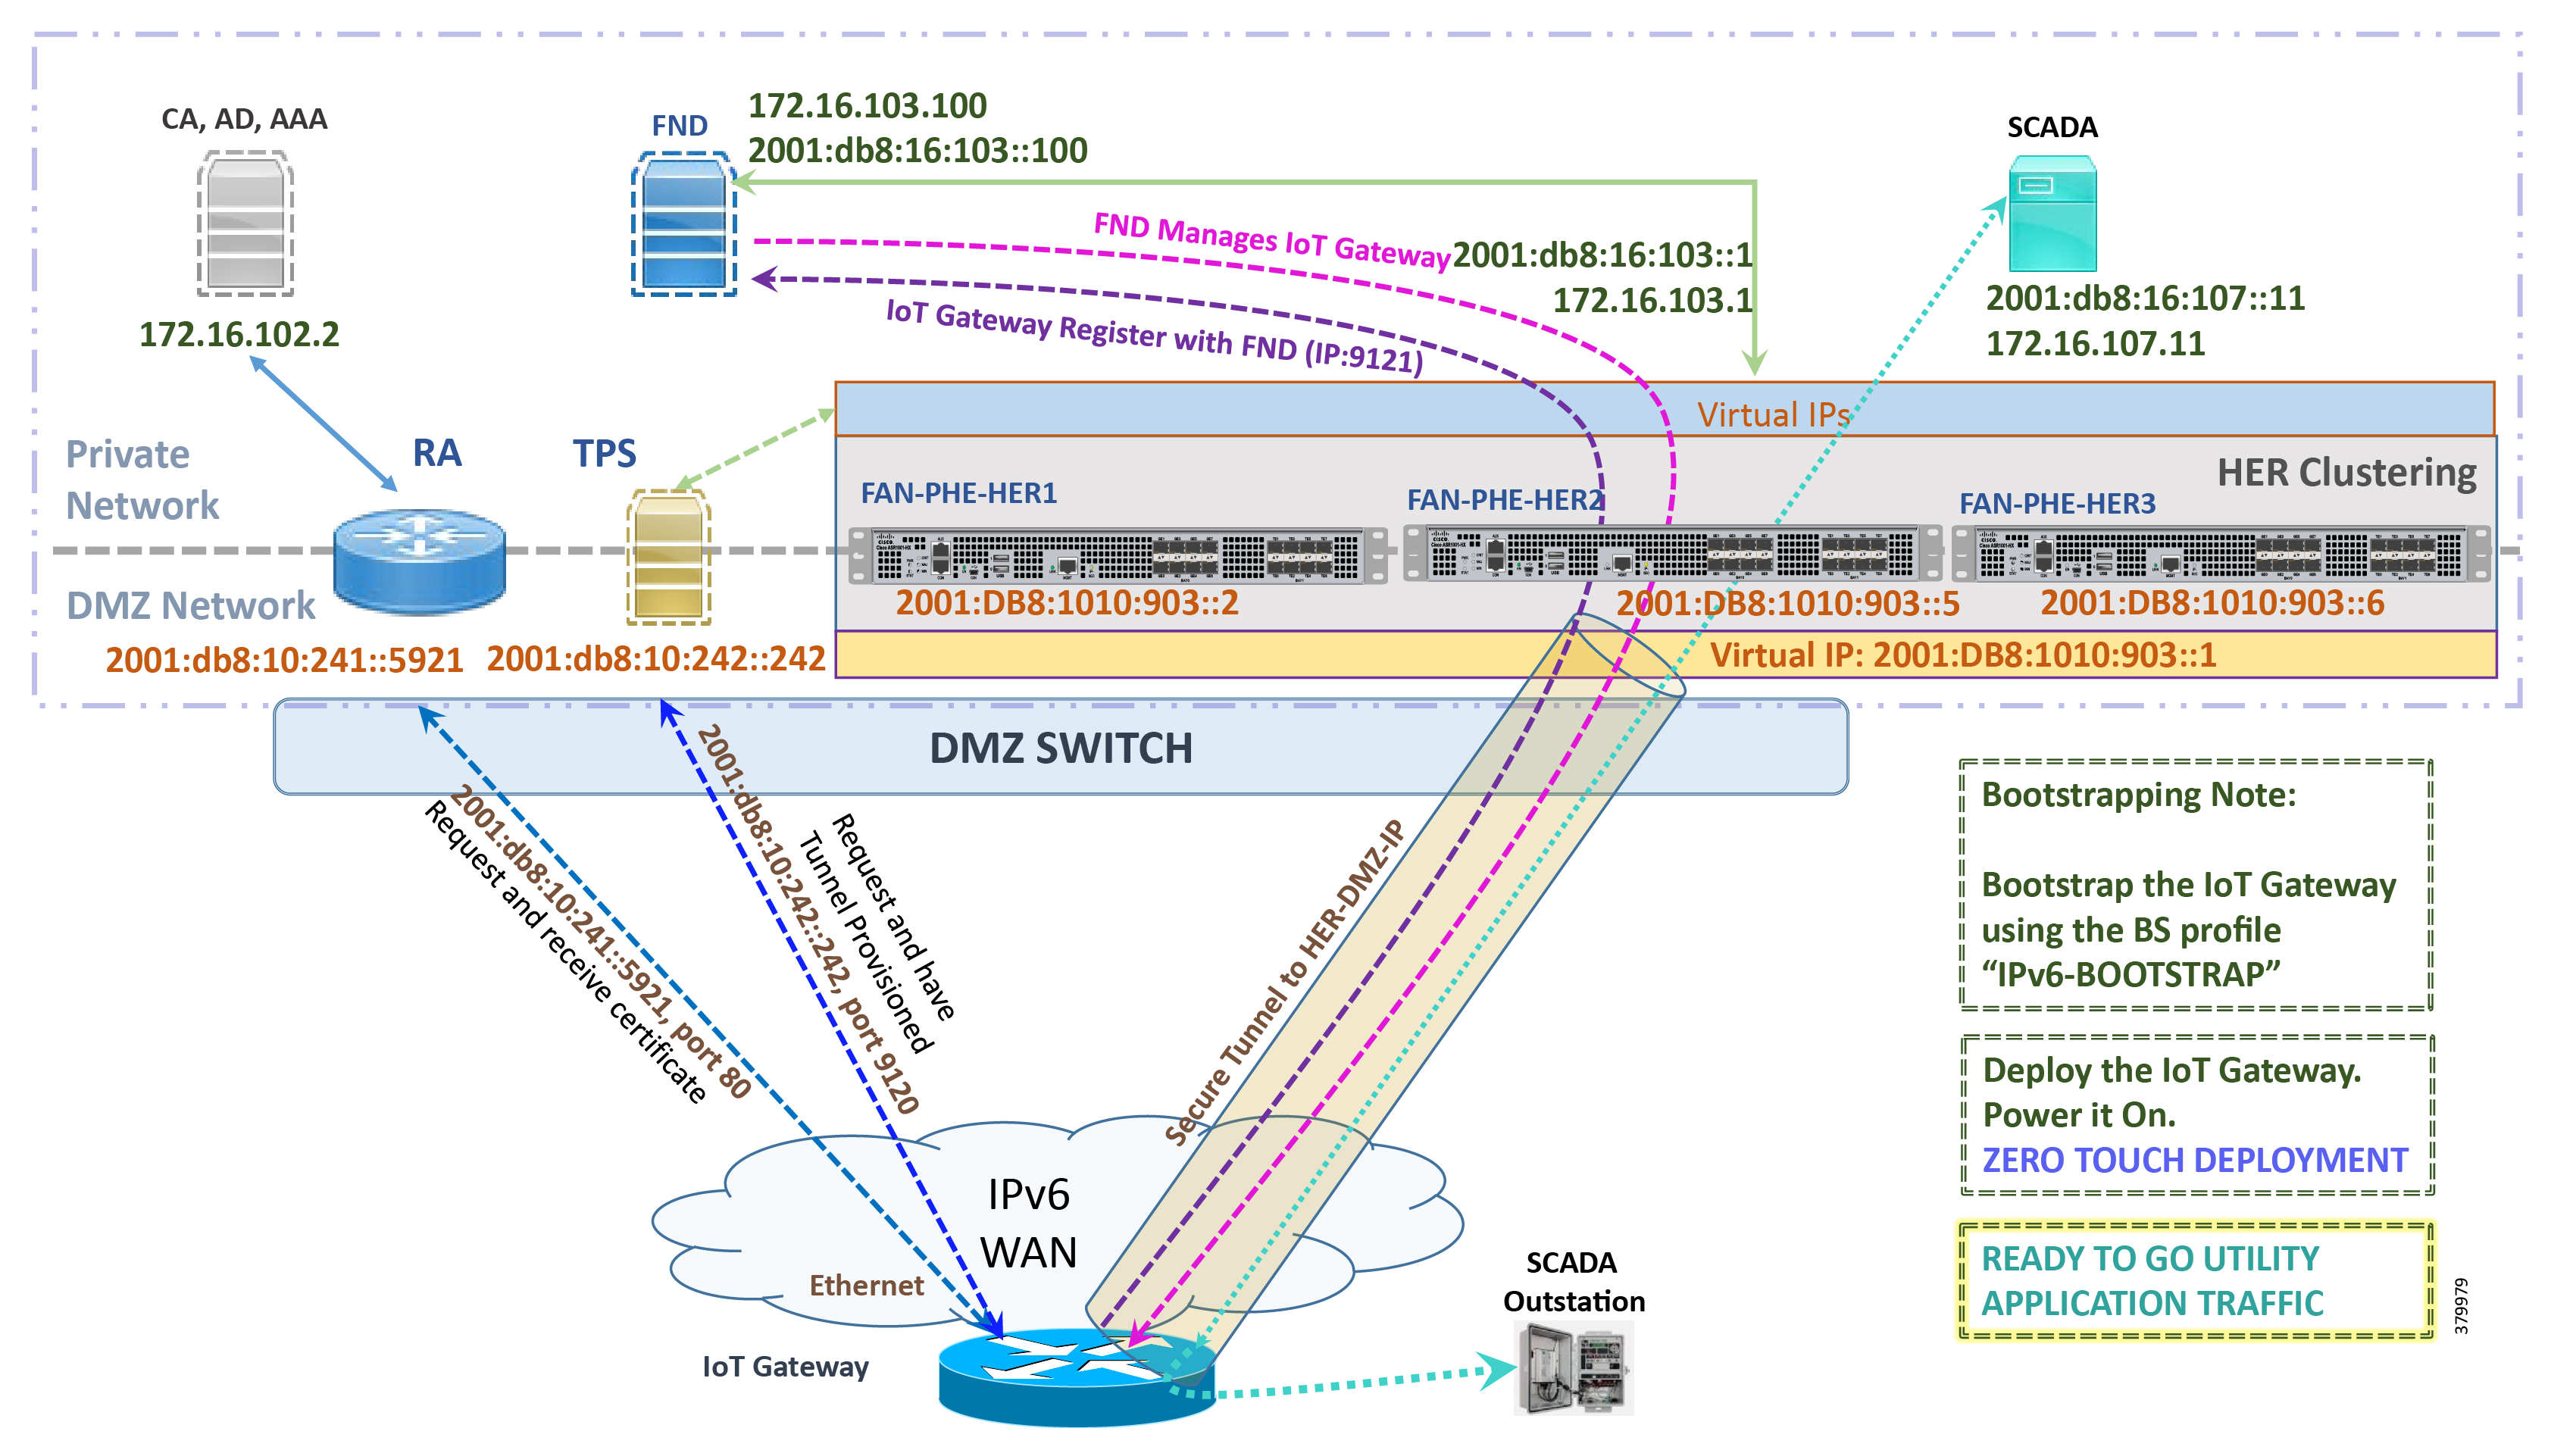
Note: This scenario has been validated with the headend located in the Engineering Lab Topology over a native IPv6 network. It could be dual stack as well.
The following is the summary sequence of steps that happens during the deployment:
1.![]() The IoT Gateway is powered on. When up, it obtains the IPv6 address over the Ethernet interface.
The IoT Gateway is powered on. When up, it obtains the IPv6 address over the Ethernet interface.
2.![]() The EEM script for ZTD kicks in and waits for the time to be synchronized. Then, SCEP enrollment happens with RA IPv6 address (2001:db8:10:241::5921) on port 80.
The EEM script for ZTD kicks in and waits for the time to be synchronized. Then, SCEP enrollment happens with RA IPv6 address (2001:db8:10:241::5921) on port 80.
3.![]() IPv4 communication could be retained between RA and CA in the Control Center private network.
IPv4 communication could be retained between RA and CA in the Control Center private network.
4.![]() Once the certificate is received for the IoT Gateway (from the RA/CA), the ZTD script disables itself, and activates the CGNA profile for tunnel provisioning.
Once the certificate is received for the IoT Gateway (from the RA/CA), the ZTD script disables itself, and activates the CGNA profile for tunnel provisioning.
Note: “cgna initiator-profile cg-nms-tunnel” must be used when the IoT Gateway is behind NAT, whereas “ cgna profile cg-nms-tunnel” must be used when there is no NAT between IoT Gateway and TPS. This CGNA profile has already been configured as part of the IoT Gateway bootstrapping.
5.![]() TPS/FND provisions secure the FlexVPN tunnel with the HER Cluster located in the DSO Control Center1, over the Native IPv6 network.
TPS/FND provisions secure the FlexVPN tunnel with the HER Cluster located in the DSO Control Center1, over the Native IPv6 network.
6.![]() As an overlay routing, FND (172.16.103.100 and 2001:db8:16:103::100) and SCADA (172.16.107.11 and 2001:db8:16:107::11) routes are advertised (by HER) to the IoT Gateway through the secure FlexVPN tunnel.
As an overlay routing, FND (172.16.103.100 and 2001:db8:16:103::100) and SCADA (172.16.107.11 and 2001:db8:16:107::11) routes are advertised (by HER) to the IoT Gateway through the secure FlexVPN tunnel.
7.![]() IoT Gateway sends out a registration request to FND IPv4 address 172.16.103.100 (or) IPv6 address 2001:db8:16:103::100 on port 9121. Once registered successfully, IOT Gateway is remotely manageable from the FND.
IoT Gateway sends out a registration request to FND IPv4 address 172.16.103.100 (or) IPv6 address 2001:db8:16:103::100 on port 9121. Once registered successfully, IOT Gateway is remotely manageable from the FND.
8.![]() As part of the device registration with the FND, FND also pushes SCADA Traffic enablement configurations to the IoT Gateway, which enables the communication between SCADA Master in the Control Center and the SCADA Outstation located in the secondary substation/Distribution Network.
As part of the device registration with the FND, FND also pushes SCADA Traffic enablement configurations to the IoT Gateway, which enables the communication between SCADA Master in the Control Center and the SCADA Outstation located in the secondary substation/Distribution Network.
Tunnel Provisioning Template Profiles
Tunnel Provisioning Template profiles, which are needed for Tunnel establishment, are captured in Appendix B: FND Zero Touch Deployment Profiles.
Device Configuration Template Profiles
Device Configuration Template profiles, which are needed for ICT SCADA Traffic enablement, are captured in Appendix B: FND Zero Touch Deployment Profiles.
Bootstrapping and ZTD of the Cisco IoT Gateway at the Deployment Location
This section describes the bootstrapping and Deployment of the Cisco IoT gateway at the deployed location. Unlike the previous section, one TPS and FND are sufficient to complete both bootstrapping and ZTD. Although the previous two sections and this section overlap, minor changes in the implementation of TPS and FND need to be done for successful deployment.
This section, which covers the minor changes that have to be implemented in the headend setup, describes the following phases:
Prerequisites
Prerequisites include the following:
■![]() TPS and FND server must be up and running.
TPS and FND server must be up and running.
■![]() This section focuses on portions required for TPS and FND to carry out both bootstrapping and ZTD.
This section focuses on portions required for TPS and FND to carry out both bootstrapping and ZTD.
■![]() Routing reachability over IPv4 and/or IPv6 networks from IoT Gateways to TPS.
Routing reachability over IPv4 and/or IPv6 networks from IoT Gateways to TPS.
Certificate Creation and Installation
This section captures the parameters that need to be considered while creating the certificate for the TPS and FND.
Note: For detailed instructions about certificate creation, please refer to the section “Creation of Certificate Templates and Certificates” of the Cisco FAN-Headend Deep Dive Implementation and FAN Use Cases Guide at the following URL:
■![]() https://docs.cisco.com/share/proxy/alfresco/url?docnum=EDCS-15726915
https://docs.cisco.com/share/proxy/alfresco/url?docnum=EDCS-15726915
Certificate Creation for TPS
The certificate for the TPS must be created with both the Subject Name and the Subject Alternative Name fields populated.
Figure 35 TPS Certificate Parameters
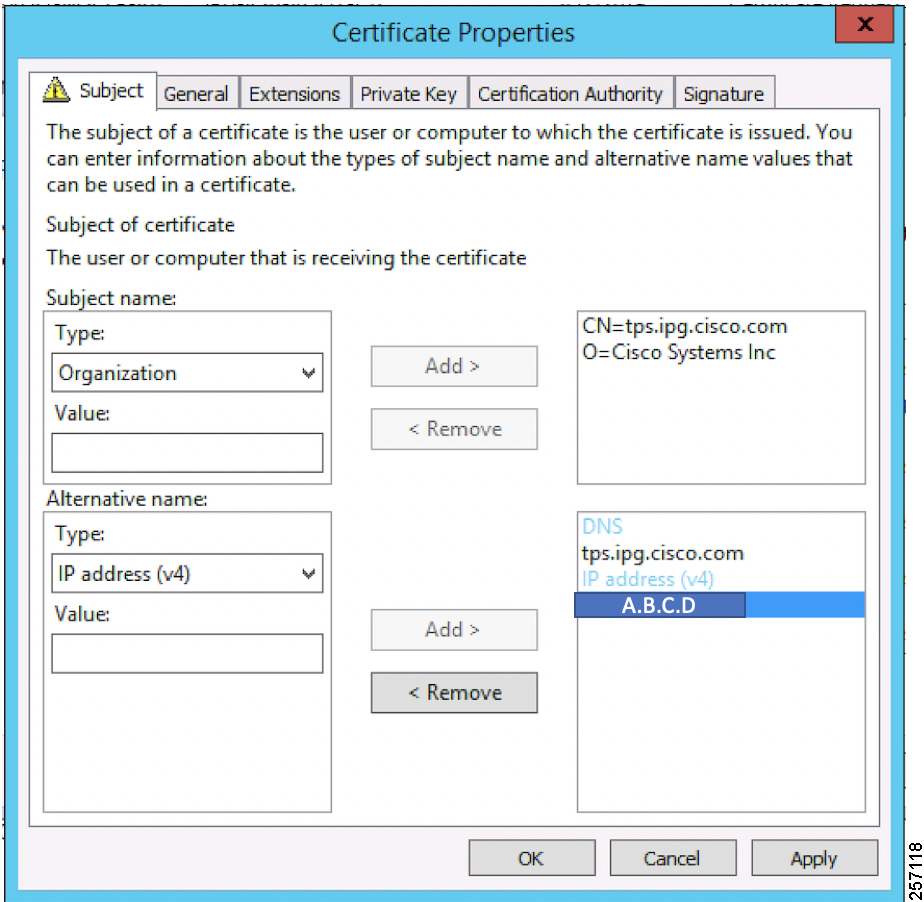
The Subject Name is the Common Name that must be set to the FQDN of the TPS.
The Subject Alternative Name must be set to the FQDN - tps.ipg.cisco.com of the TPS, along with the IP address (A.B.C.D - Public reachable DMZ IP). The Subject Alternative Name is required for PnP to work. The IP address must be reachable from the IoT Gateway. TPS is located in DMZ. The IP address is not optional in this implementation. FQDN is optional, but the IP address is not.
The enrolled certificate is exported as PnP-ZTD-TPS.pfx and is protected with a password.
Certificate Creation for FND
The FND certificate must be created with both the Subject Name and Subject Alternative Name fields populated.
Figure 36 FND Certificate Parameters

The Subject Name is the Common Name that must be set to the FQDN of the PnP Server.
The Subject Alternative Name must be set to the FQDN of the FND, along with the optional IP address. The Subject Alternative Name is required for PnP to work. The IP address in Figure 36 will be reachable after tunnel is established between IoT gateway and the headend.
The enrolled certificate is exported as PnP-ZTD-FND.pfx and is protected with a password.
Installation of TPS
The bootstrapping procedure in this implementation guide considers the use of TPS as PnP Proxy. For installation of TPS, please refer to Installation of TPS.
Installation of FND
For installation of FND, please refer to the detailed steps covered under the section “Implementing Field Network Director” of the Cisco FAN-Headend Deep Dive Implementation and FAN Use Cases Guide.
Configuration of TPS
This section covers the configuration steps and the final verification steps on the TPS.
TPS Proxy Properties Configuration
TPS Proxy Properties file needs to be configured with the following details:
■![]() inbound-bsproxy-destination: Address to which the bootstrapping requests be forwarded.
inbound-bsproxy-destination: Address to which the bootstrapping requests be forwarded.
■![]() enable-bootstrap-service: Is bootstrapping service enabled/disabled?
enable-bootstrap-service: Is bootstrapping service enabled/disabled?
■![]() bootstrap-proxy-listen-port: Port on which the PnP Proxy must be listening for processing bootstrapping requests (default port is 9125).
bootstrap-proxy-listen-port: Port on which the PnP Proxy must be listening for processing bootstrapping requests (default port is 9125).
Name resolution entries have to be present for FND FQDN in the /etc/hosts file.
Mandatory Verification Checks on TPS Proxy
The verification checks include the following:
■![]() FND FQDN entry in /etc/hosts.
FND FQDN entry in /etc/hosts.
■![]() TPS must have three certificates installed into the cgms_keystore:
TPS must have three certificates installed into the cgms_keystore:
–![]() Certificate signed by Utility PKI for TPS (with private key)
Certificate signed by Utility PKI for TPS (with private key)
–![]() Public Certificate of the Utility PKI CA server
Public Certificate of the Utility PKI CA server
–![]() Public Certificate of the Cisco SUDI CA
Public Certificate of the Cisco SUDI CA
■![]() Hostname consistency with the certificate.
Hostname consistency with the certificate.
■![]() There shouldn't be any unreachable name servers in /etc/resolv.conf.
There shouldn't be any unreachable name servers in /etc/resolv.conf.
■![]() NTP daemon should be running. Time should be synchronized.
NTP daemon should be running. Time should be synchronized.
■![]() Necessary firewall ports must have been opened up, if the firewall/iptables/ip6tables are enabled:
Necessary firewall ports must have been opened up, if the firewall/iptables/ip6tables are enabled:
–![]() TCP Port 9125 to process http communication
TCP Port 9125 to process http communication
–![]() TCP port 9120 to process https communication
TCP port 9120 to process https communication
■![]() FND FQDN entry in /etc/hosts:
FND FQDN entry in /etc/hosts:
TPS must have three certificates installed into the cgms_keystore:
■![]() The certificate entry 'root' represents the Utility PKI CA certificate.
The certificate entry 'root' represents the Utility PKI CA certificate.
■![]() The certificate entry 'sudi' represents the Cisco SUDI CA certificate.
The certificate entry 'sudi' represents the Cisco SUDI CA certificate.
■![]() The certificate entry 'cgms' represents the private certificate of the TPS server signed by the (custom) Utility PKI CA server.
The certificate entry 'cgms' represents the private certificate of the TPS server signed by the (custom) Utility PKI CA server.
Keytool -list -keystore /opt/cgms-tpsproxy/conf/cgms_keystore:
Hostname should match the certificate Common Name/SAN:
No unreachable name servers should exist. Either the name servers should be present and reachable or they should be empty. Any unreachable name server address entry must be taken care or removed under the network interface configuration.
NTP daemon should be running. Time should be synchronized:
Note: The TPS server should be time synchronized. Otherwise, the https communication from the IoT Gateway might not reach the TPS Proxy Application.
Configuration of FND
This section covers the configuration steps and the final verification steps on the FND.
CGMS Properties Configuration
The CGMS Properties file needs to be configured with the following details:
■![]() proxy-bootstrap-ip: Address of the PnP Proxy from which the bootstrapping requests are processed
proxy-bootstrap-ip: Address of the PnP Proxy from which the bootstrapping requests are processed
■![]() enable-bootstrap-service: Enable/Disable the bootstrapping service
enable-bootstrap-service: Enable/Disable the bootstrapping service
■![]() bootstrap-fnd-alias: The trust point alias to be used during bootstrapping of the IoT Gateway
bootstrap-fnd-alias: The trust point alias to be used during bootstrapping of the IoT Gateway
■![]() ca-fingerprint: fingerprint of the 'root' trustpoint
ca-fingerprint: fingerprint of the 'root' trustpoint
Name resolution entries have to be present for TPS FQDN in the /etc/hosts file.
In our lab setup, the proxy-bootstrap-ip is a DMZ IP. In cases where FQDN is globally resolvable, then FQDN can be used instead of IP.
Mandatory Verification Checks on FND
Verification checks include the following:
■![]() TPS FQDN entry in the /etc/hosts file.
TPS FQDN entry in the /etc/hosts file.
■![]() FND must have three certificates installed into the cgms_keystore:
FND must have three certificates installed into the cgms_keystore:
–![]() Certificate signed by Utility PKI for FND (with private key)
Certificate signed by Utility PKI for FND (with private key)
–![]() Public Certificate of the Utility PKI CA server
Public Certificate of the Utility PKI CA server
–![]() Public Certificate of the Cisco SUDI CA
Public Certificate of the Cisco SUDI CA
■![]() Hostname must be consistent with the certificate.
Hostname must be consistent with the certificate.
■![]() No unreachable name servers in /etc/resolv.conf should exist.
No unreachable name servers in /etc/resolv.conf should exist.
■![]() NTP daemon should be running. Time should be synchronized.
NTP daemon should be running. Time should be synchronized.
■![]() Necessary firewall ports must have been opened up if the firewall/iptables/ip6tables are enabled:
Necessary firewall ports must have been opened up if the firewall/iptables/ip6tables are enabled:
–![]() TCP Port 9125 to process http communication
TCP Port 9125 to process http communication
–![]() TCP port 9120 to process https communication
TCP port 9120 to process https communication
TPS/FND FQDN entry in the /etc/hosts file:
FND must have three certificates installed into the cgms_keystore:
■![]() The certificate entry 'root' represents the Utility PKI CA certificate.
The certificate entry 'root' represents the Utility PKI CA certificate.
■![]() The certificate entry 'sudi' represents the Cisco SUDI CA certificate.
The certificate entry 'sudi' represents the Cisco SUDI CA certificate.
■![]() The certificate entry 'cgms' represents the private certificate of the FND server signed by the (custom) Utility PKI CA server.
The certificate entry 'cgms' represents the private certificate of the FND server signed by the (custom) Utility PKI CA server.
Hostname should match the certificate Common Name/SAN:
No unreachable name servers should exist. Either the name servers should be present and reachable or they should be empty. Any unreachable name server address entry must be taken care or removed under the network interface configuration:
NTP daemon should be running. Time should be synchronized:
Note: The FND server should be time synchronized. Otherwise, the https communication from the IoT Gateway might not reach the FND (cgms) application.
Csv File Import on FND GUI
A sample csv file that can be imported into FND for bootstrapping of IoT Gateway is shown below:
Device Bootstrapping
After the above sections have been implemented, the headend is now ready for both provisioning and deployment.
The device bootstrapping is an important process as it eliminates the manual intervention to create and copy the express config to the device.
Device bootstrapping using Cisco PnP Connect has been clearly elucidated in PnP Server Discovery through Cisco PnP Connect and Bootstrapping.
Device Deployment
After the device has been successfully bootstrapped using Cisco PnP Connect, the device is now ready to undergo ZTD. No manual interface is required for the ZTD to begin.
Deployment over IPv4 Cellular Network with NAT, elucidates the ZTD process that would begin as soon as bootstrapping using Cisco PnP Connect is complete.
IoT Gateway Validation Matrix
Table 13 captures the Bootstrapping and ZTD validation matrix across the various platform types, supported as IoT Gateways:
From Table 13, Platform IR1101 has been validated for:
■![]() Bootstrapping over IPv6 Ethernet
Bootstrapping over IPv6 Ethernet
Similarly, Platform IR1101 has been validated for:
■![]() Bootstrapping over IPv4 Ethernet and Cellular
Bootstrapping over IPv4 Ethernet and Cellular
■![]() ZTD over IPv4 Ethernet/Cellular
ZTD over IPv4 Ethernet/Cellular
Similarly, Platform IR807 has been validated for:
■![]() Bootstrapping over IPv4 Ethernet and Cellular
Bootstrapping over IPv4 Ethernet and Cellular
■![]() ZTD over IPv4 Ethernet/Cellular
ZTD over IPv4 Ethernet/Cellular
All other platform types have been validated for:
ICT Enablement for SCADA Use Case Validation
This chapter includes the following major topics:
■![]() SCADA Single Control Center Point-to-Point Implementation Scenarios
SCADA Single Control Center Point-to-Point Implementation Scenarios
In order to ensure the proper functioning of substations and related equipment such as line-mounted switches and capacitors, most utilities use SCADA systems to automate monitoring and control.
New sites typically implement a SCADA system to monitor and control substations and related equipment. However, older facilities can also benefit by adding a SCADA system or by upgrading an existing SCADA system to take advantage of newer technologies.
The Distributed Automation Solution supports the SCADA service models shown in Table 14:
SCADA Single Control Center Point-to-Point Implementation Scenarios
In this scenario, the DSO will be hosting SCADA applications (Master) in a single Control Center. The SCADA Slave is connected to the DA Gateway or SSR via the serial or Ethernet interface. The SCADA Master residing in the DSO Control Center can communicate with the Slave using the IEC 60870-5-104 or IEC 60870-5-101 protocol.
The operations that can be executed when the communication protocol is T104 or T101 or T101-T104 translation are as follows:
■![]() Report by Exception (Slave > Master) - Notification
Report by Exception (Slave > Master) - Notification
The operations have been executed using a SCADA simulator known as the Distributed Test Manager (DTM), which has the capability of simulating both the Master and the Slave devices.
If the endpoint is connected to the SSR/ DA Gateway via the Ethernet port, then it is pure IP traffic. The IP address of the endpoint (i.e., IED) can be NAT’d so that the same subnet between the IED and the Ethernet interface of the DA Gateway can be reused. This approach will ease the deployment.
If the endpoint is connected using asynchronous serial (RS-232 or RS-485), then tunneling of serial traffic using raw sockets or protocol translation (T101 to T104) must happen at the gateway.
This document focuses on SCADA protocols such as T101 and T104 and the T101-T104 translation protocols widely used in the Europe Region with a single Control Center.
Figure 37 Single Control Center Topology
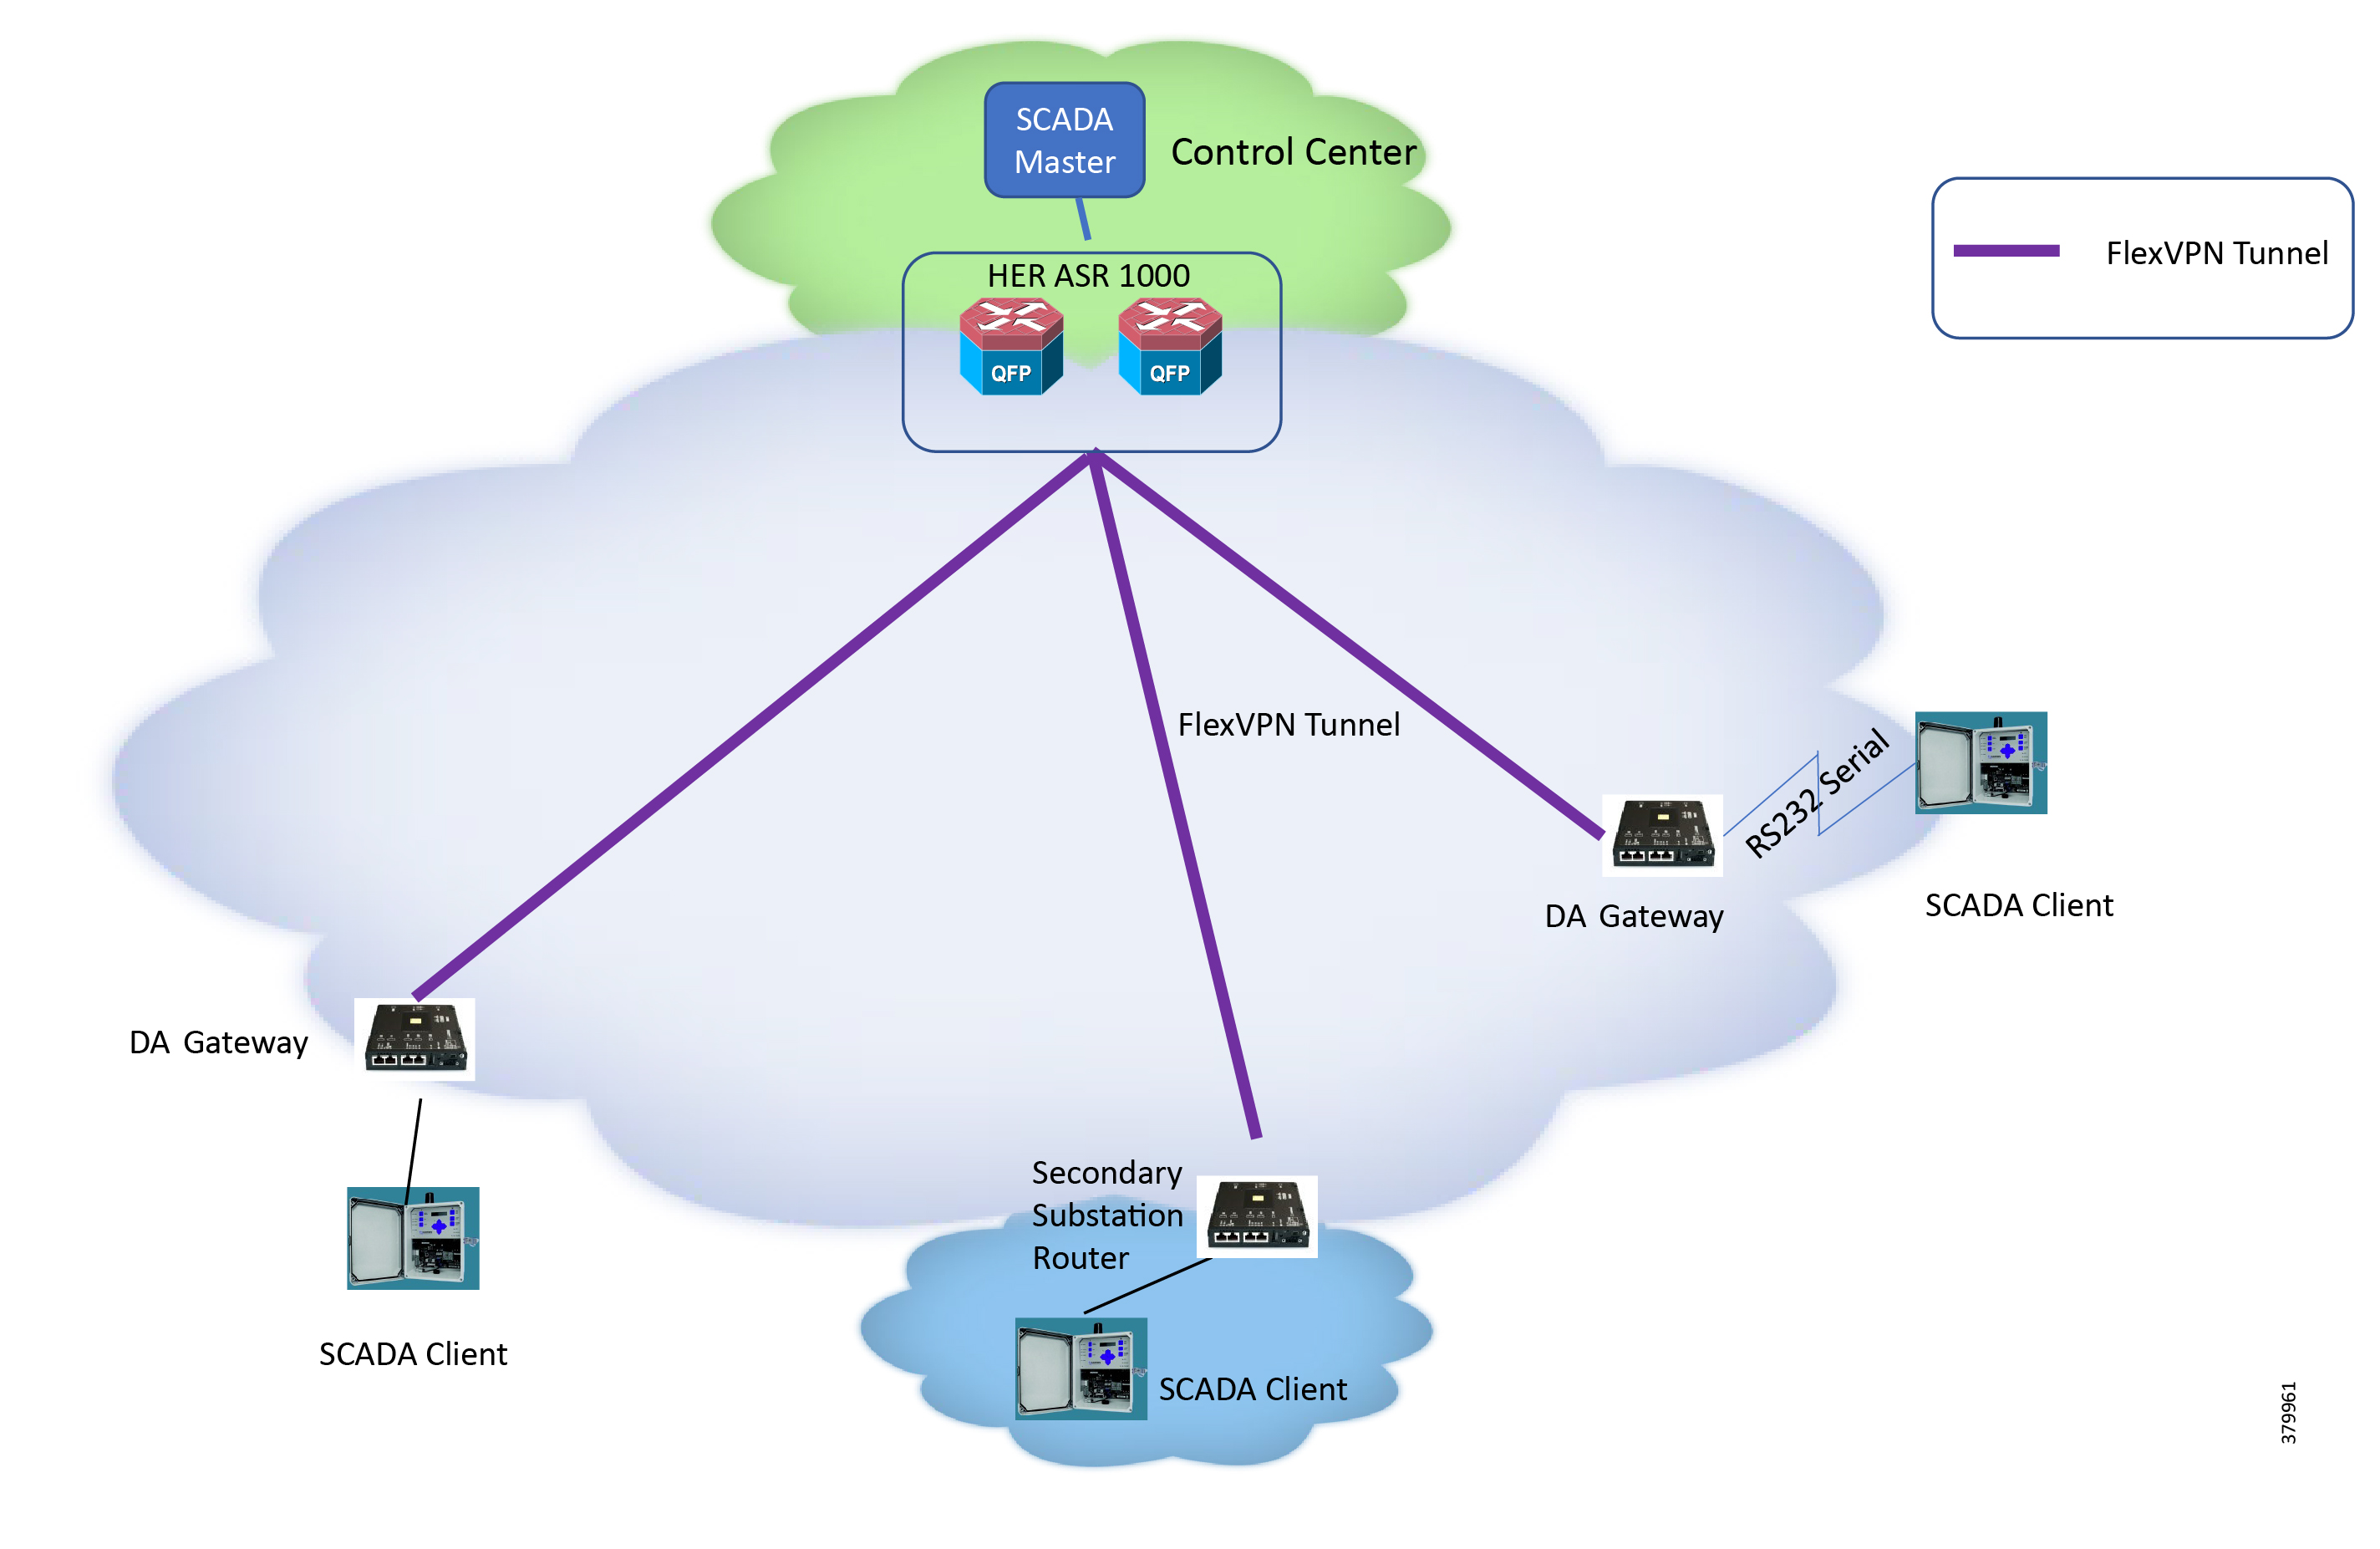
IR110 and IR807 are implemented as DA Gateways and SSRs. ASR 1000s implemented in clustering mode act as a HER, which terminates FlexVPN tunnels from DA Gateways and SSRs.
IP-Based SCADA
Protocol Validated
The protocol we have validated for this release is IEC 60870-5-104.
Flow Diagram
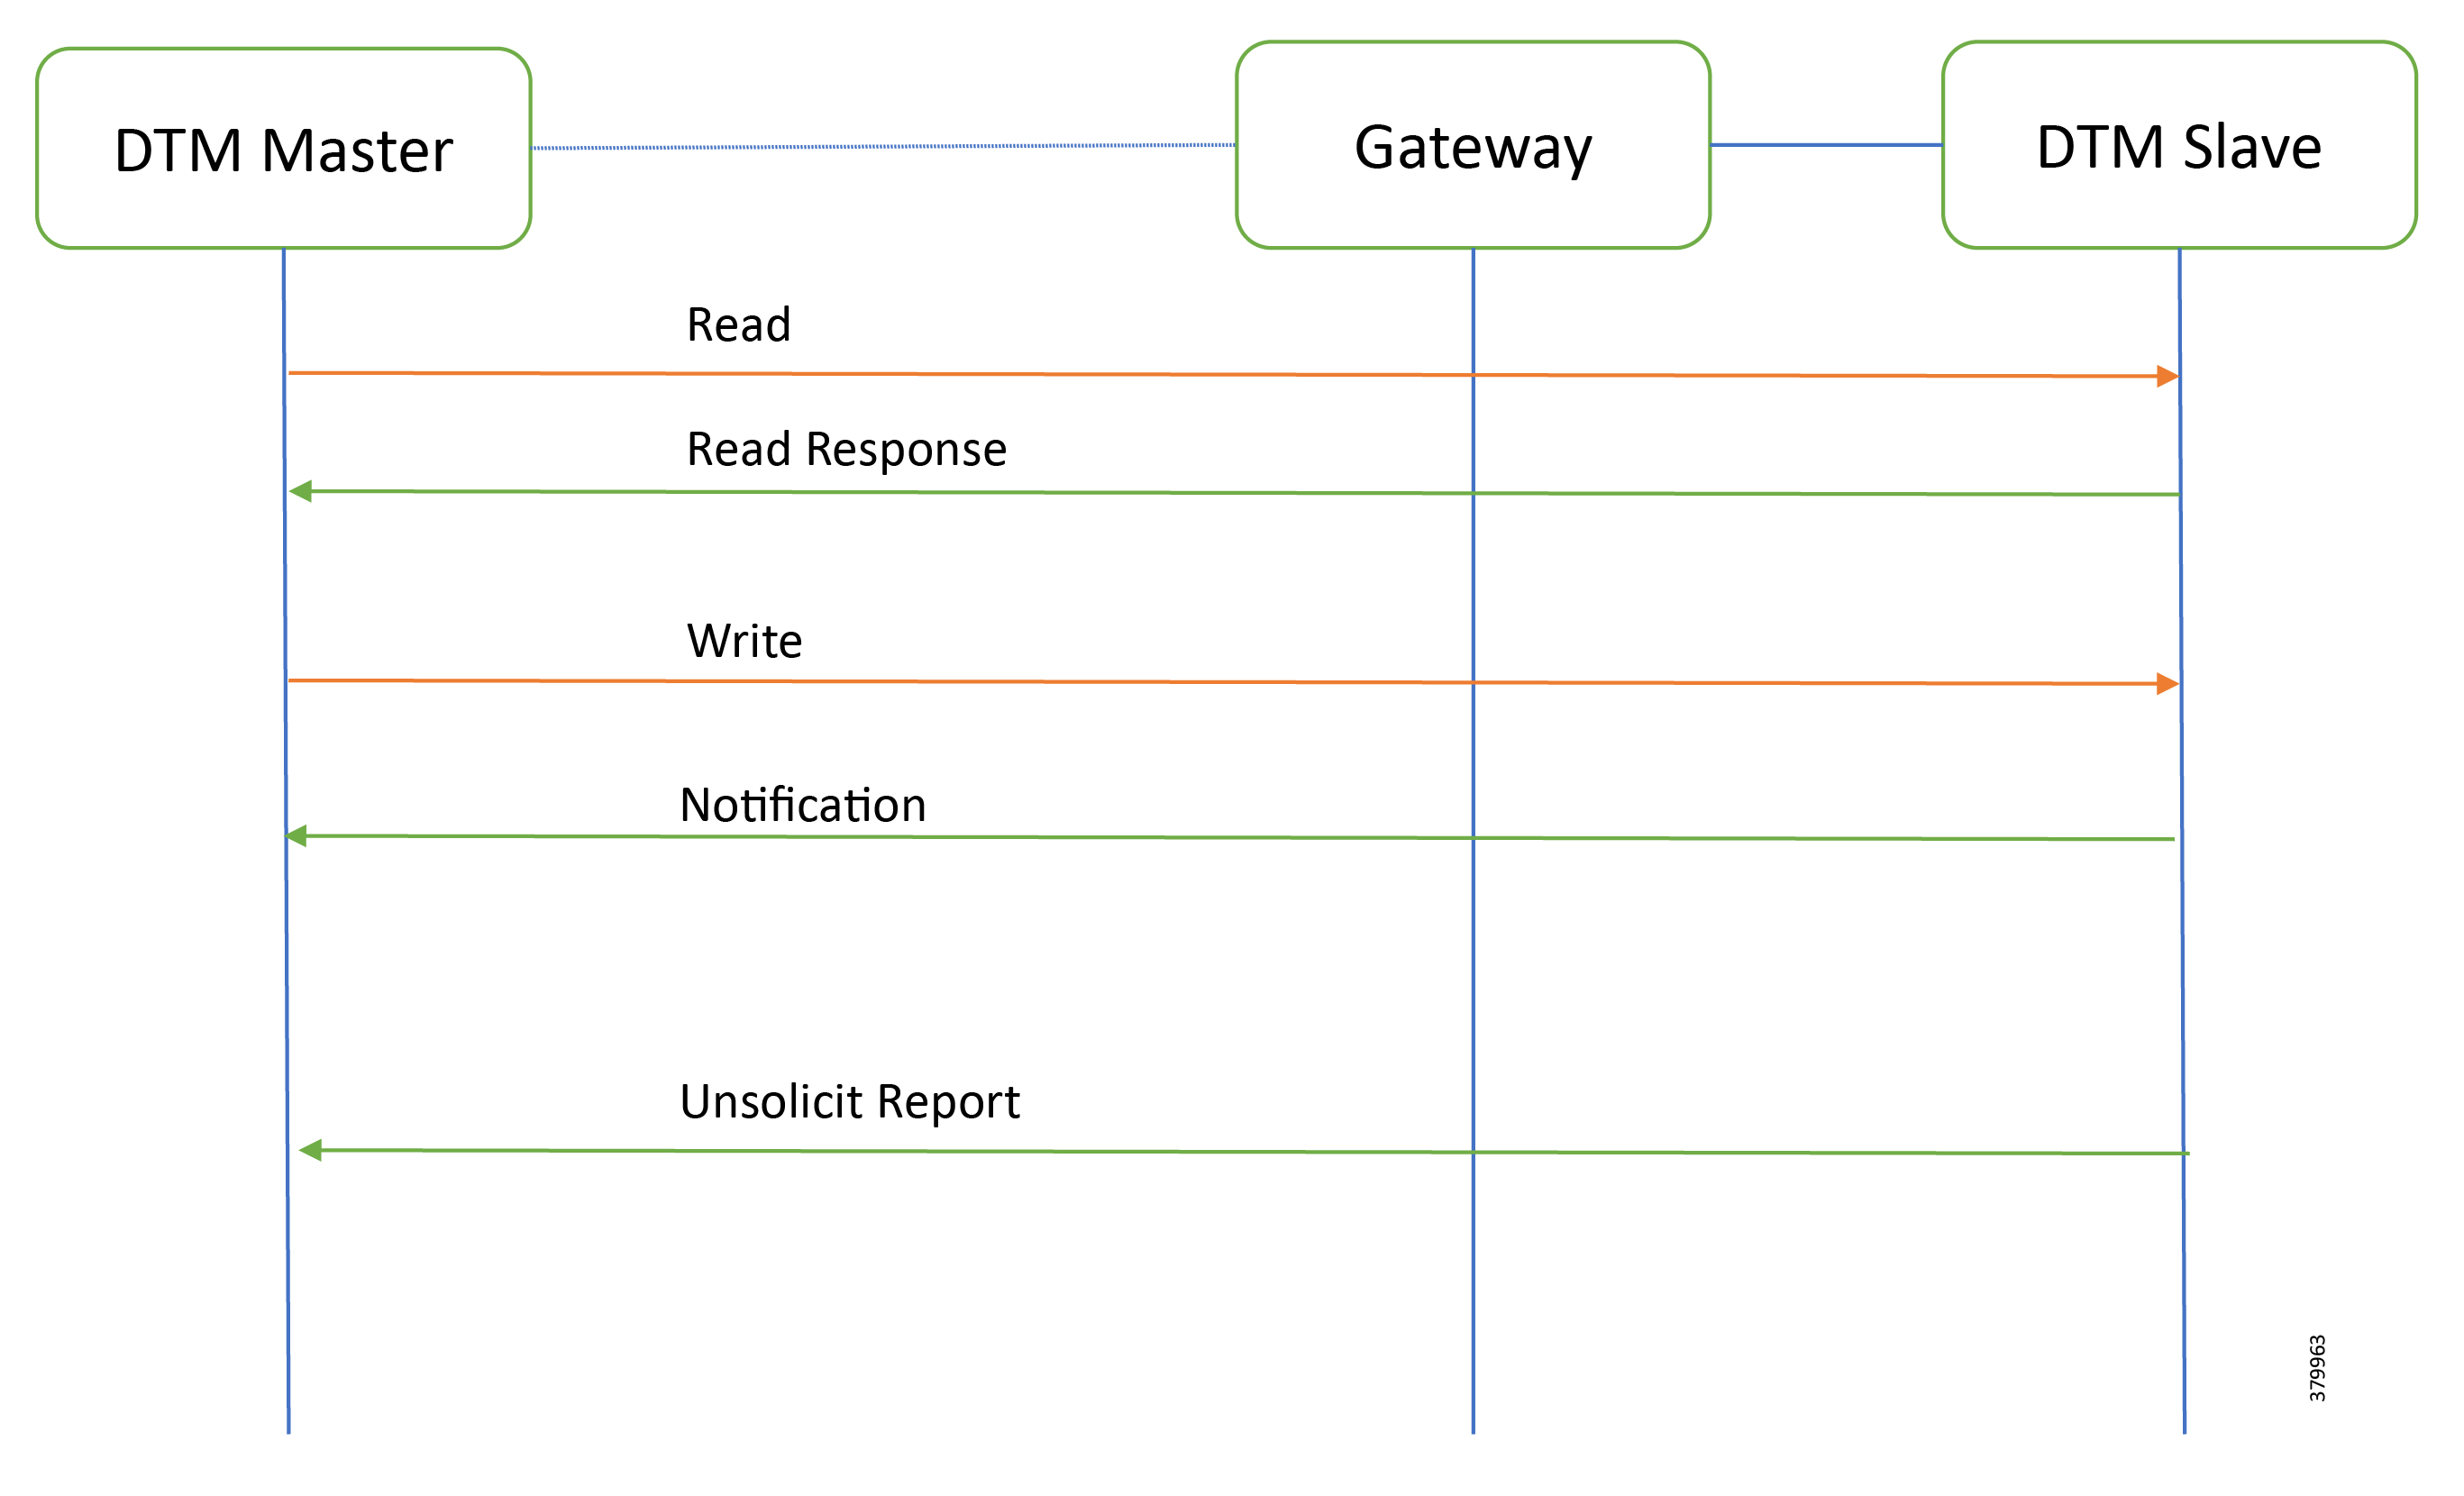
As shown in Figure 38, the SCADA Master DTM can perform a read and write operation to a remote Slave via the DA Gateway. The Slave can send the Report by Exception to the SCADA Master via DA Gateway over the IP network.
IR807 DA Gateway Configuration
SCADA Operations
The Master and the Slave can communicate via the network. Poll and Control operations are initiated from the Master. Report by Exception is sent to the Master from the Slave. Figure 39 and Figure 40 show the Poll operation from the SCADA Master. Similarly, Control and Report by Exception can also be seen on the Master Analyzer logs.
The Poll operation is performed by the Master. The Master can execute a general Poll in which all the register values are read and sent to the Master, a Poll on a set of registers or a Poll on a single register. In Figure 39 and Figure 40, we see a general Poll executed on the Slave side. Initially, the Master Analyzer is empty; however, when the General Interrogation command is executed, the values of all the registers are displayed on the Master Analyzer of DTM.
Figure 39 Master Analyzer Logs before Poll Operation

Figure 40 Master Analyzer Logs after Poll Operation
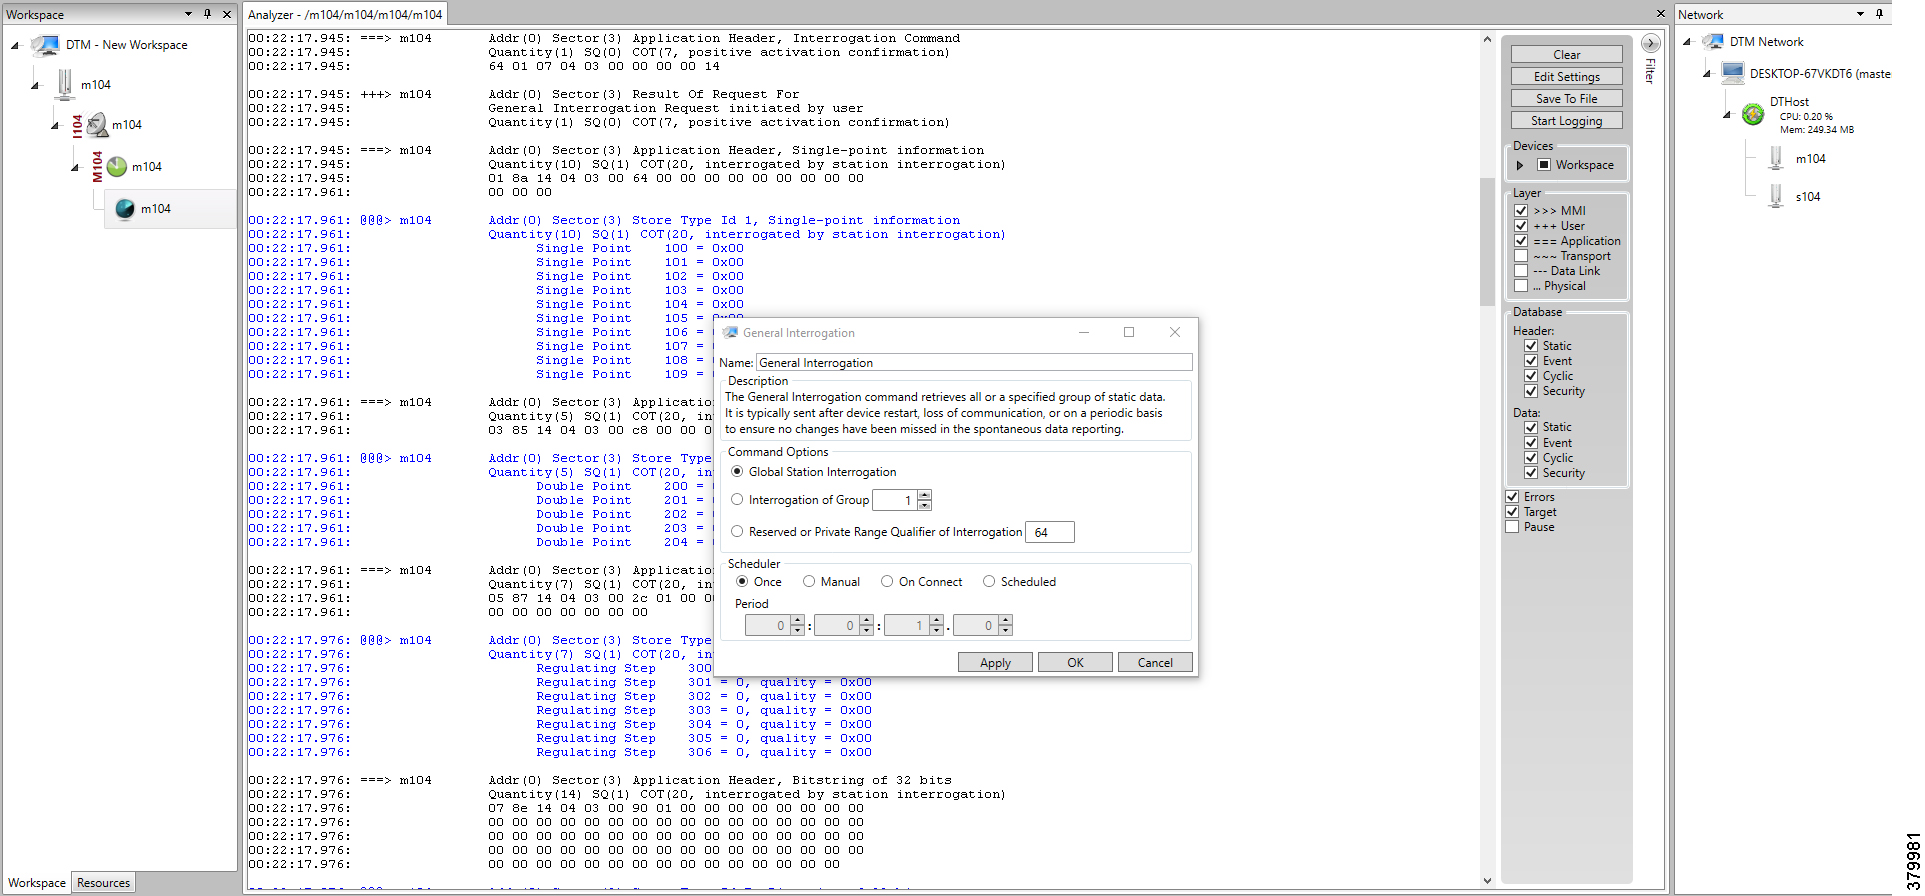
The Control operation basically sends the control command from the SCADA Master to SCADA Slave for the purpose of controlling the operation of end devices. The control command can be executed, and the results can be seen on the analyzer. The value of Double Point Register (#200) is changed and the same is reported to the Master. Figure 41, Figure 42, and Figure 43 show the Report by Exception sent to the Master for a particular register:
Figure 41 Slave Register before Control Operation

Figure 42 Master Control Control Operation
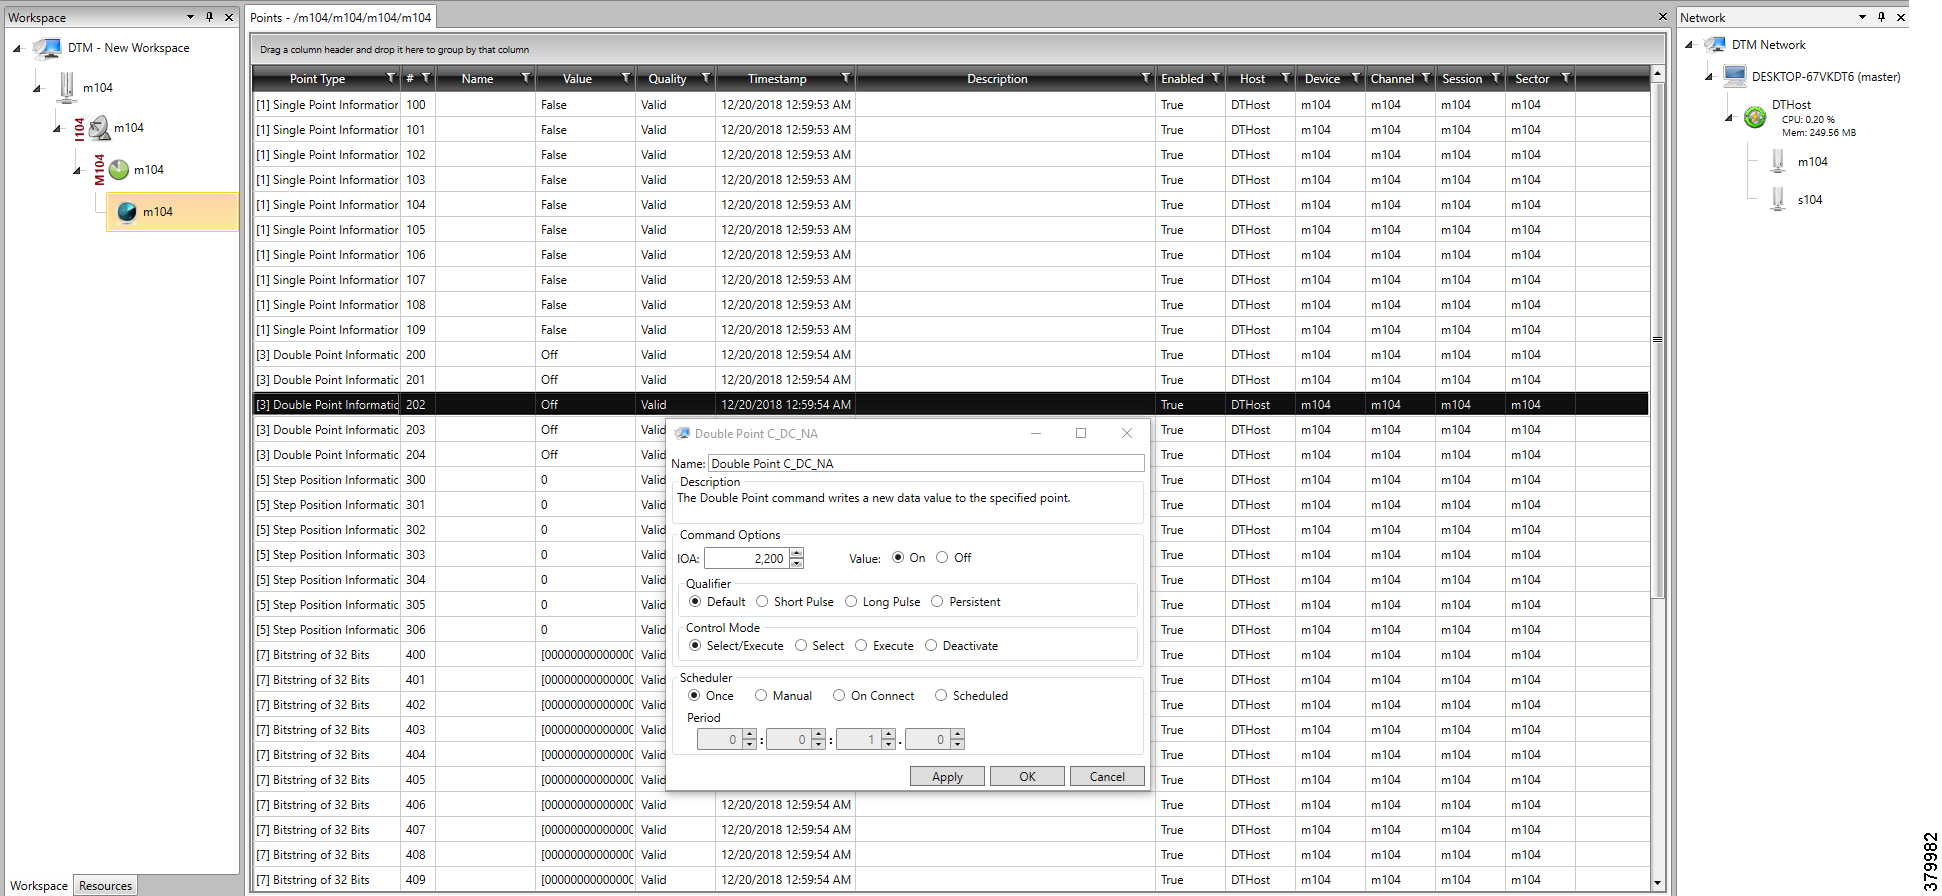
Figure 43 Slave Register after Control Operation
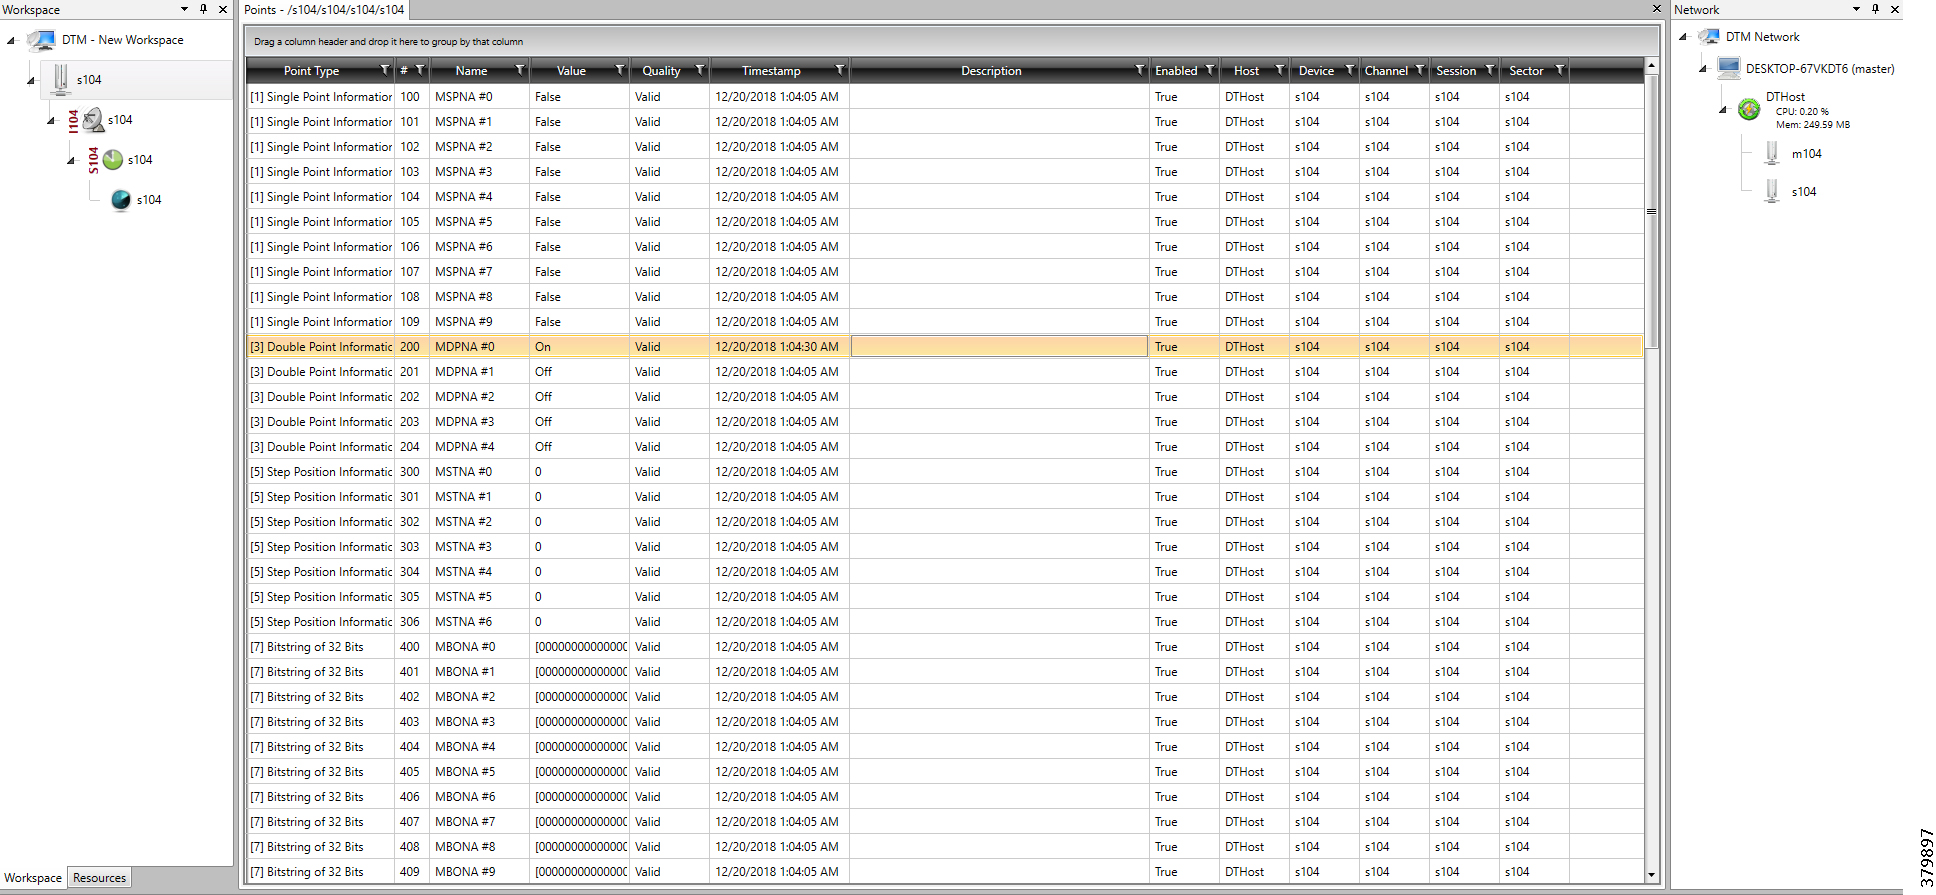
Report by Exception is initiated by the Slave, which is connected to the DA Gateway. Changes to the value of the Slave register changes are reported to the SCADA Master. This notification can be seen on the Master Analyzer of DTM software. Figure 44, Figure 45, Figure 46, and Figure 47 show the Report by Exception on the analyzer. The other operations such as Poll and Control can be executed, and the results can be seen on the analyzer. The value of Double Point Register (#200) is changed and the same is reported to the Master. Figure 44, Figure 45, Figure 46, and Figure 47 how the Report by Exception sent to the Master for a particular register:


Figure 46 Change in Slave Register Value

Legacy SCADA (Raw-Socket TCP)
Protocol Validated
The protocol we have validated for this release is IEC 60870-5-101.
Flow Diagram
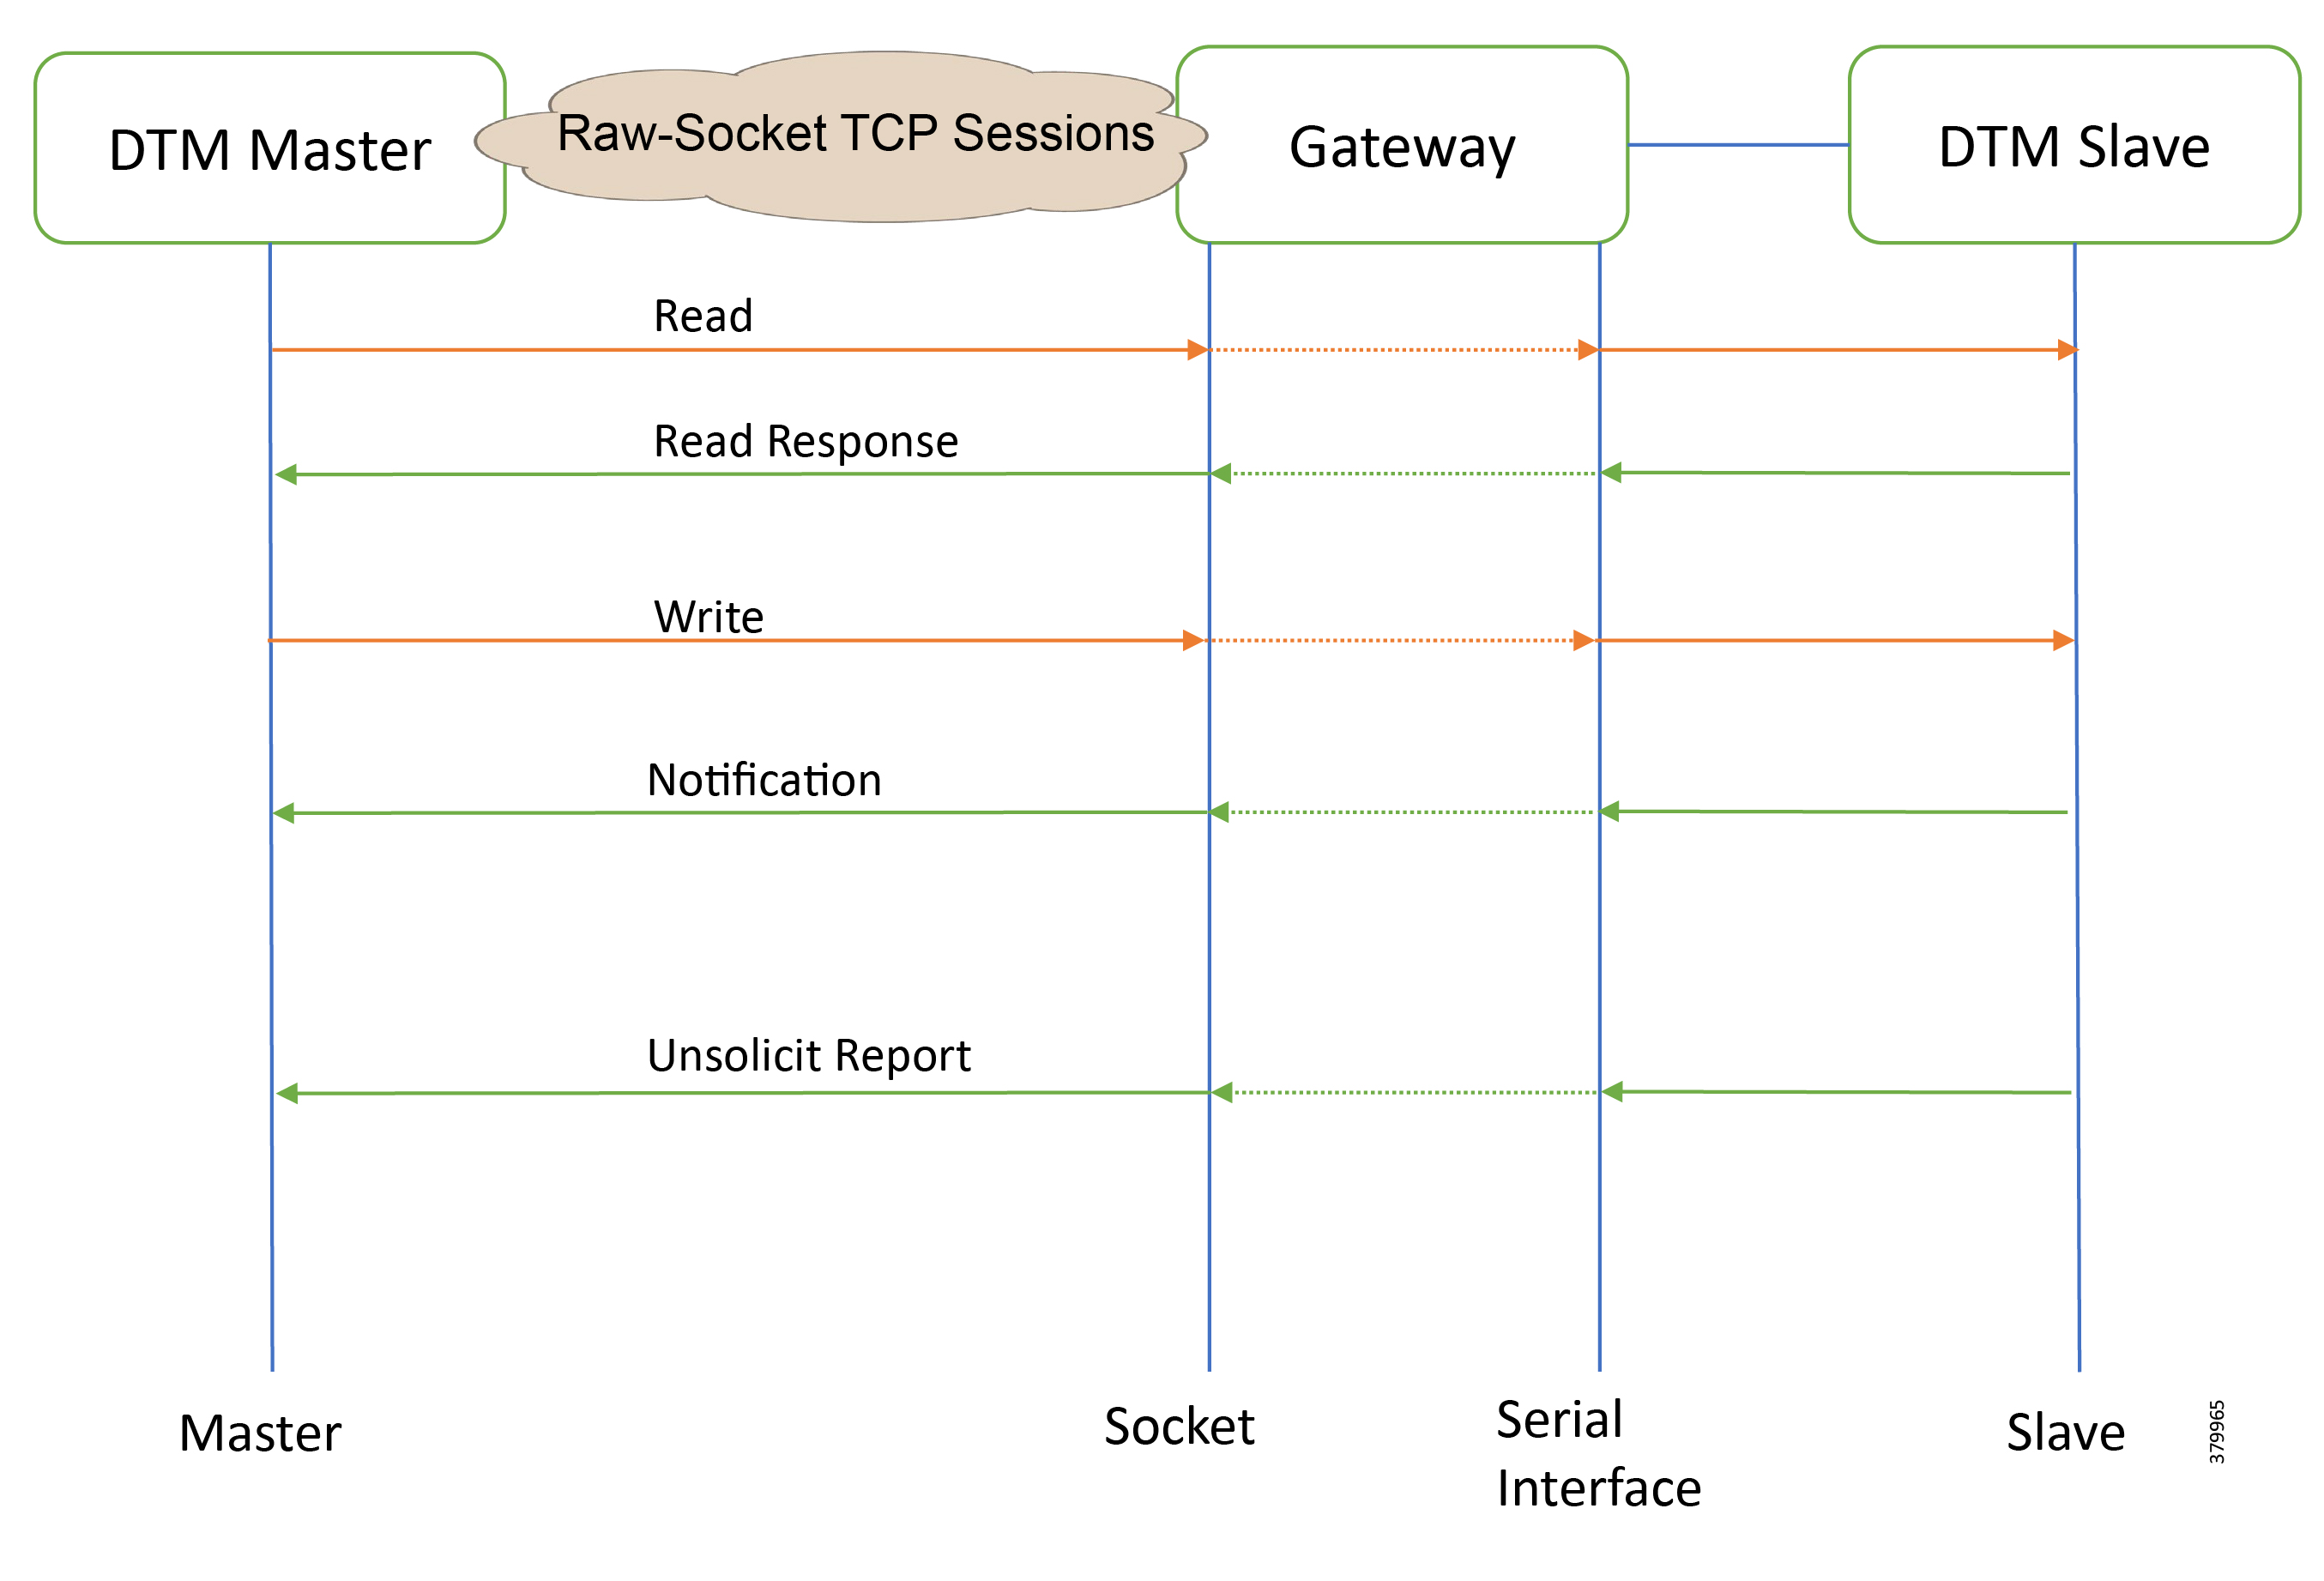
As shown in Figure 47, the DTM Master can read and write the Slave via the DA Gateway using TCP Raw Socket. And the Slave can send the Report by Exception to the Master via the DA Gateway using TCP Raw-Socket. For more details about Raw Socket, refer to the Distribution Automation - Secondary Substation Design Guide.
IR807 DA Gateway Raw Socket Configuration
IR1101 DA Gateway Raw Socket Configuration
SCADA Operations
The Master and the Slave can communicate via the network. Poll and Control operations are initiated from the Master. Report by Exception is sent to the Master from the Slave. Figure 48 and Figure 49 show the Poll operation from the SCADA-Master. Similarly, Control and Report by Exception can also be seen on the Master Analyzer logs.
The Poll operation is performed by the Master. The Master can execute a general Poll in which all the register values are read and sent to the Master, a Poll on a set of registers or a Poll on a single register. In Figure 48 and Figure 49, we see a general Poll executed on the Slave side. Initially, the Master Analyzer is empty; however, when the General Interrogation command is executed, the values of all the registers are displayed on the Master Analyzer of DTM.
Figure 48 Master Analyzer Logs before Poll Operation

Figure 49 Master Analyzer Logs after Poll Operation

The control operation basically sends the control command from the SCADA Master to SCADA Slave for the purpose of controlling the operation of end devices. The control command can be executed and the results can be seen on the analyzer. The value of Double Point Register (#200) is changed and the same is reported to the Master. Figure 50, Figure 51, and Figure 52 show the Report by Exception sent to the Master for a particular register:
Figure 50 Slave Register before Control Operation
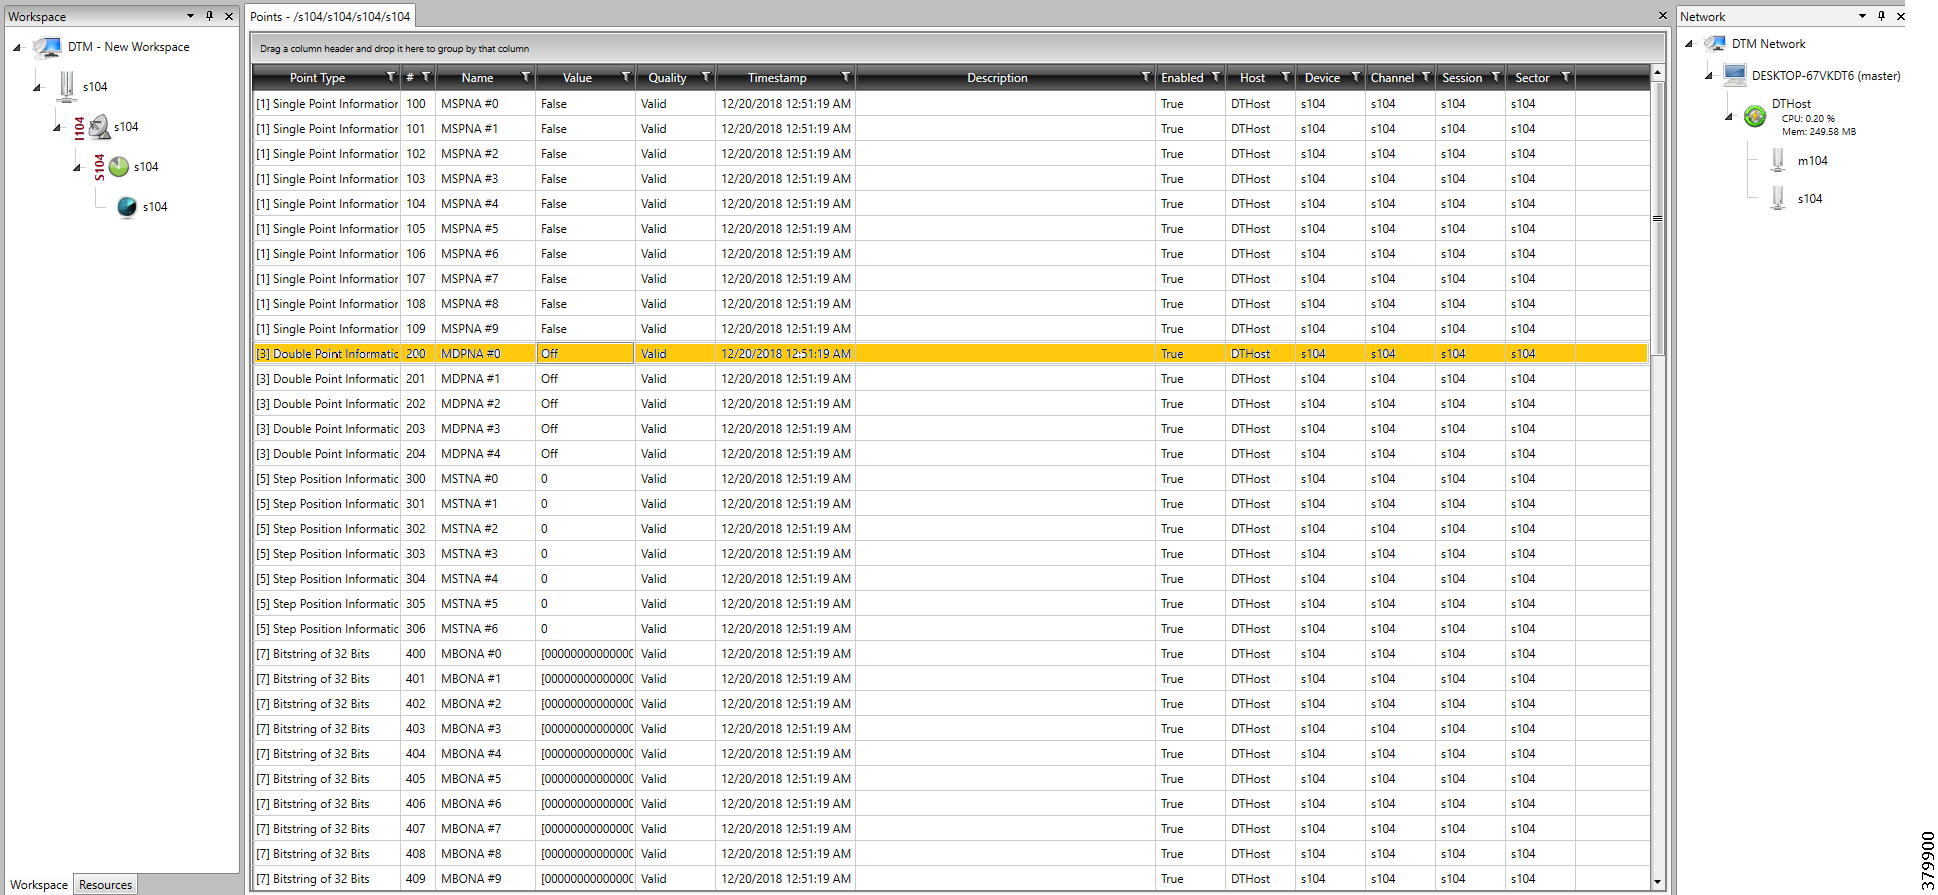
Figure 51 Master Control Control Operation
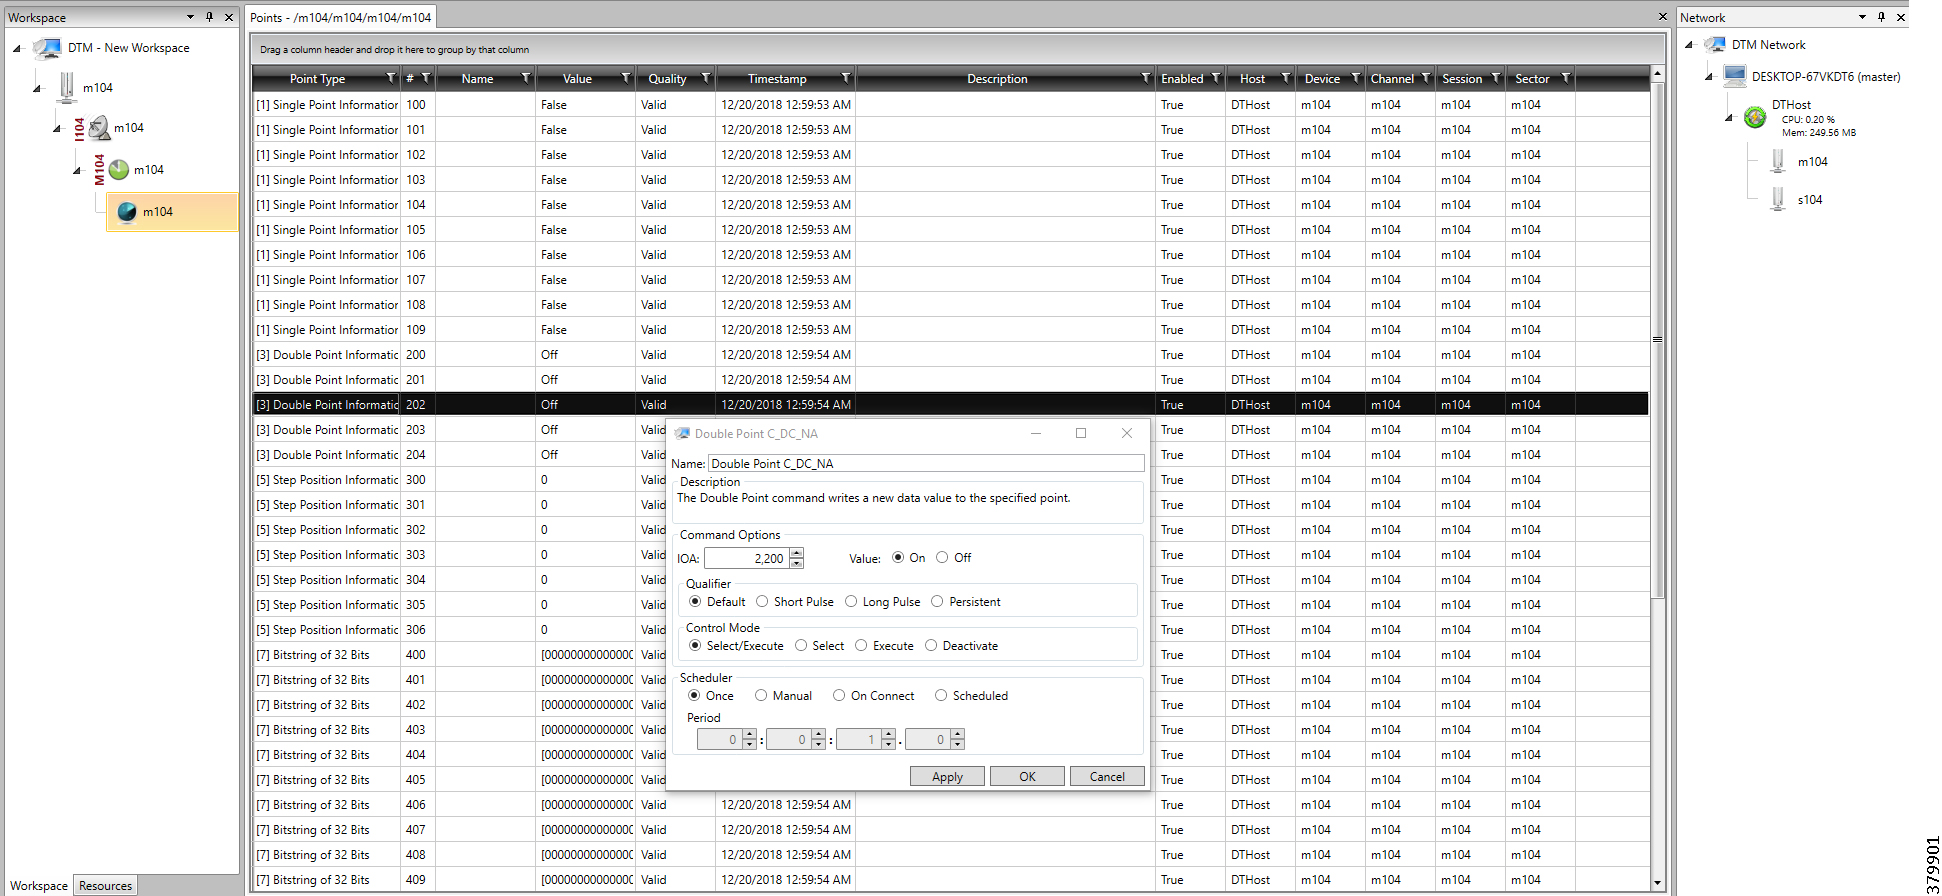
Figure 52 Slave Register after Control Operation

Report by Exception is initiated by the Slave, which is connected to the DA Gateway. Changes to the value of the Slave register changes are reported to SCADA-Master. This notification can be seen on the Master Analyzer of DTM software. Figure 53, Figure 54, Figure 55, and Figure 56 show the Report by Exception on the analyzer. The other operations such as Poll and Control can be executed, and the results can be seen on the analyzer. The value of Double Point Register (#200) is changed and the same is reported to the Master. Figure 53, Figure 54, Figure 55, and Figure 56 show the Report by Exception sent to the Master for a particular register:

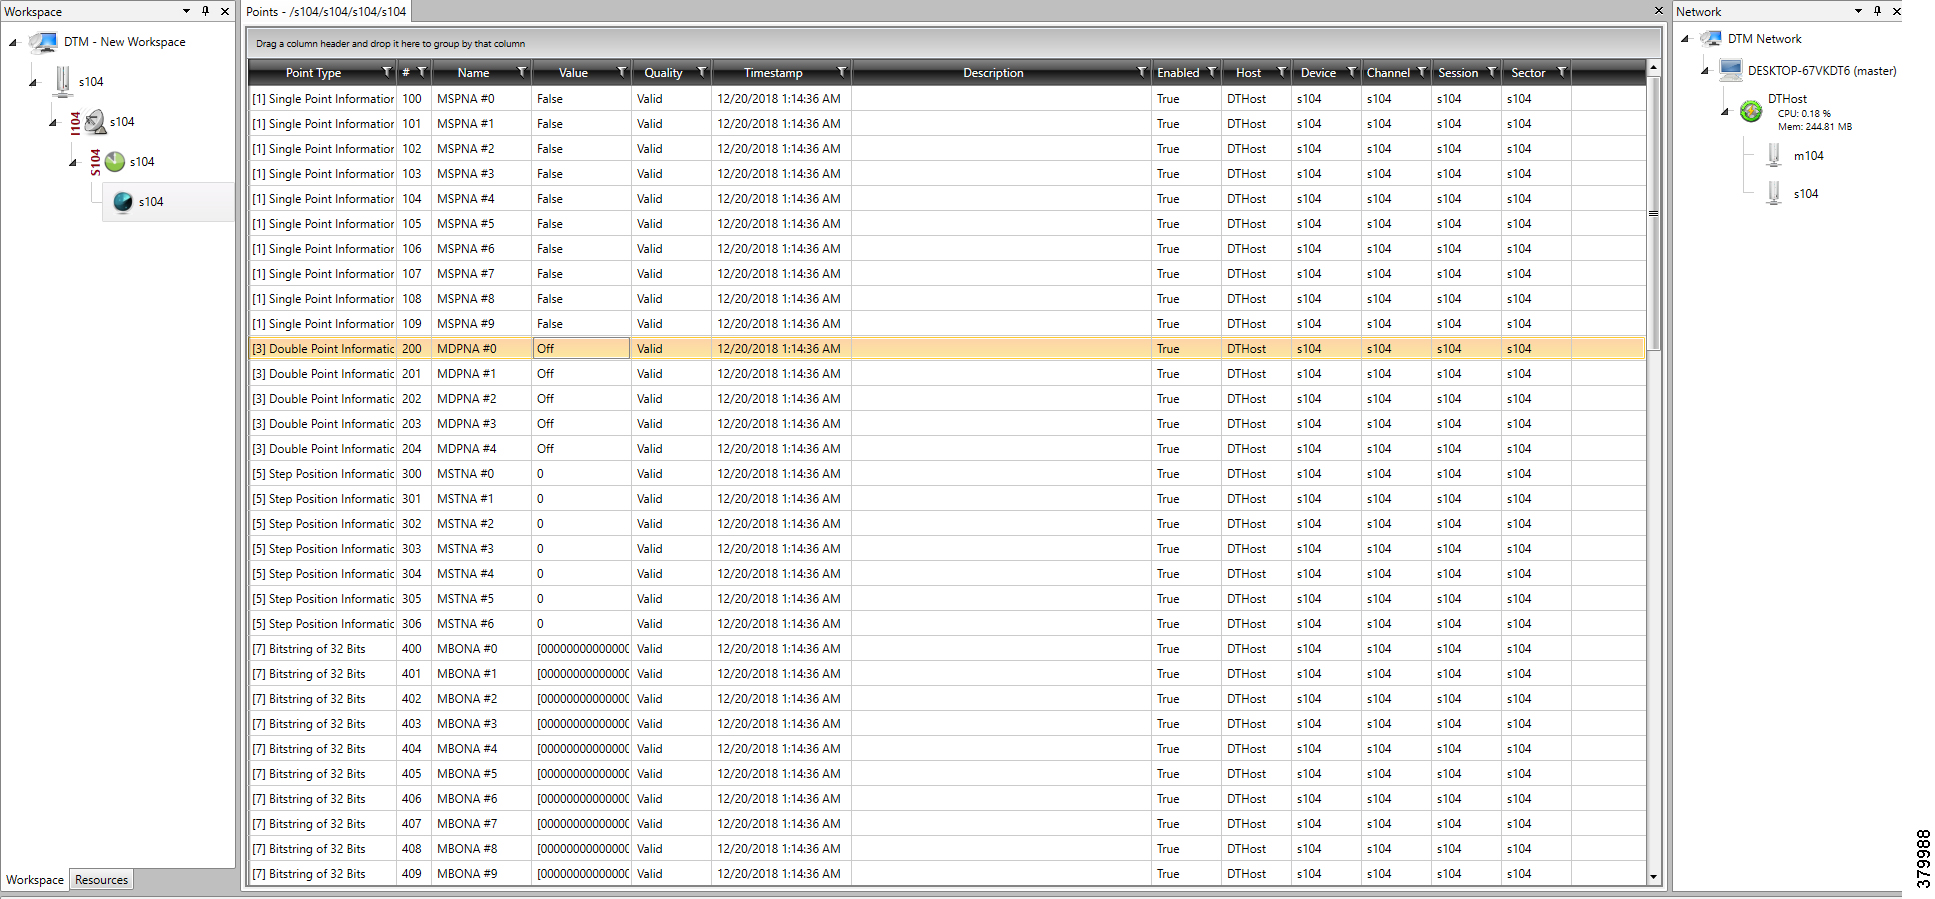
Figure 55 Change in Slave Register Value

Figure 56 Master Analyzer after Change in Register Value

SCADA Gateway
Protocol Validated
The protocol we have validated for this release is IEC 60870-5-101 and IEC 60870-5-104.
Flow Diagram
Figure 57 T101 to T104 Protocol Translation Control Flow
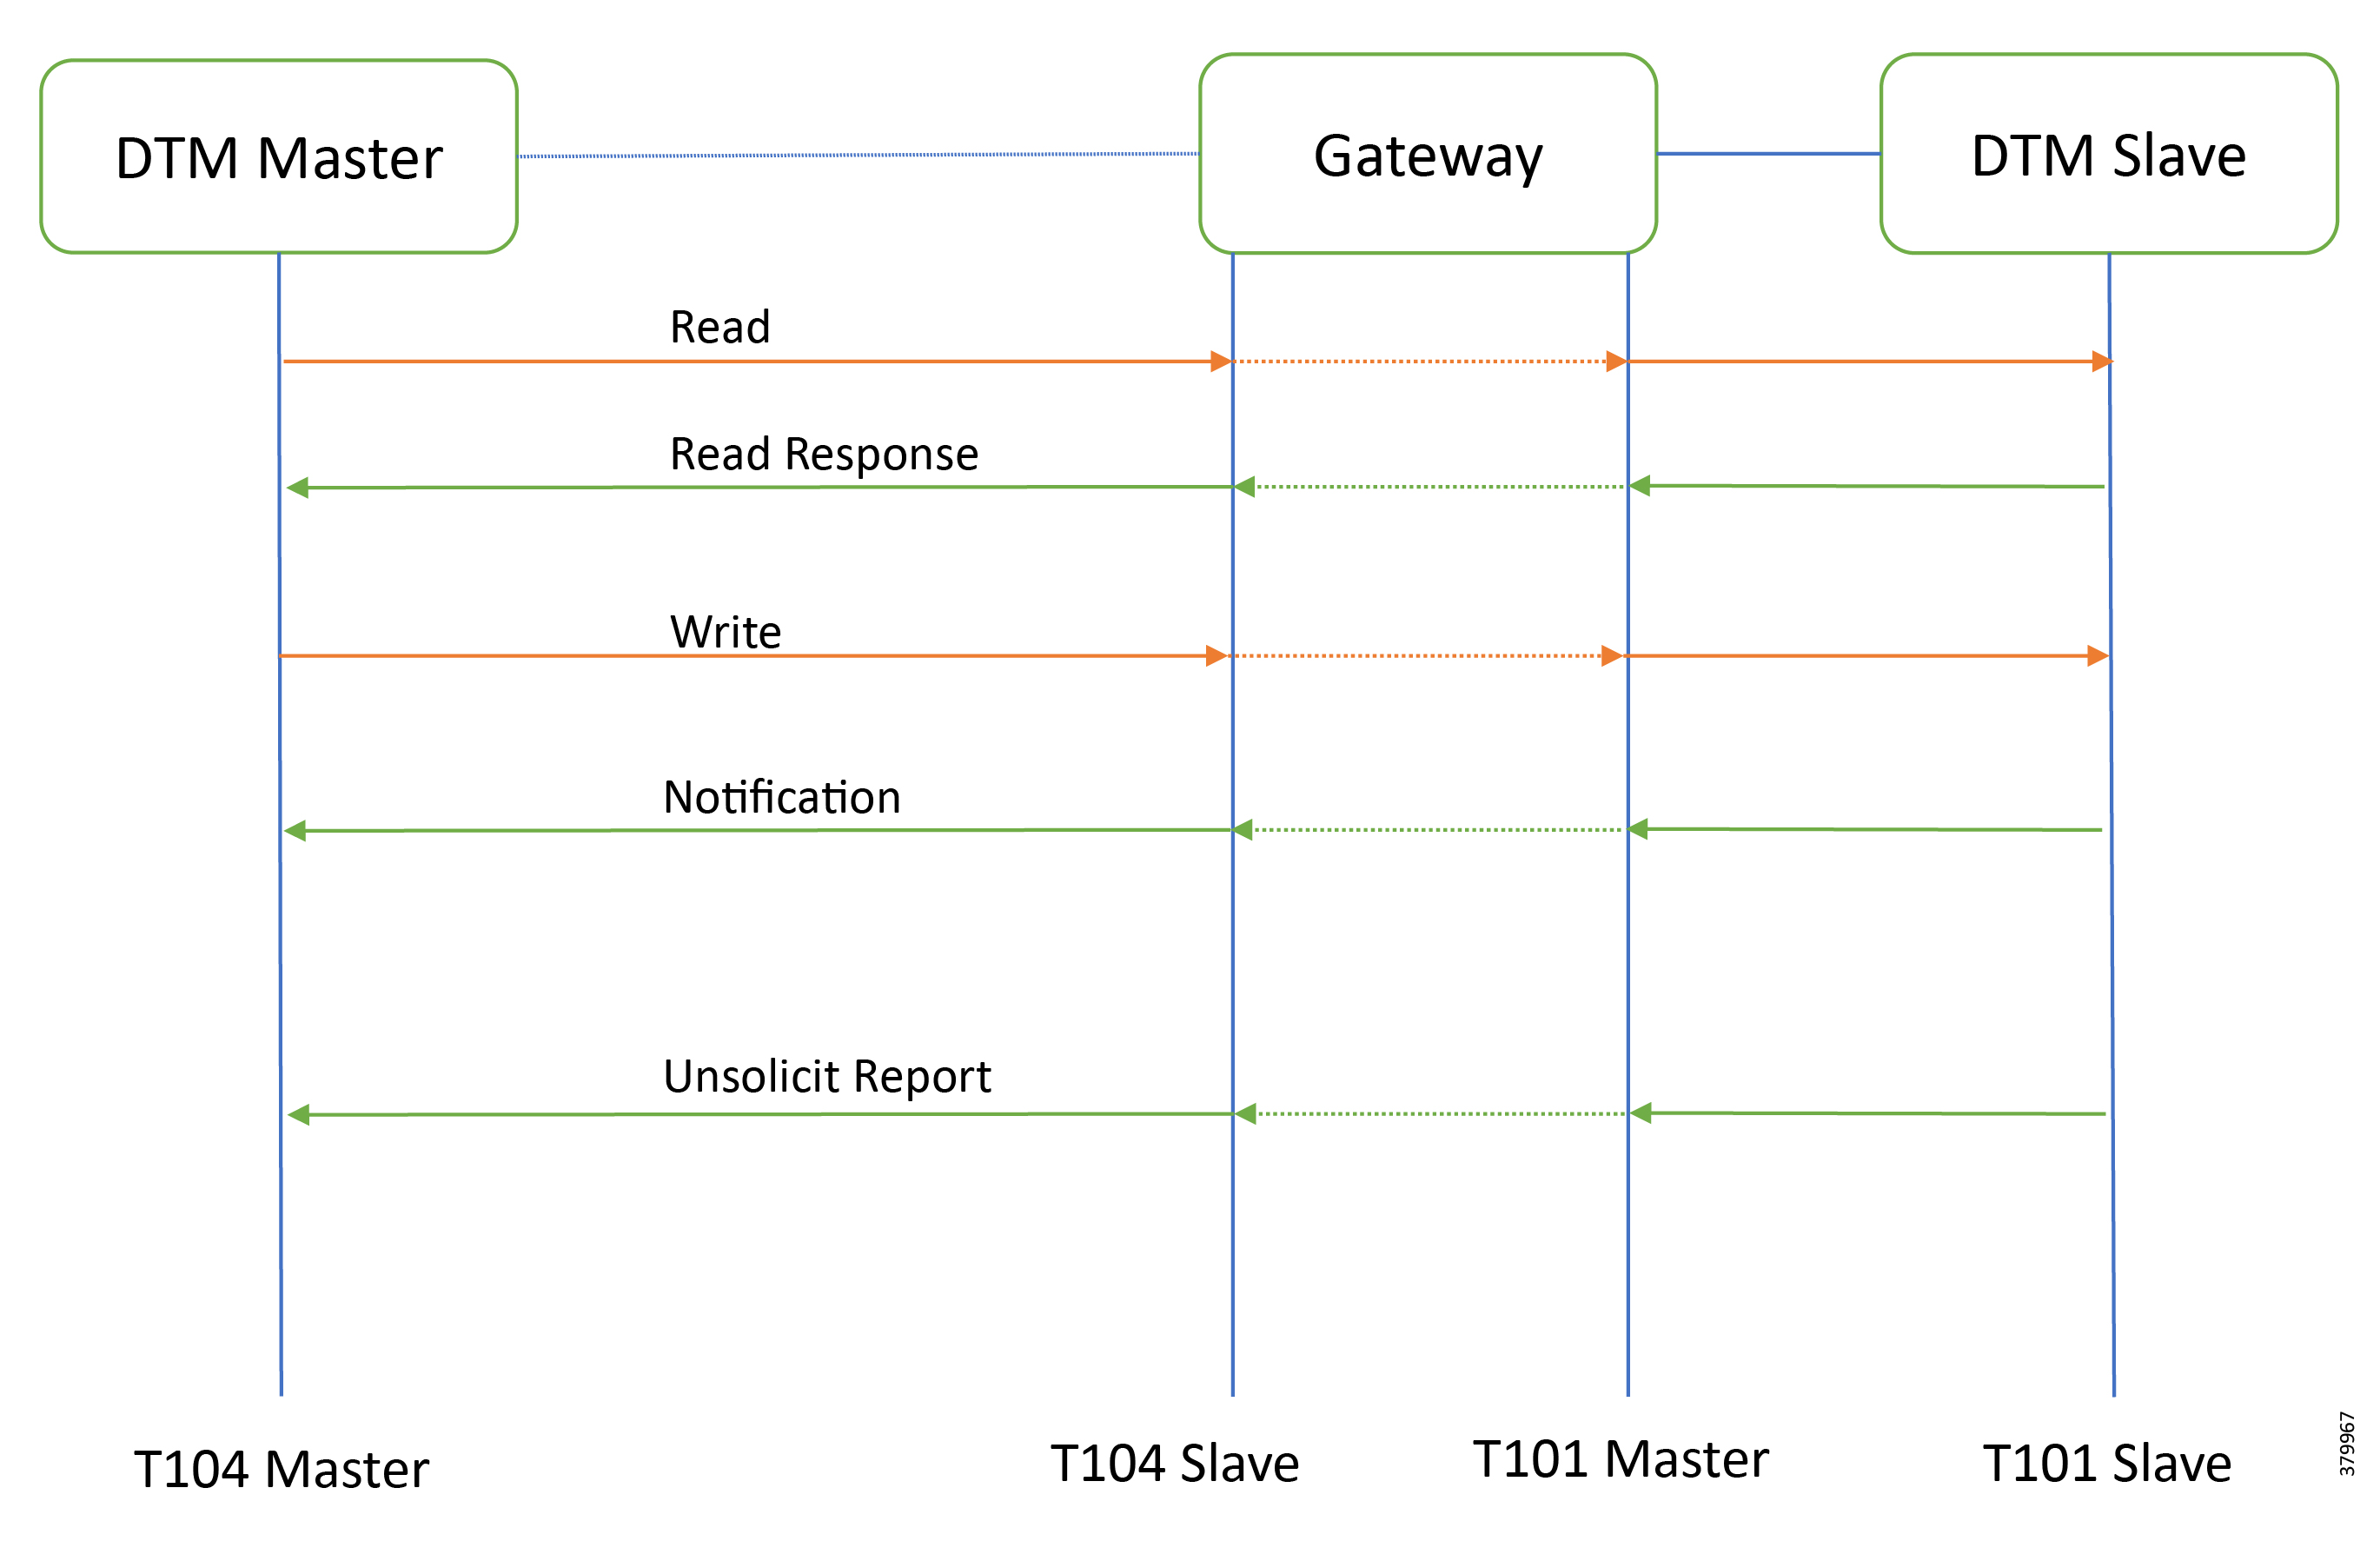
As shown in Figure 57, the DTM Master can read and write the Slave via the DA Gateway using protocol translation. The Slave can send the Report by Exception to the Master via the DA Gateway using protocol translation.
IR807 SCADA Gateway Configuration
IR1101 SCADA Gateway Configuration
SCADA Operations
The Master and the Slave can communicate via the network. Poll and Control operations are initiated from the Master. Report by Exception is sent to the Master from the Slave. Figure 59 and Figure 60 show the Poll operation from SCADA-Master. Similarly, Control and Report by Exception can also be seen on the Master Analyzer logs.
The Poll operation is performed by the Master. The Master can execute a general Poll in which all the register values are read and sent to the Master, a Poll on a set of registers, or a Poll on a single register. In Figure 59 and Figure 60, we see a general Poll executed on the Slave side. Initially the Master Analyzer is empty; however, when the General Interrogation command is executed, the values of all the registers are displayed on the Master Analyzer of DTM.
Figure 58 Master Analyzer Logs before Poll Operation
Figure 59 Master Analyzer Logs after Poll Operation

The control operation basically sends the control command from the SCADA Master to SCADA Slave for the purpose of controlling the operation of end devices. The control command can be executed and the results can be seen on the analyzer. The value of Double Point Register (#200) is changed and the same is reported to the Master. Figure 60, Figure 61, and Figure 62 show the Report by Exception sent to the Master for a particular register:
Figure 60 Slave Register before Control Operation

Figure 61 Master Control Control Operation

Figure 62 Slave Register after Control Operation

Report by Exception is initiated by the Slave, which is connected to the DA Gateway. Changes to the value of the Slave register are reported to SCADA-Master. This notification can be seen on the Master Analyzer of DTM software. Figure 63, Figure 64, Figure 65, and Figure 66 show the Report by Exception on the analyzer. The other operations such as Poll and Control can be executed, and the results can be seen on the analyzer. The value of Double Point Register (#200) is changed and the same is reported to the Master. Figure 63, Figure 64, Figure 65, and Figure 66show the Report by Exception sent to the Master for a particular register:


Figure 65 Change in Slave Register Value
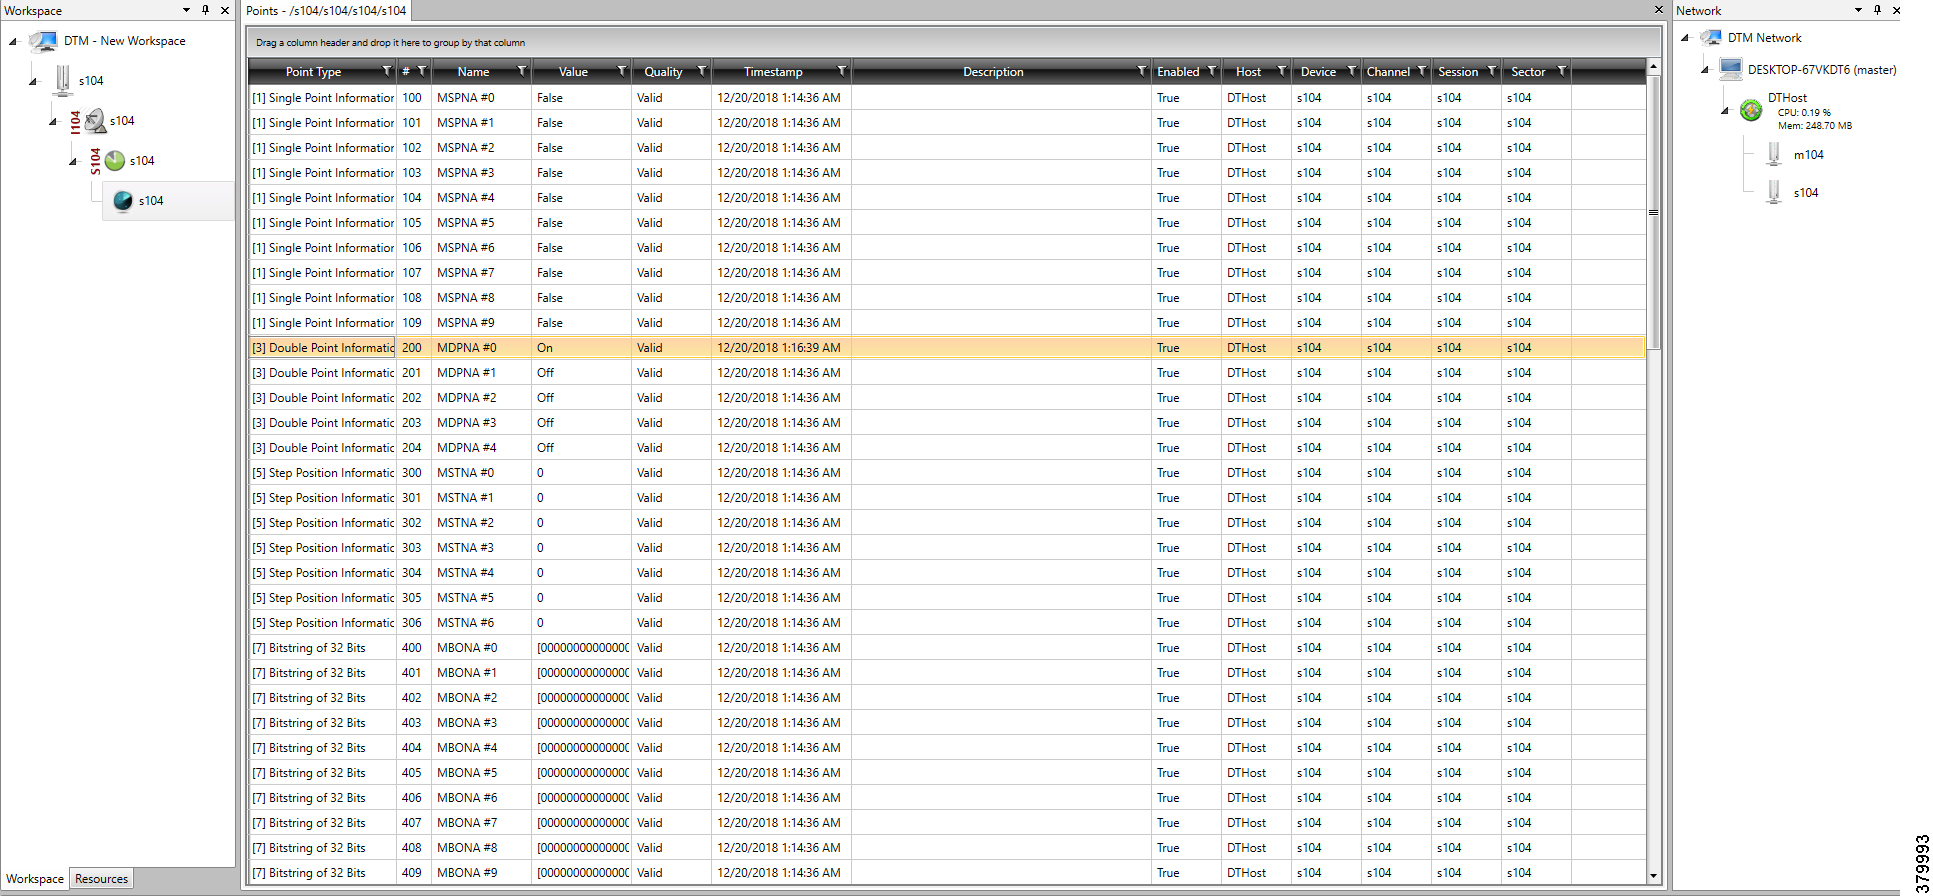
Figure 66 Master Analyzer after Change in Register Value

Dual Control Center
When a Slave is connected to the DA Gateway via the serial or Ethernet port, then the Master and the Slave can communicate using the T104 or T101 protocol to the dual Control Center. The communication between the Slave and Master can be Ethernet based (T104) or RS232 serial communication (T101) or by means of protocol translation.
Operations that can be executed when the communication protocol is T104 or T101 or T101- T104 translation are as follows:
■![]() Report by Exception (Slave > Master) - Notification
Report by Exception (Slave > Master) - Notification
The operations have been executed using a SCADA simulator known as DTM, which has the capability of simulating both Master and the Slave device.
Implementation Overview
This document focuses on SCADA protocols such as T101 and T104 and the T101-T104 translation protocols widely used in the Europe Region with Primary and Secondary DSO Control Centers.
Topology Diagram
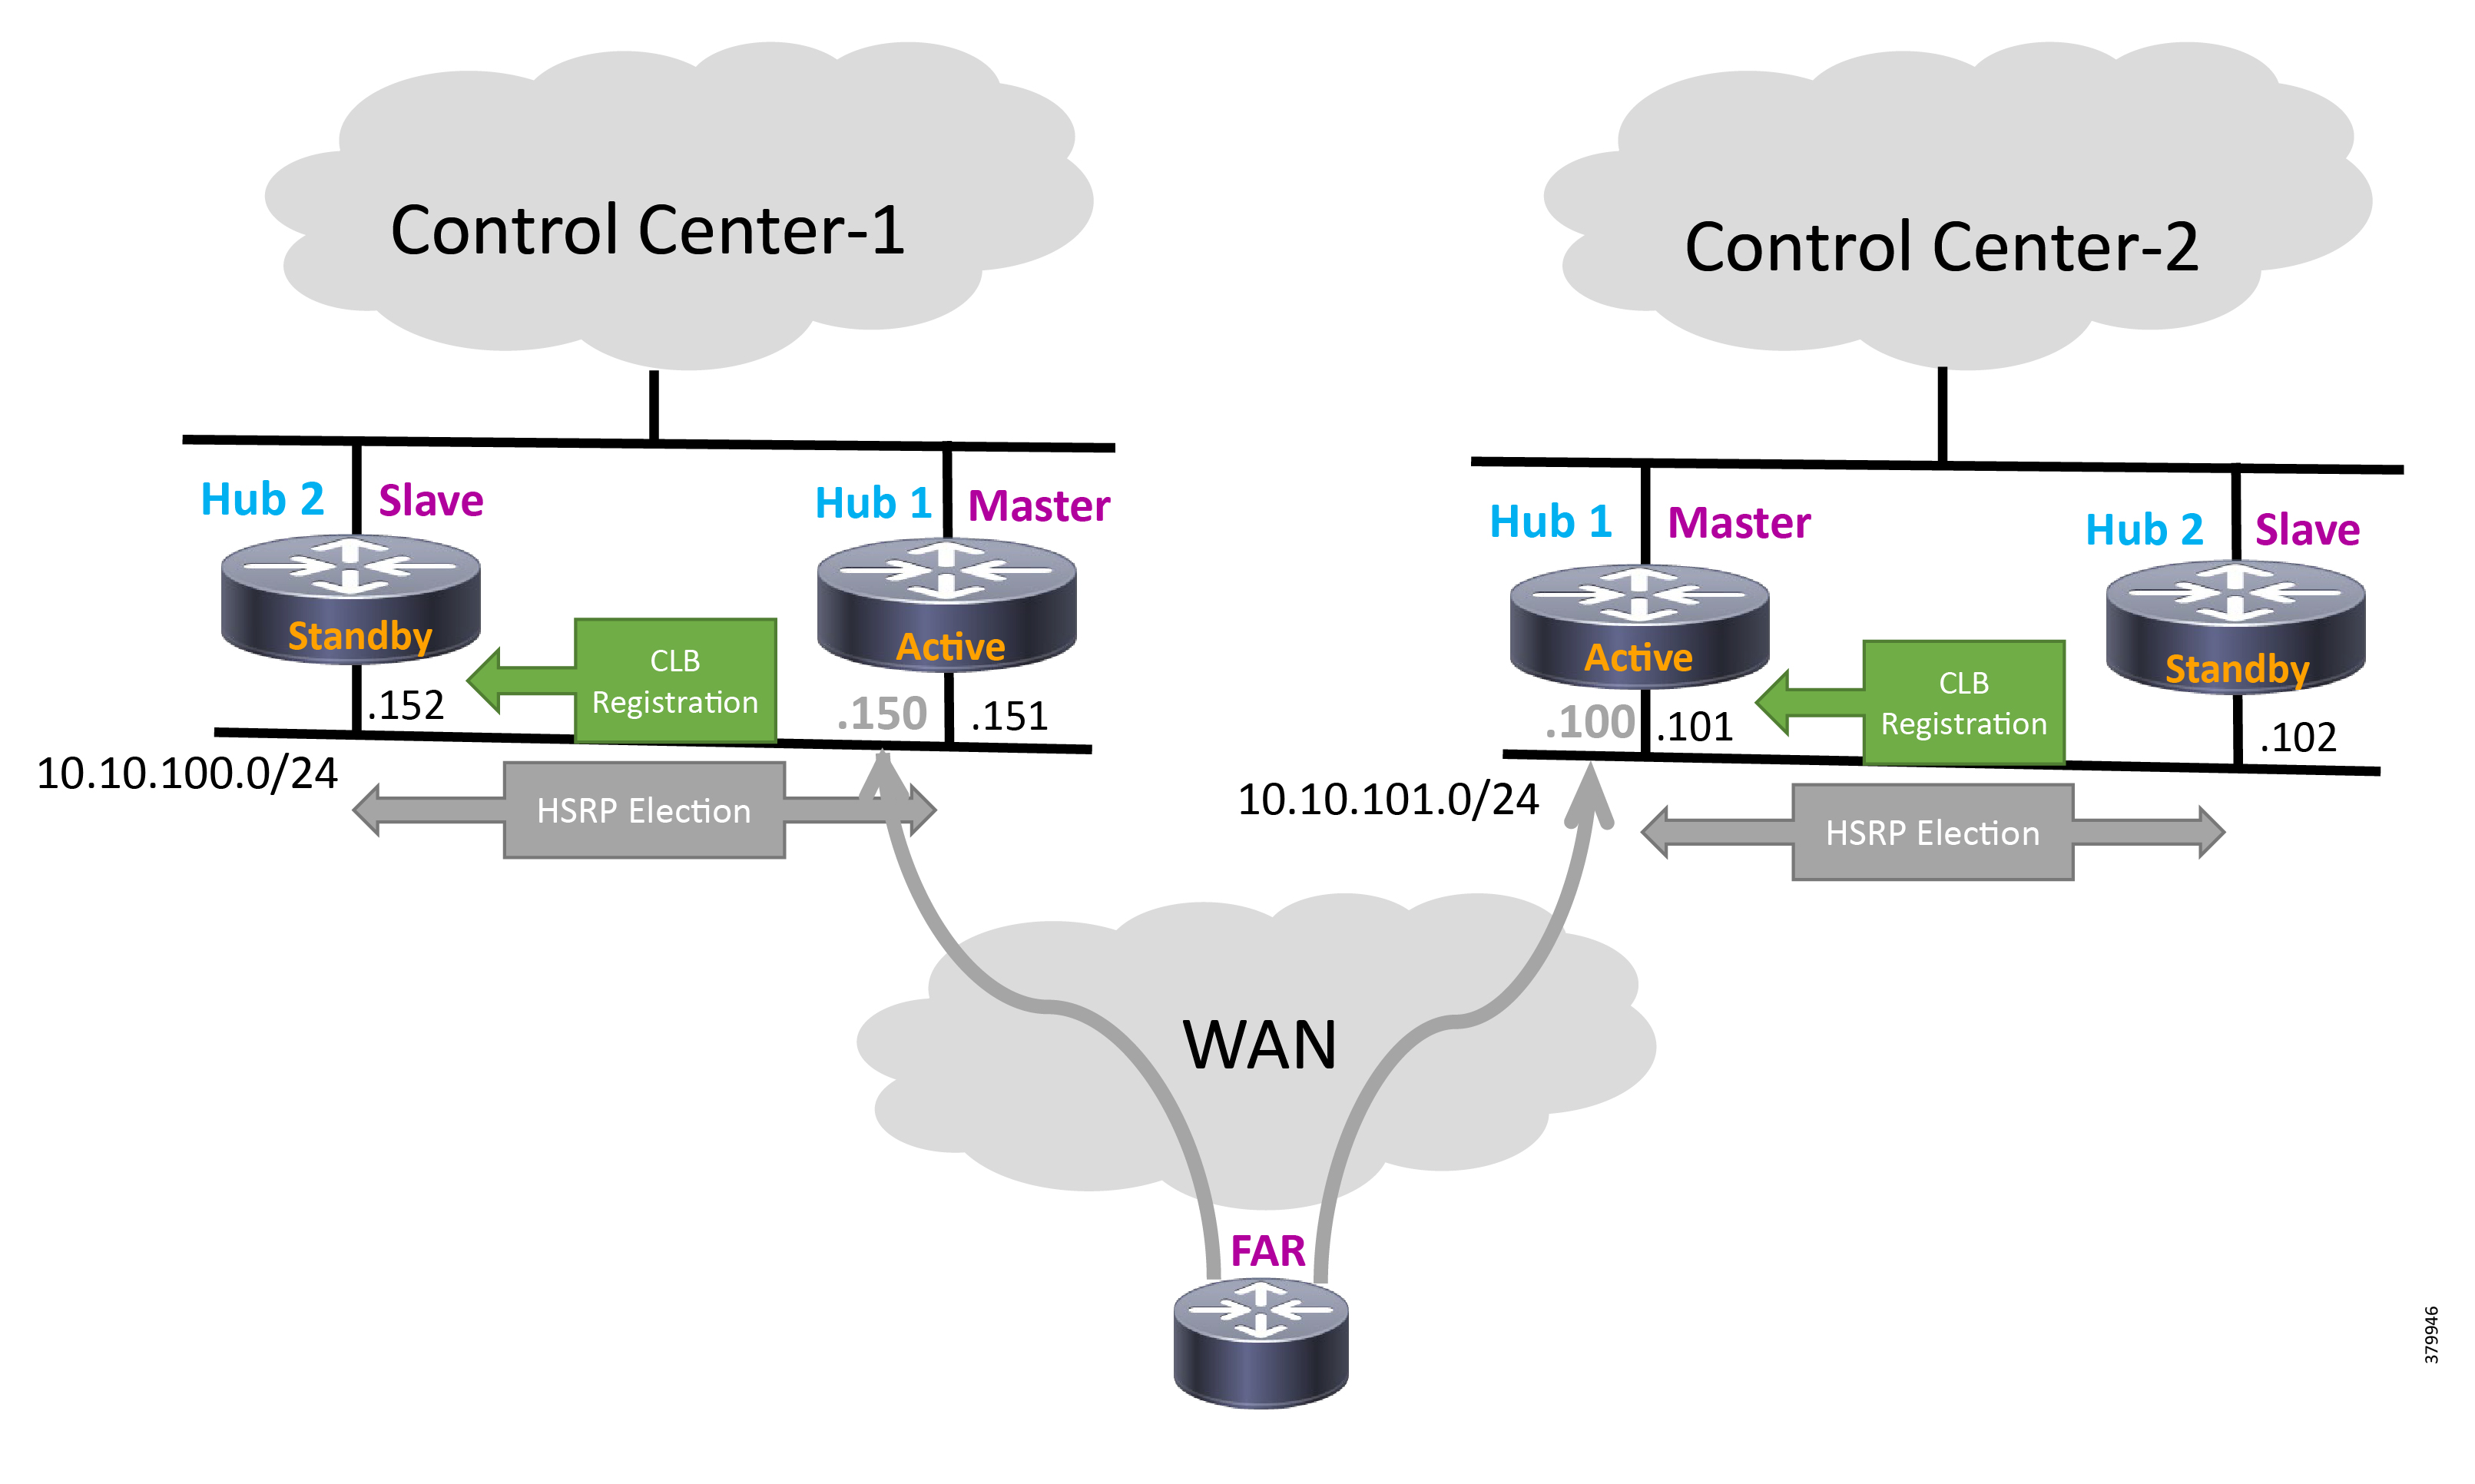
IP-Based SCADA
Protocol Validated
The protocol we have validated for this release is IEC 60870-5-104.
Flow Diagram
As shown in Figure 68, both the DTM Master can read and write the Slave via the DA Gateway, and the Slave can send the Report by Exception to both Master via the DA Gateway over the IP network:
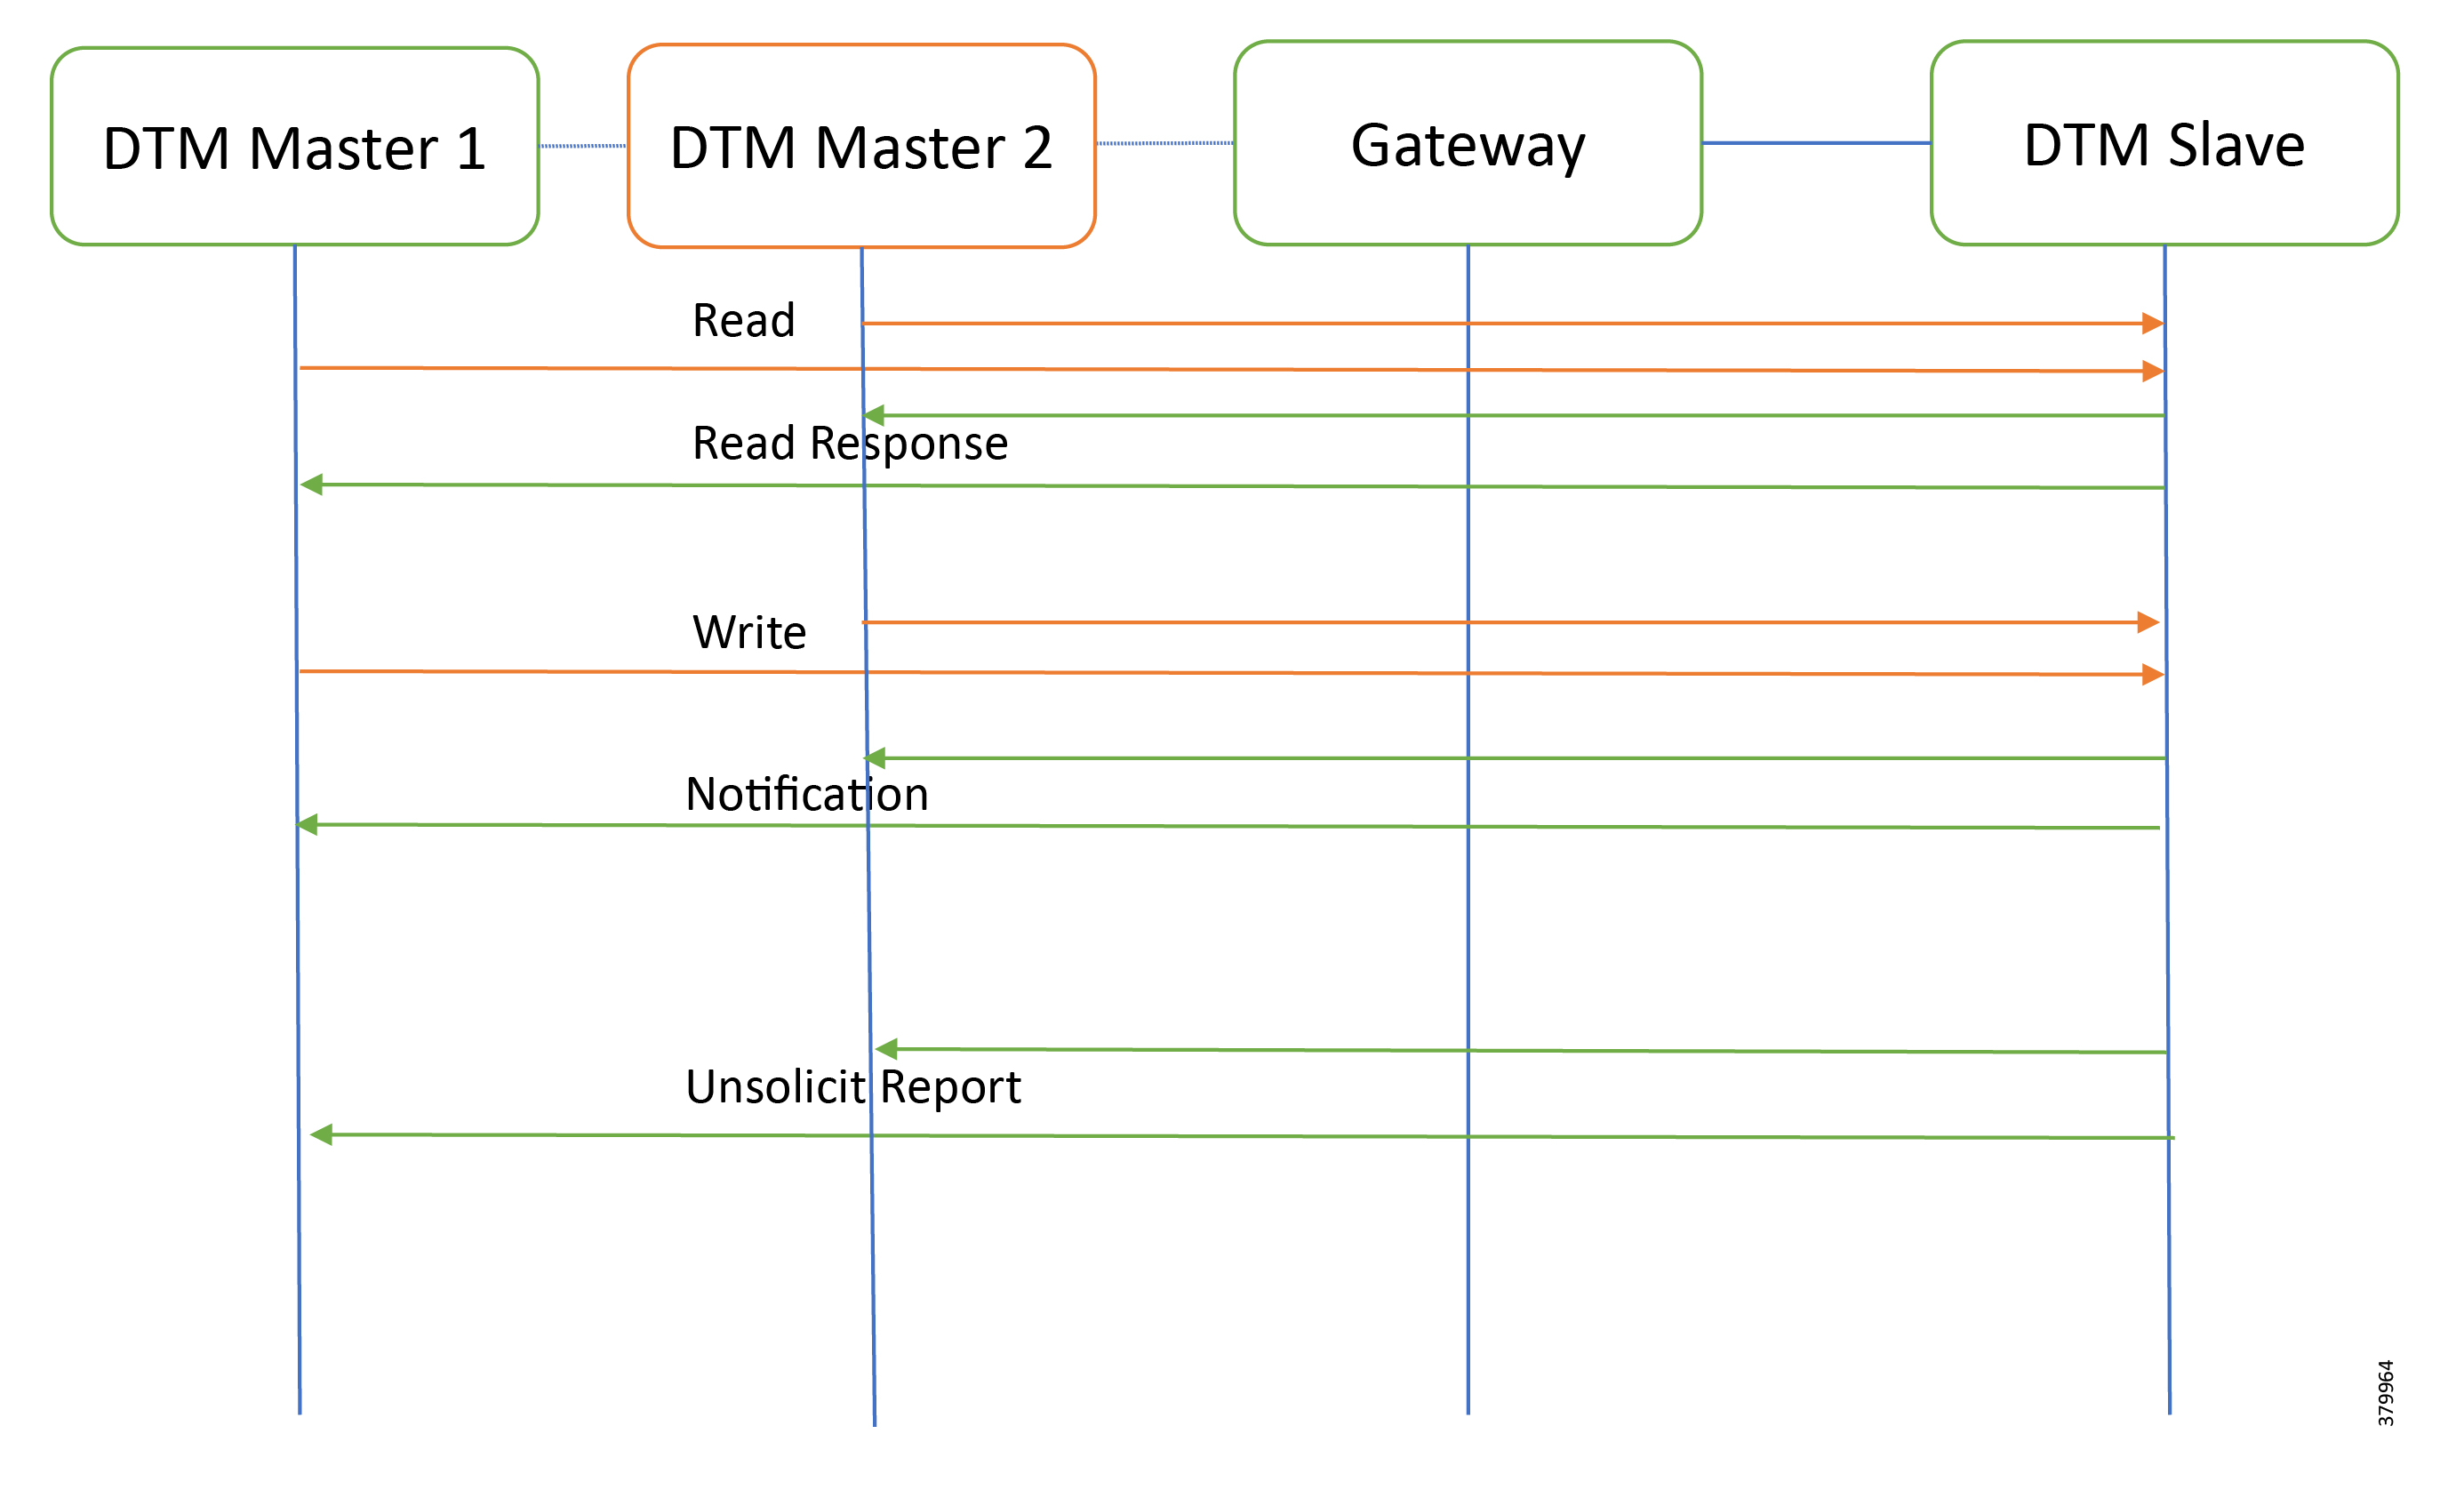
IR807 as DA Gateway or Secondary Substation Router
IR1101 as DA Gateway or Secondary Substation Router
The Master and the Slave can communicate via the network. Poll and Control operations are initiated from the Master. Report by Exception is sent to the Master from the Slave. Figure 69 and Figure 70 show the Poll operation from Dual SCADA-Master belongs to a different control center. Similarly, Control and Report by Exception can also be seen on the Master Analyzer logs.
SCADA Operations
The Poll operation is performed by the dual Masters. The Masters can execute a general Poll in which all the register values are read and sent to the Master, a Poll on a set of registers, or a Poll on a single register. In Figure 69, Figure 70, Figure 71, and Figure 72, we see a general Poll executed on the Slave side. Initially the Master Analyzer is empty; however, when the General Interrogation command is executed, the values of all the registers are displayed on the Master Analyzer of DTM.
Figure 69 CC-1 Master Analyzer Logs before Poll Operation

Figure 70 CC-2 Master Analyzer Logs before Poll Operation

Figure 71 CC-1 Master Analyzer Logs after Poll Operation
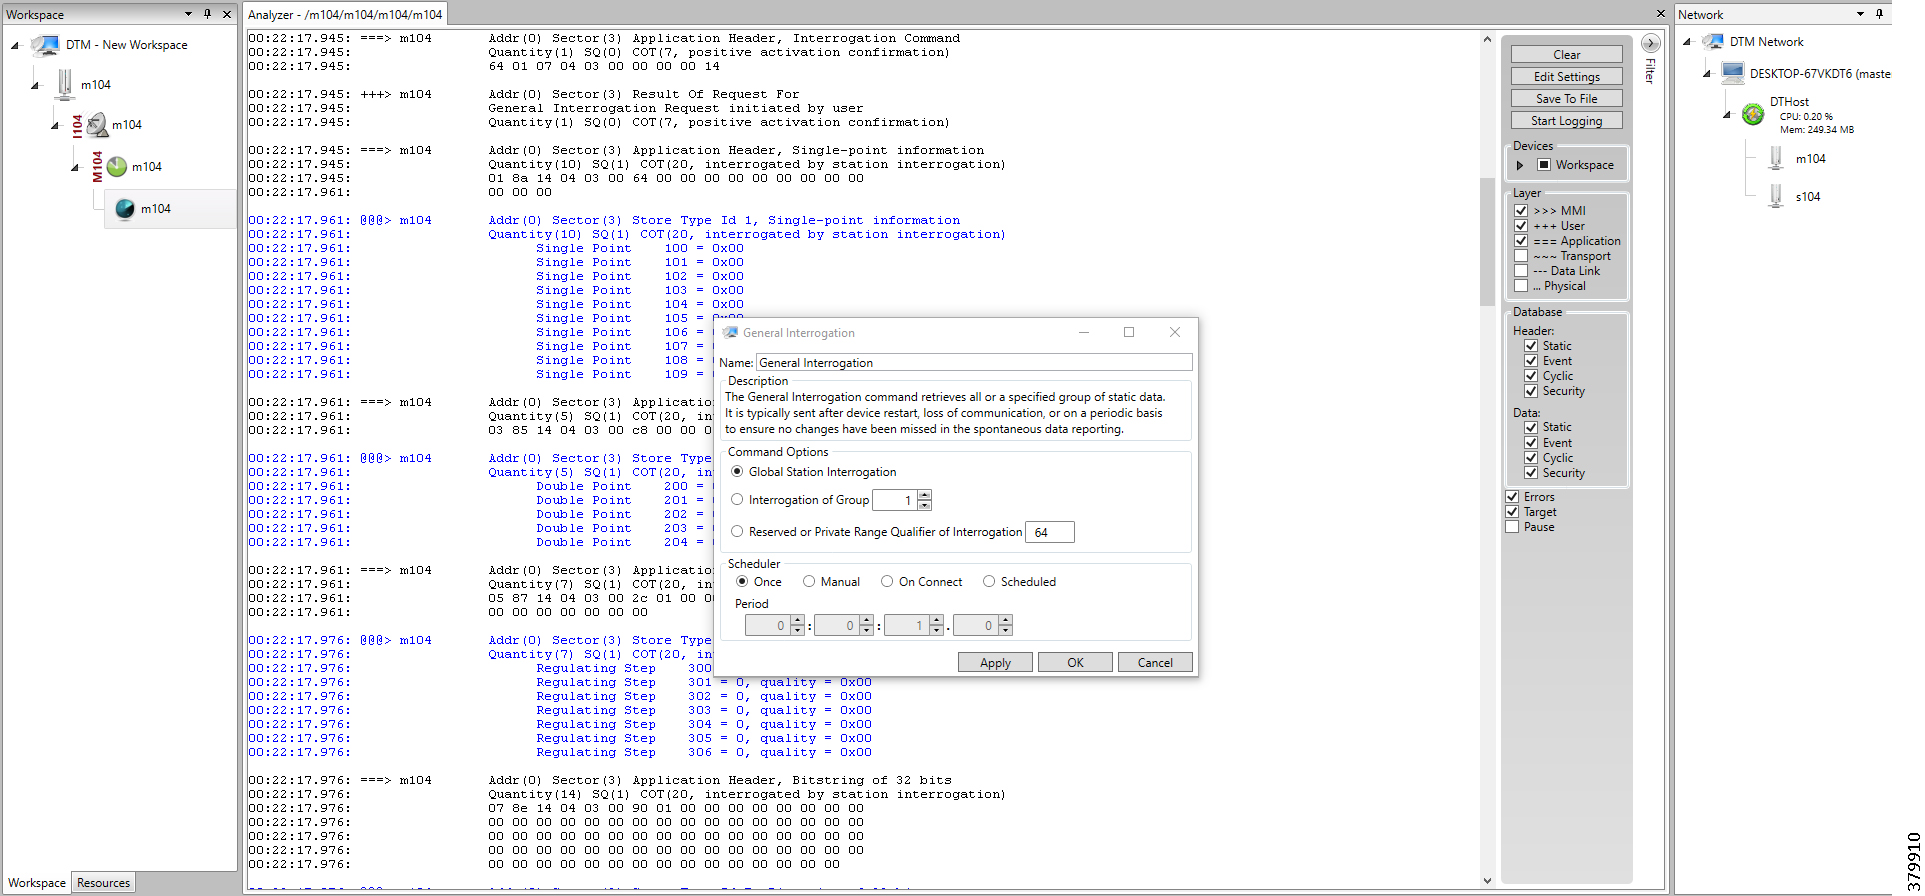
Figure 72 CC-2 Master Analyzer Logs after Poll Operation

The control operation basically sends the control command from the Dual SCADA Masters to the SCADA Slave for the purpose of controlling the operation of end devices. The control command can be executed and the results can be seen on the analyzer. The value of Double Point Register (#200) is changed and the same is reported to both Masters. Figure 73, Figure 74, Figure 75, Figure 76, and Figure 77 show the Report by Exception sent to the dual Masters for a particular register:
Figure 73 Slave Register before Control Operation

Figure 74 CC-1 Master Control Control Operation

Figure 75 CC-2 Master Control Control Operation

Figure 76 CC-1 Slave Register after Control Operation

Figure 77 CC-2 Slave Register after Control Operation

Report by Exception is initiated by the Slave, which is connected to the DA Gateway. Changes to the value of the Slave register are reported to Dual SCADA-Masters. This notification can be seen on the Master Analyzer of DTM software. Figure 78, Figure 79, Figure 80, Figure 81, Figure 82, and Figure 83 show the Report by Exception on the analyzer. The other operations such as Poll and Control can be executed and the results can be seen on the analyzer. The value of Double Point Register (#200) is changed and the same is reported to both Masters. Figure 78, Figure 79, Figure 80, Figure 81, Figure 82, and Figure 83 show the Report by Exception sent to both Masters for a particular register:
Figure 78 CC-1 Master Analyzer
Figure 79 CC-2 Master Analyzer


Figure 81 Change in Slave Register Value

Figure 82 CC-1 Master Analyzer after Change in Register Value

Figure 83 CC-2 Master Analyzer after Change in Register Value

Legacy SCADA (Raw Socket TCP)
Protocol Validated
The protocol we have validated for this release is IEC 60870-5-101.
Flow Diagram
As shown in Figure 84, both the DTM Master can read and write the Slave via the DA Gateway over TCP Raw Socket, and the Slave can send the Report by Exception to both Masters via the DA Gateway over TCP Raw Socket:
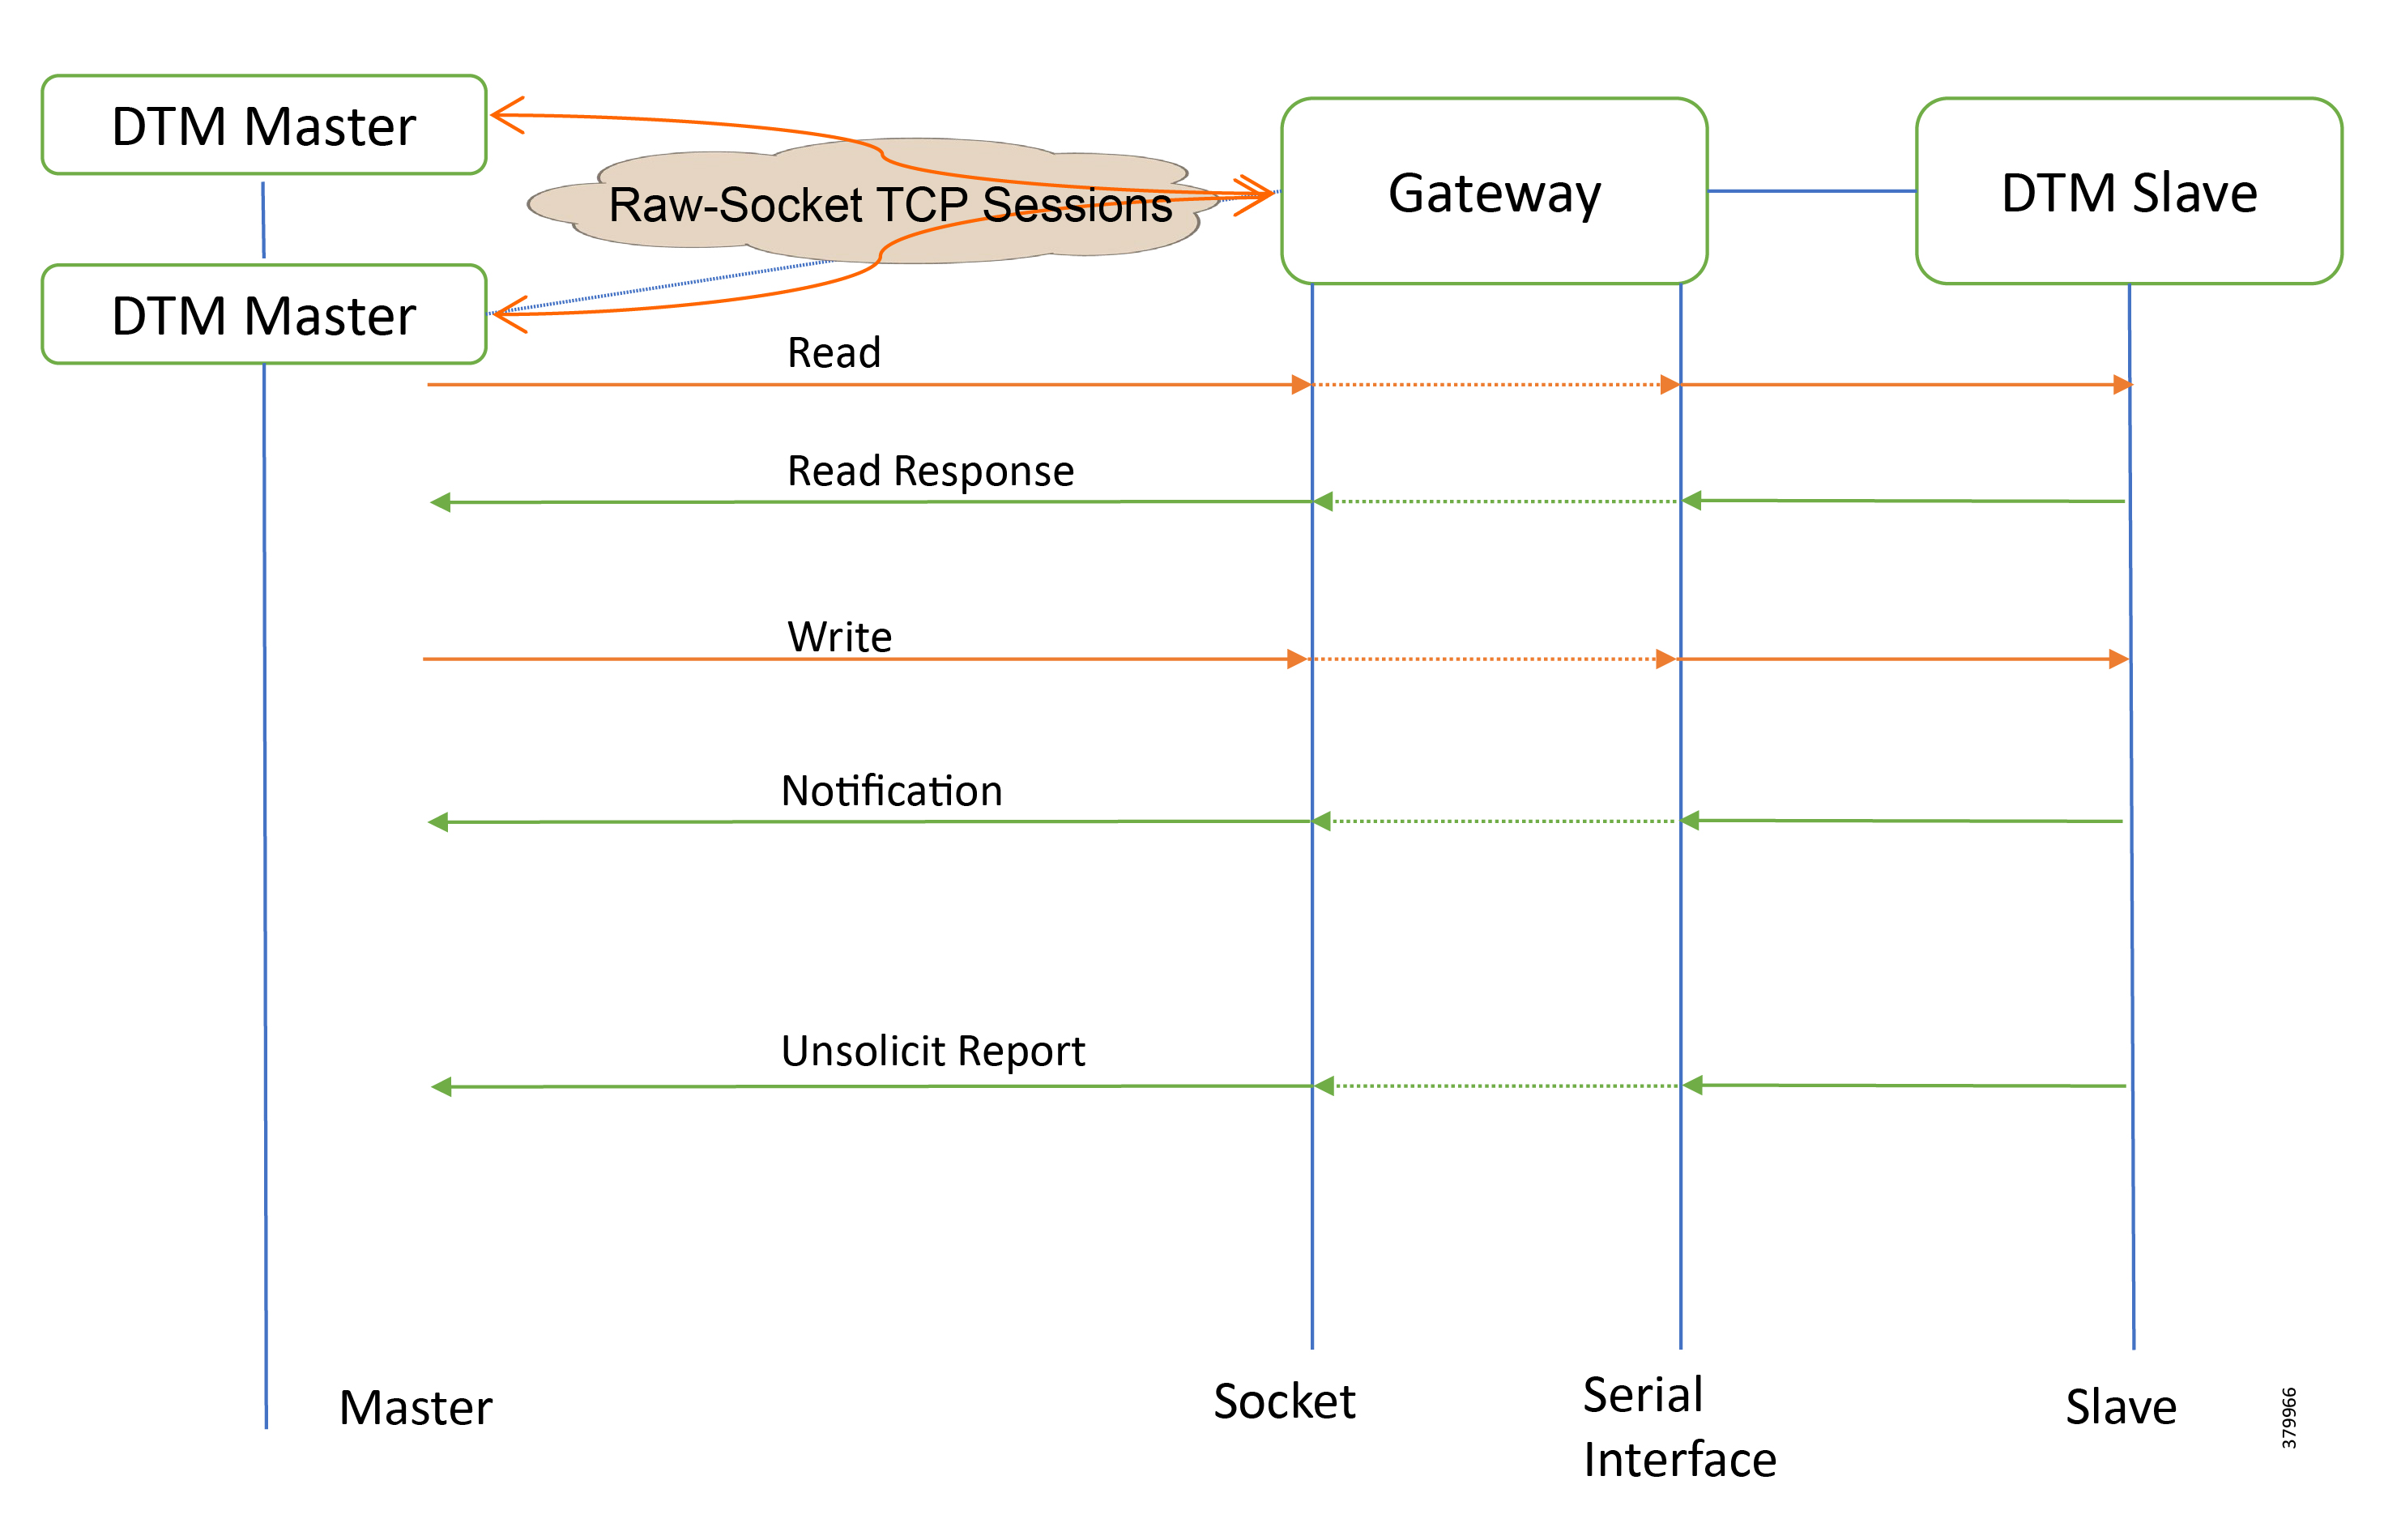
IR807 as Raw Socket Client
IR1101 as Raw Socket Client
SCADA Operations
The Master and the Slave can communicate via the network. Poll and Control operations are initiated from the Master. Report by Exception is sent to both Masters from the Slave.
Figure 85, Figure 86, Figure 87, and Figure 88 show the Poll operation from Dual SCADA Masters. Similarly, Control and Report by Exception can also be seen on both Master Analyzer logs.
The Poll operation is performed by both Masters. The Masters can execute a general Poll in which all the register values are read and sent to the Masters, a Poll on a set of registers or a Poll on a single register. In Figure 85, Figure 86, Figure 87, and Figure 88, we see a general Poll executed on the Slave side. Initially the Master Analyzer is empty; however, when the General Interrogation command is executed, the values of all the registers are displayed on both Masters+ analyzer of DTM.
Figure 85 CC-1 Master Analyzer Logs before Poll Operation

Figure 86 CC-2 Master Analyzer Logs before Poll Operation
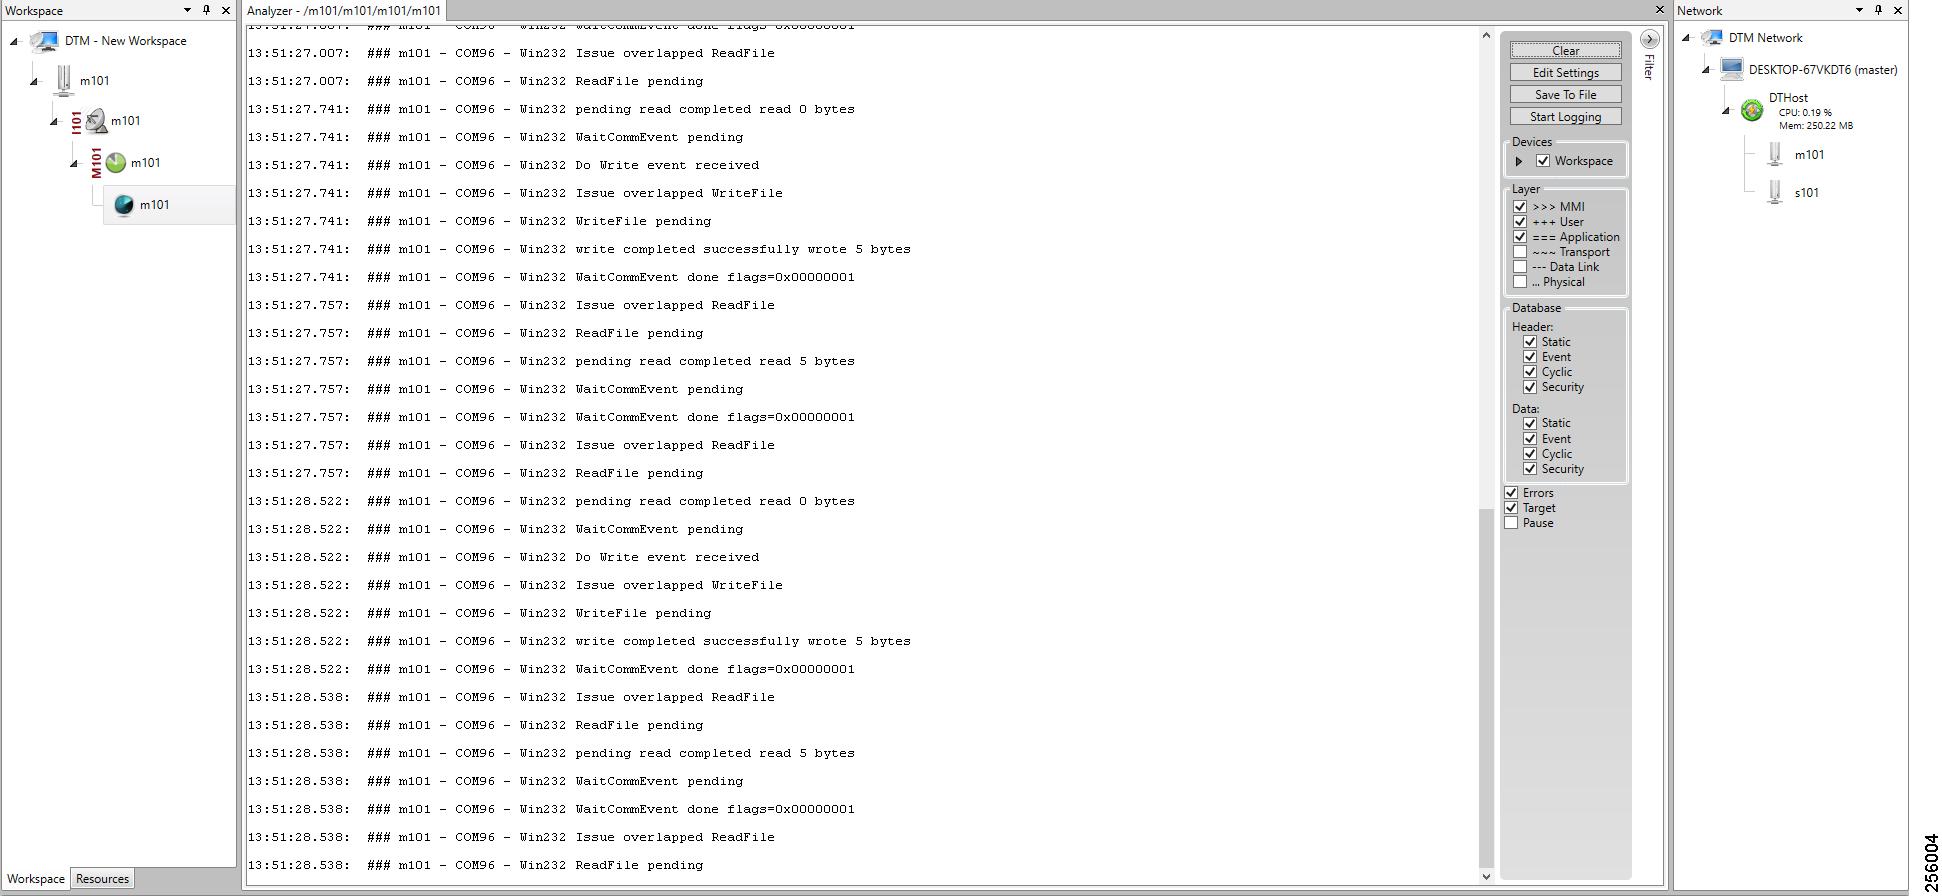
Figure 87 CC-1 Master Analyzer Logs after Poll Operation
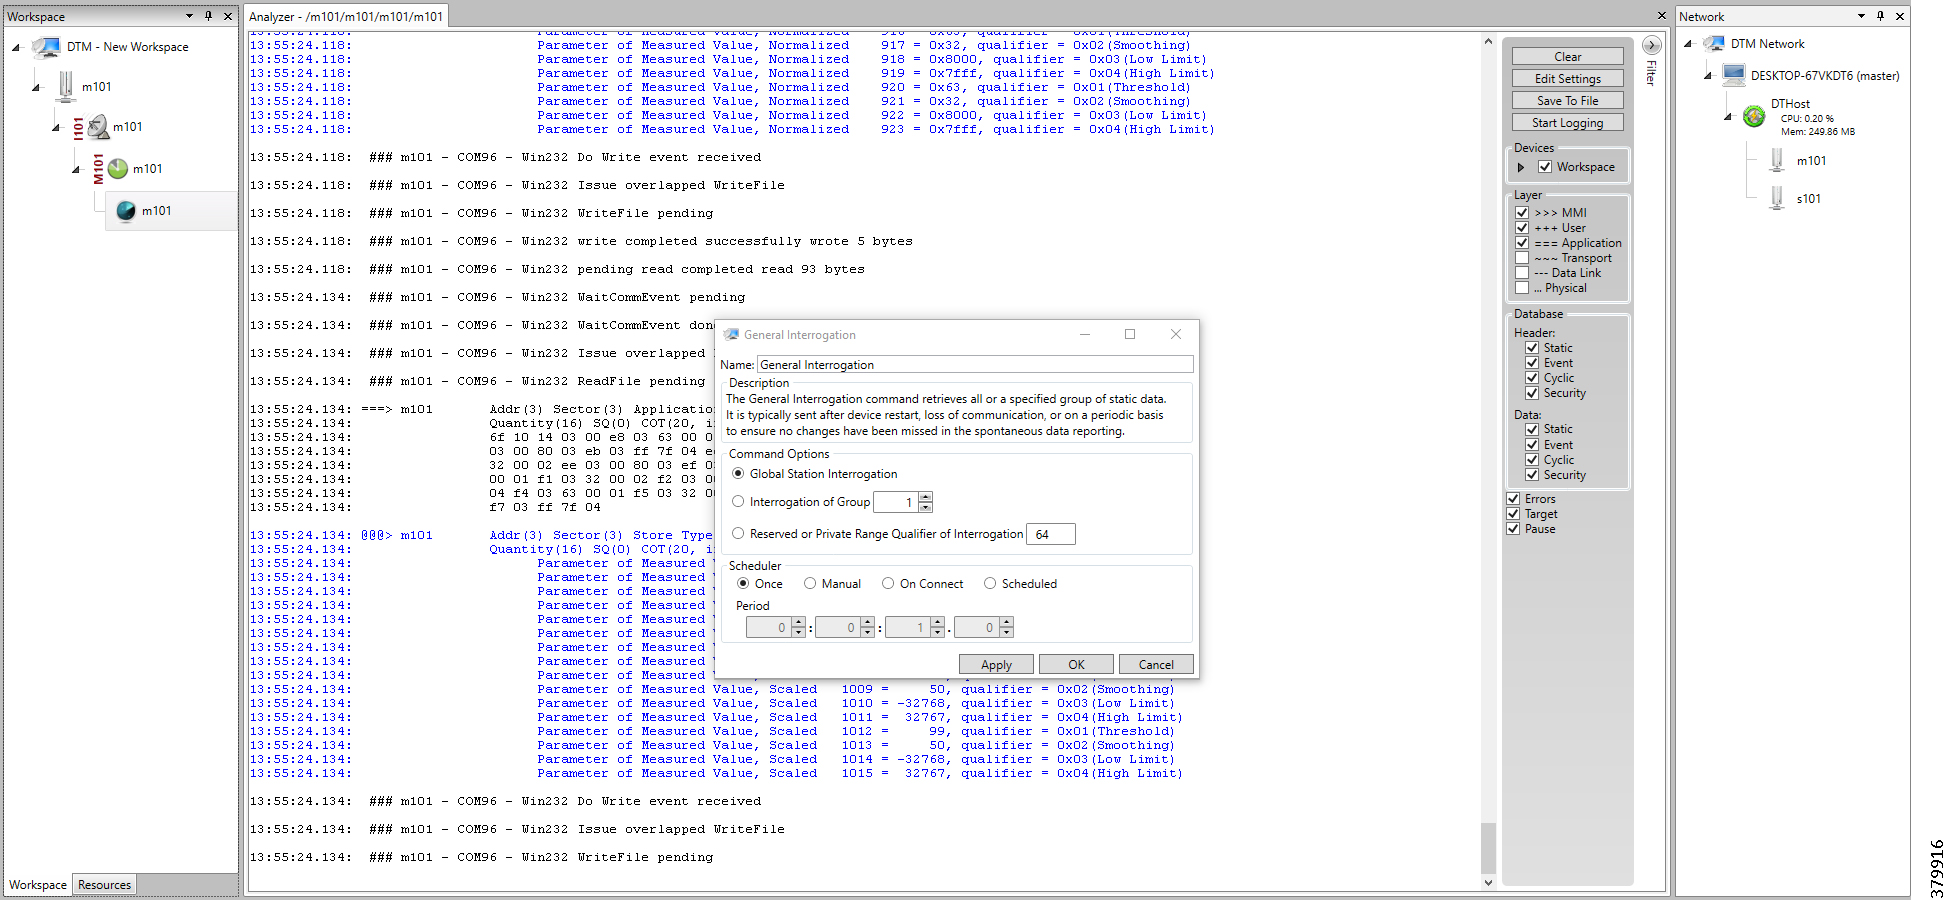
Figure 88 CC-2 Master Analyzer Logs after Poll Operation

The control operation basically sends the control command from the SCADA Master to SCADA Slave for the purpose of controlling the operation of end devices. The control command can be executed and the results can be seen on the analyzer. The value of Double Point Register (#200) is changed and the same is reported to both Masters. Figure 89, Figure 90, Figure 91, Figure 92, and Figure 93 show the Report by Exception sent to the Master for a particular register:
Figure 89 Slave Register before Control Operation

Figure 90 CC-1 Master Control Operation

Figure 91 CC-2 Master Control Operation

Figure 92 CC-1 Slave Register after Control Operation

Figure 93 CC-2 Slave Register after Control Operation

Report by Exception is initiated by the Slave, which is connected to the DA Gateway. Changes to the value of the Slave register are reported to the SCADA-Master. This notification can be seen on the Master Analyzer of DTM software. Figure 94, Figure 95, Figure 96, Figure 97, Figure 98, and Figure 99 show the Report by Exception on the analyzer. The other operations such as Poll and Control can be executed, and the results can be seen on the analyzer. The value of Double Point Register (#200) is changed and the same is reported to both Masters. Figure 94, Figure 95, Figure 96, Figure 97, Figure 98, and Figure 99 show the Report by Exception sent to both Masters for a particular register:
Figure 94 CC-1 Master Analyzer
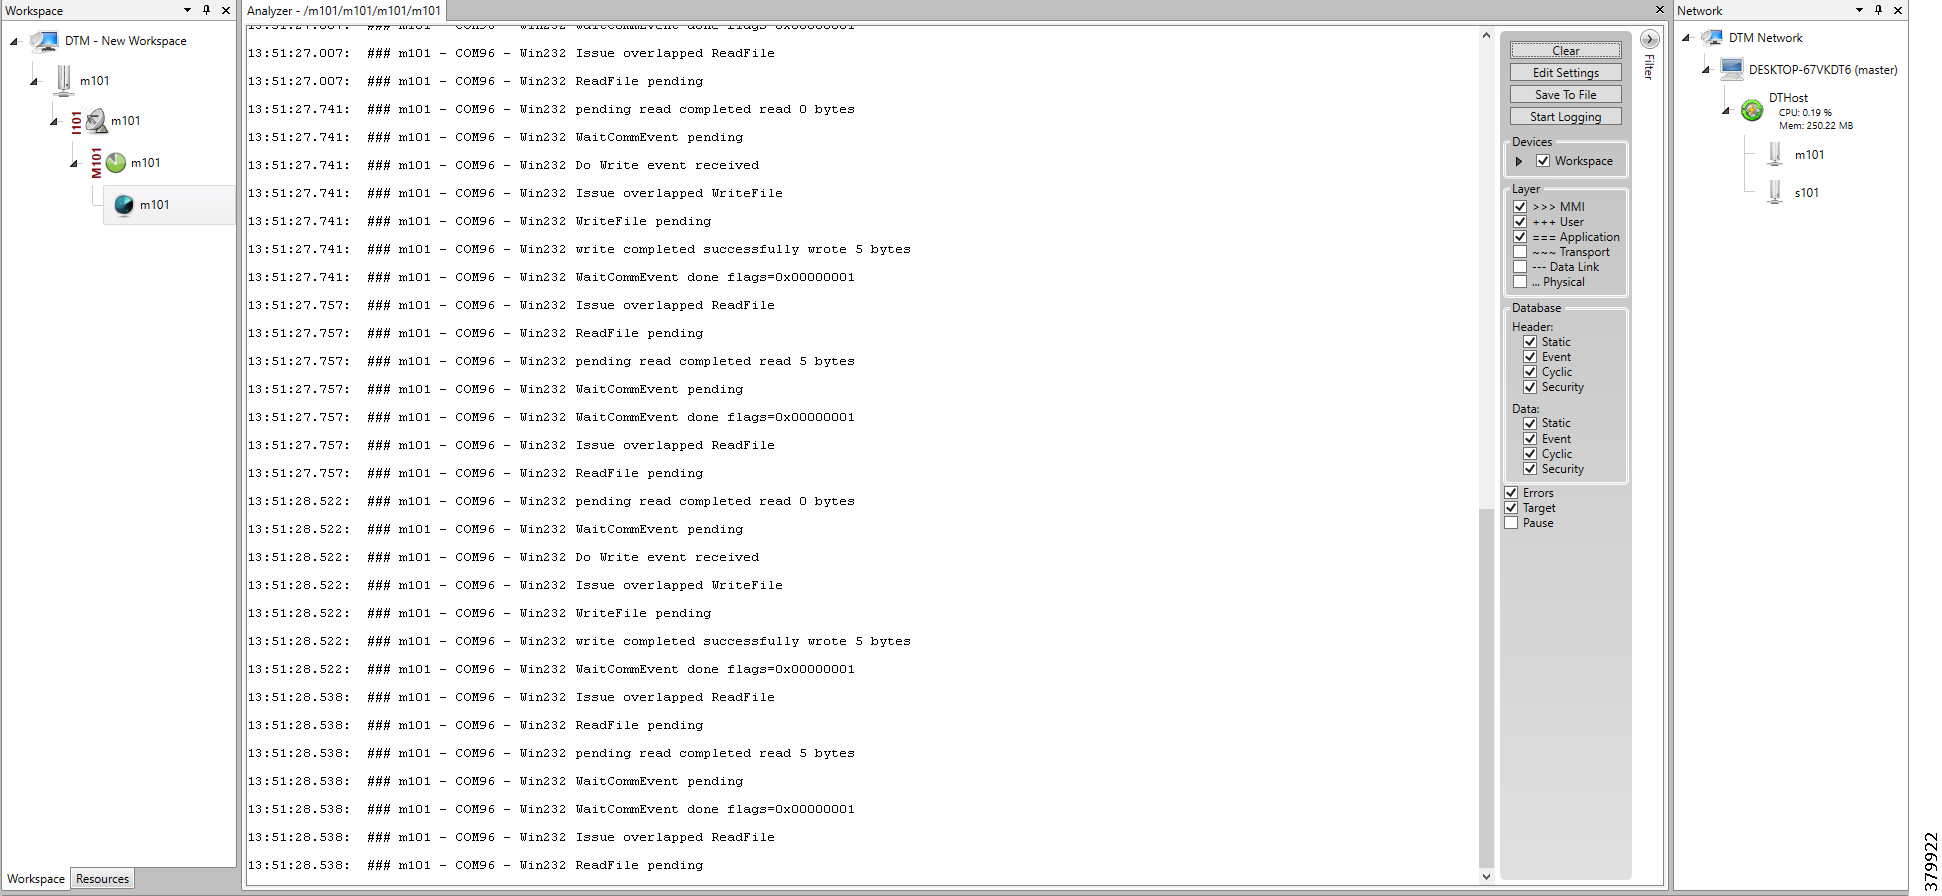
Figure 95 CC-2 Master Analyzer


Figure 97 Change in Slave Register Value

Figure 98 CC-1 Master Analyzer after Change in Register Value
Figure 99 CC-2 Master Analyzer after Change in Register Value
SCADA Gateway
Protocol Validated
The protocol we have validated for this release is IEC 60870-5-101 and IEC 60870-5-104.
Figure 100 T101 to T104 Protocol Translation Control Flow
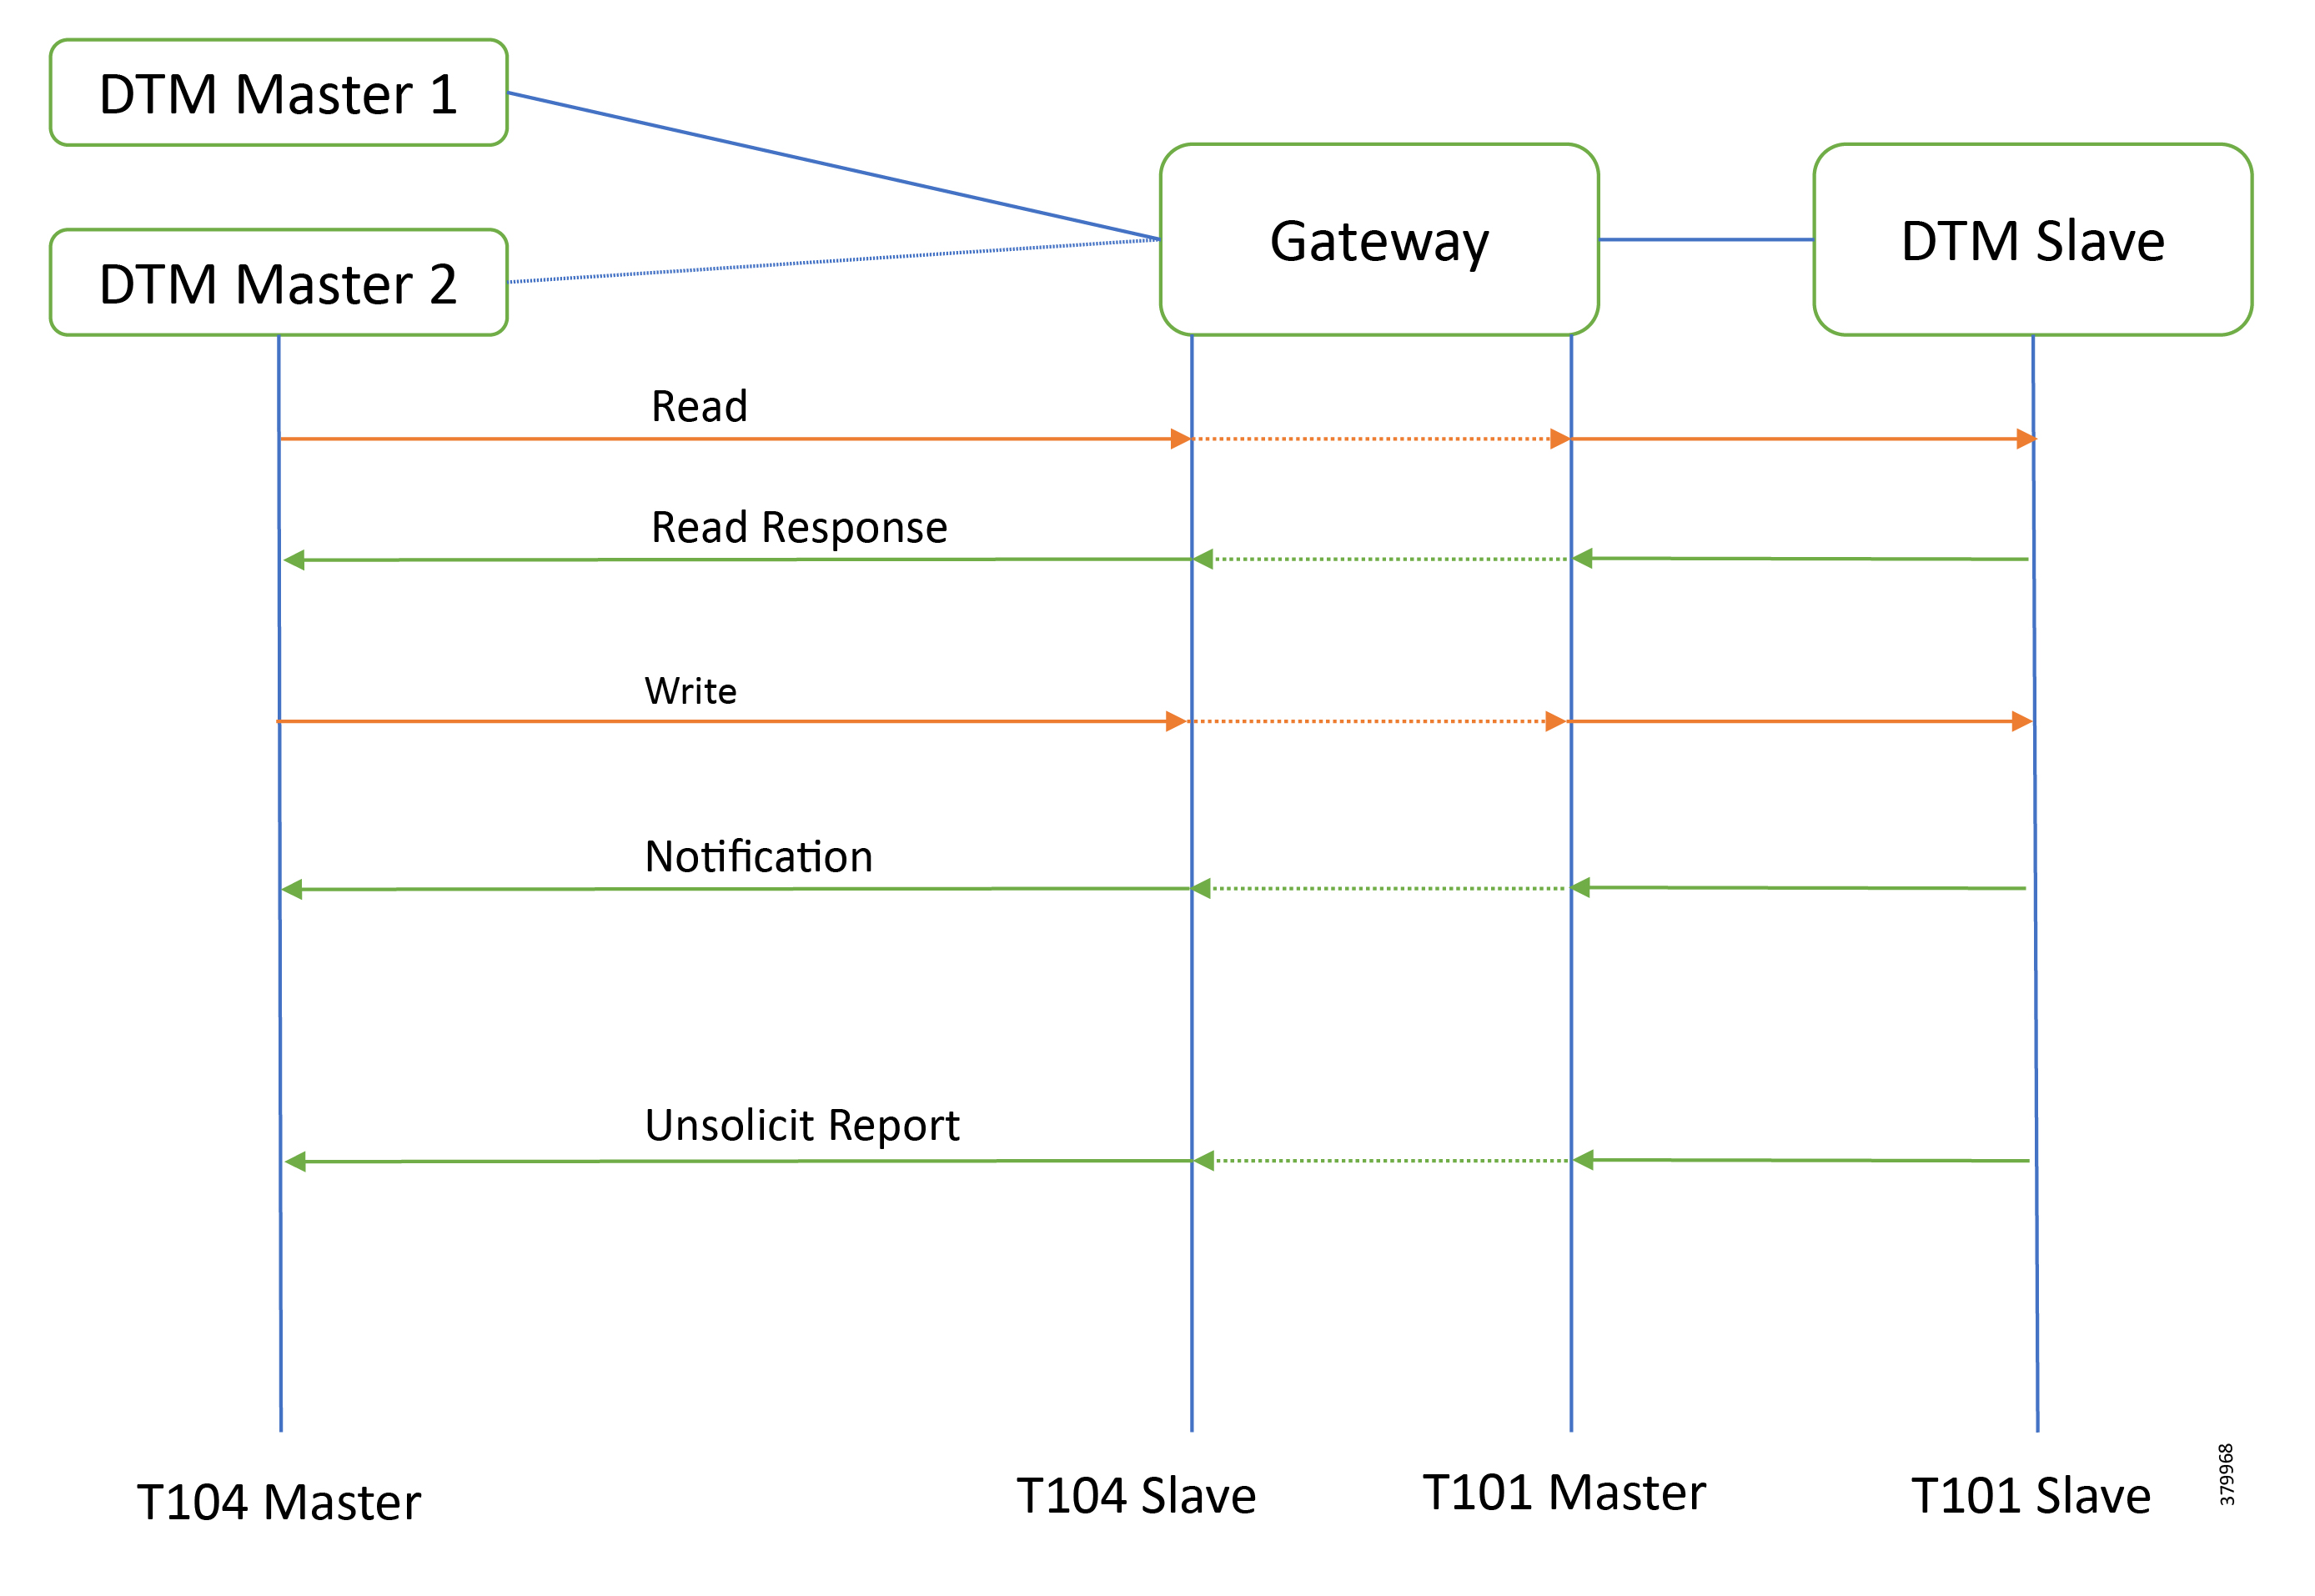
As shown in Figure 100, both DTM Masters can read and write the Slave via the DA Gateway using protocol translation, and the Slave can send the Report by Exception to both Masters via the DA Gateway using protocol translation.
IR807 SCADA Protocol Translation
IR1101 SCADA Protocol Translation
SCADA Operations
The Master and the Slave can communicate via the network. Poll and Control operations are initiated from the Masters. Report by Exception is sent to both Masters from the Slave. Figure 101, Figure 102, Figure 103, and Figure 104 show the Poll operation from Dual SCADA-Masters. Similarly, Control and Report by Exception can also be seen on both Master Analyzer logs.
The Poll operation is performed by the Master. The Master can execute a general Poll in which all the register values are read and sent to the Master, a Poll on a set of registers, or a Poll on a single register. In Figure 101, Figure 102, Figure 103, and Figure 104, we see a general Poll executed on the Slave side. Initially the Master Analyzer is empty; however, when the General Interrogation command is executed, the values of all the registers are displayed on both Master Analyzer of DTM.
Figure 101 CC-1 Master Analyzer Logs before Poll Operation

Figure 102 CC-2 Master Analyzer Logs before Poll Operation
Figure 103 CC-1 Master Analyzer Logs after Poll Operation

Figure 104 CC-2 Master Analyzer Logs after Poll Operation

The control operation basically sending the control command from the both SCADA Master to SCADA Slave for the purpose of controlling the operation of end devices. The control command can be executed and the results can be seen on the analyzer. The value of Double Point Register (#200) is changed and the same is reported to both Masters. Figure 105, Figure 106, Figure 107, Figure 108, and Figure 109 show the Report by Exception sent to both Masters for a particular register:
Figure 105 Slave Register before Control Operation
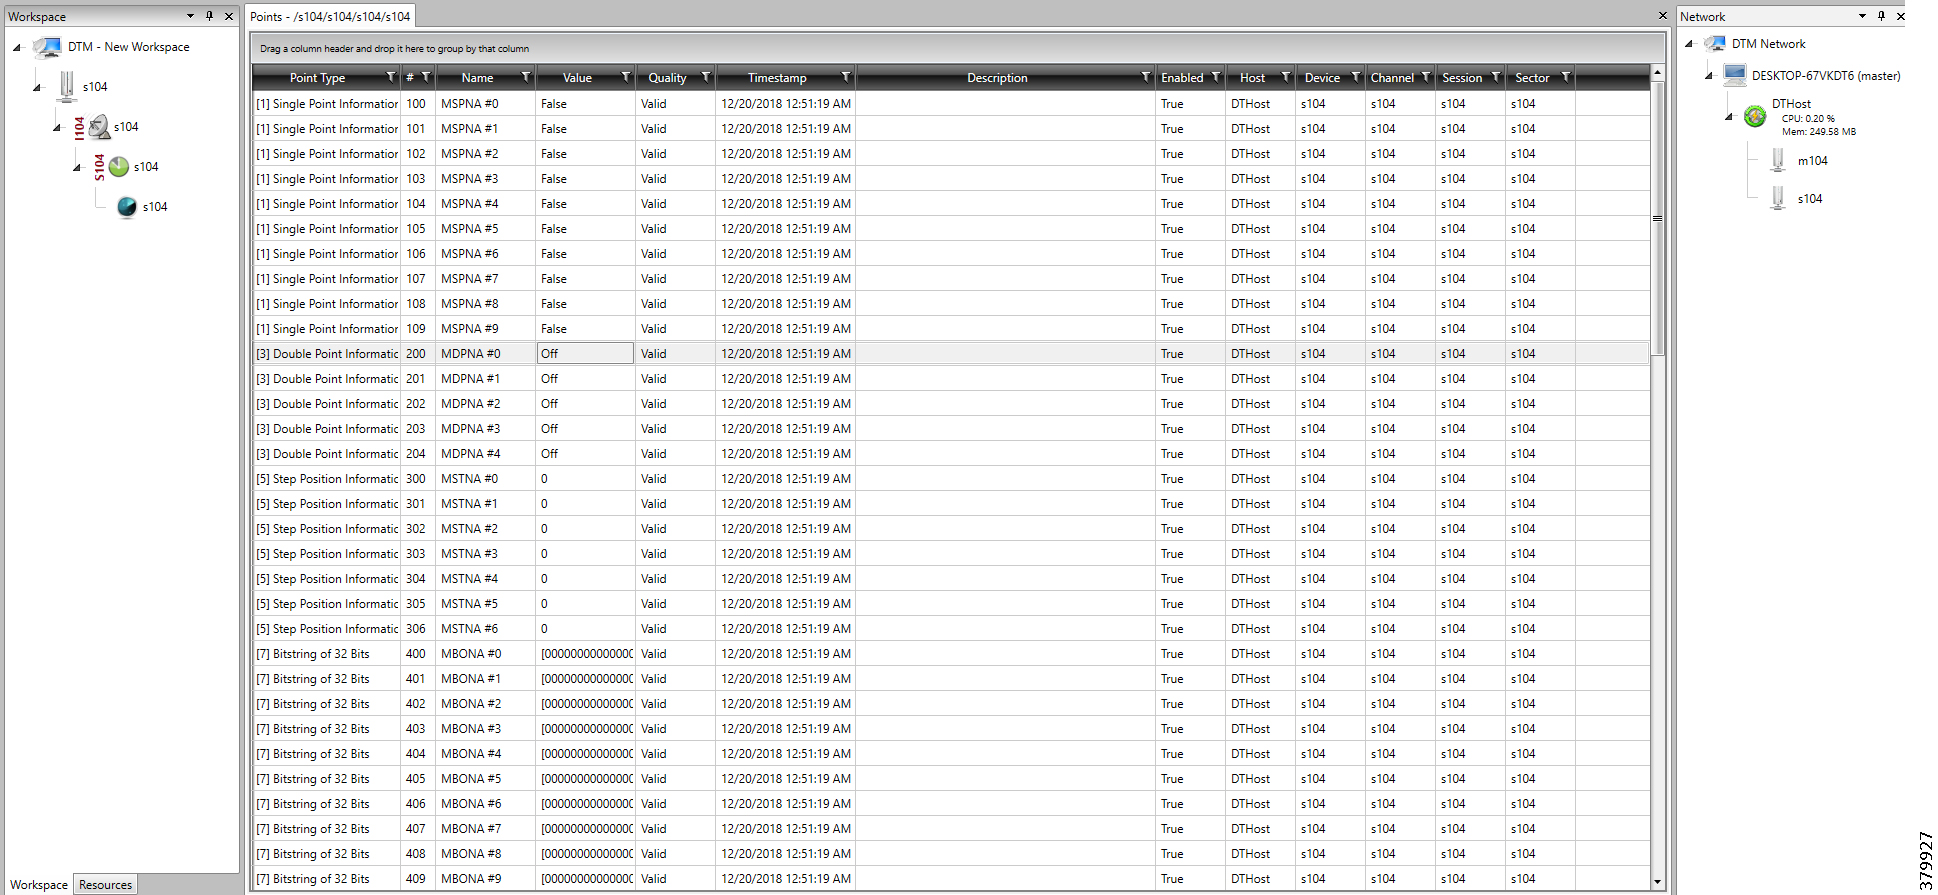
Figure 106 CC-1 Master Control Operation

Figure 107 CC-2 Master Control Operation

Figure 108 CC-1 Slave Register after Control Operation

Figure 109 CC-2 Slave Register after Control Operation

Report by Exception is initiated by the Slave, which is connected to the DA Gateway. Changes to the value of the Slave register changes, are reported to both SCADA-Masters. This notification can be seen on both Master Analyzers of the DTM software. Figure 110, Figure 111, Figure 112, Figure 113, Figure 114, and Figure 115 show the Report by Exception on the analyzer. The other operations, such as Poll and Control, can be executed and the results can be seen on the analyzer. The value of Double Point Register (#200) is changed and the same is reported to both Masters. Figure 110, Figure 111, Figure 112, Figure 113, Figure 114, and Figure 115 show the Report by Exception sent to both Masters for a particular register:
Figure 110 CC-1 Master Analyzer

Figure 111 CC-2 Master Analyzer
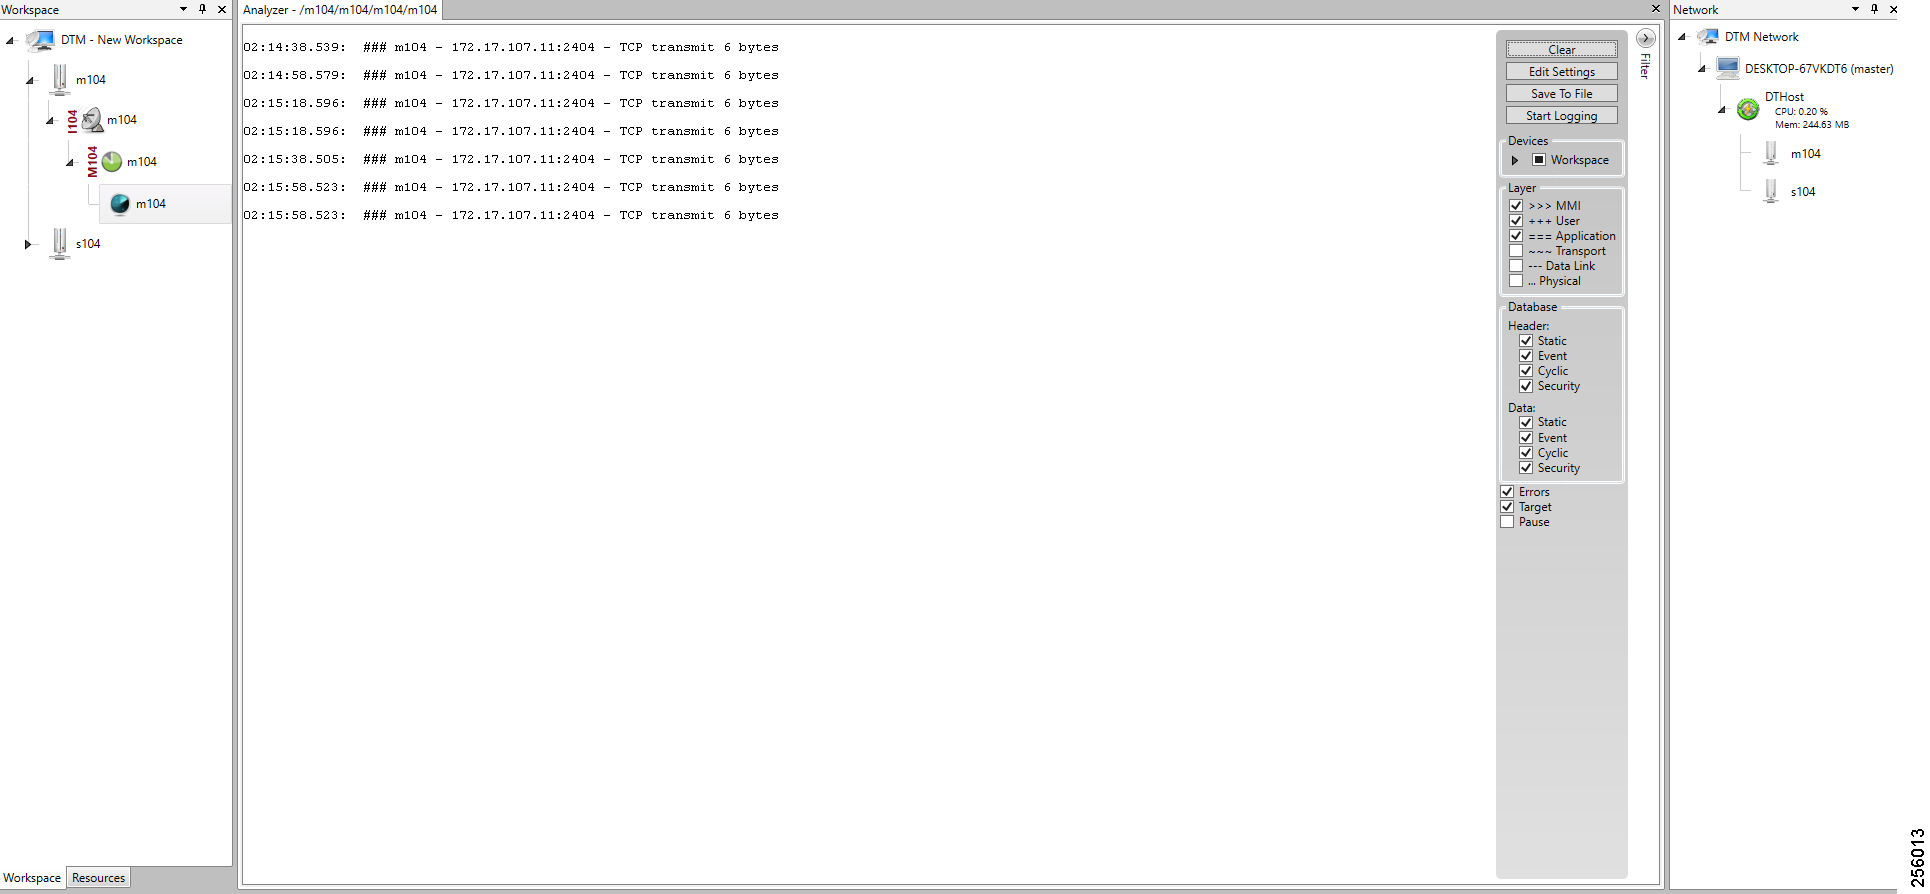

Figure 113 Change in Slave Register Value

Figure 114 CC-1 Master Analyzer after Change in Register
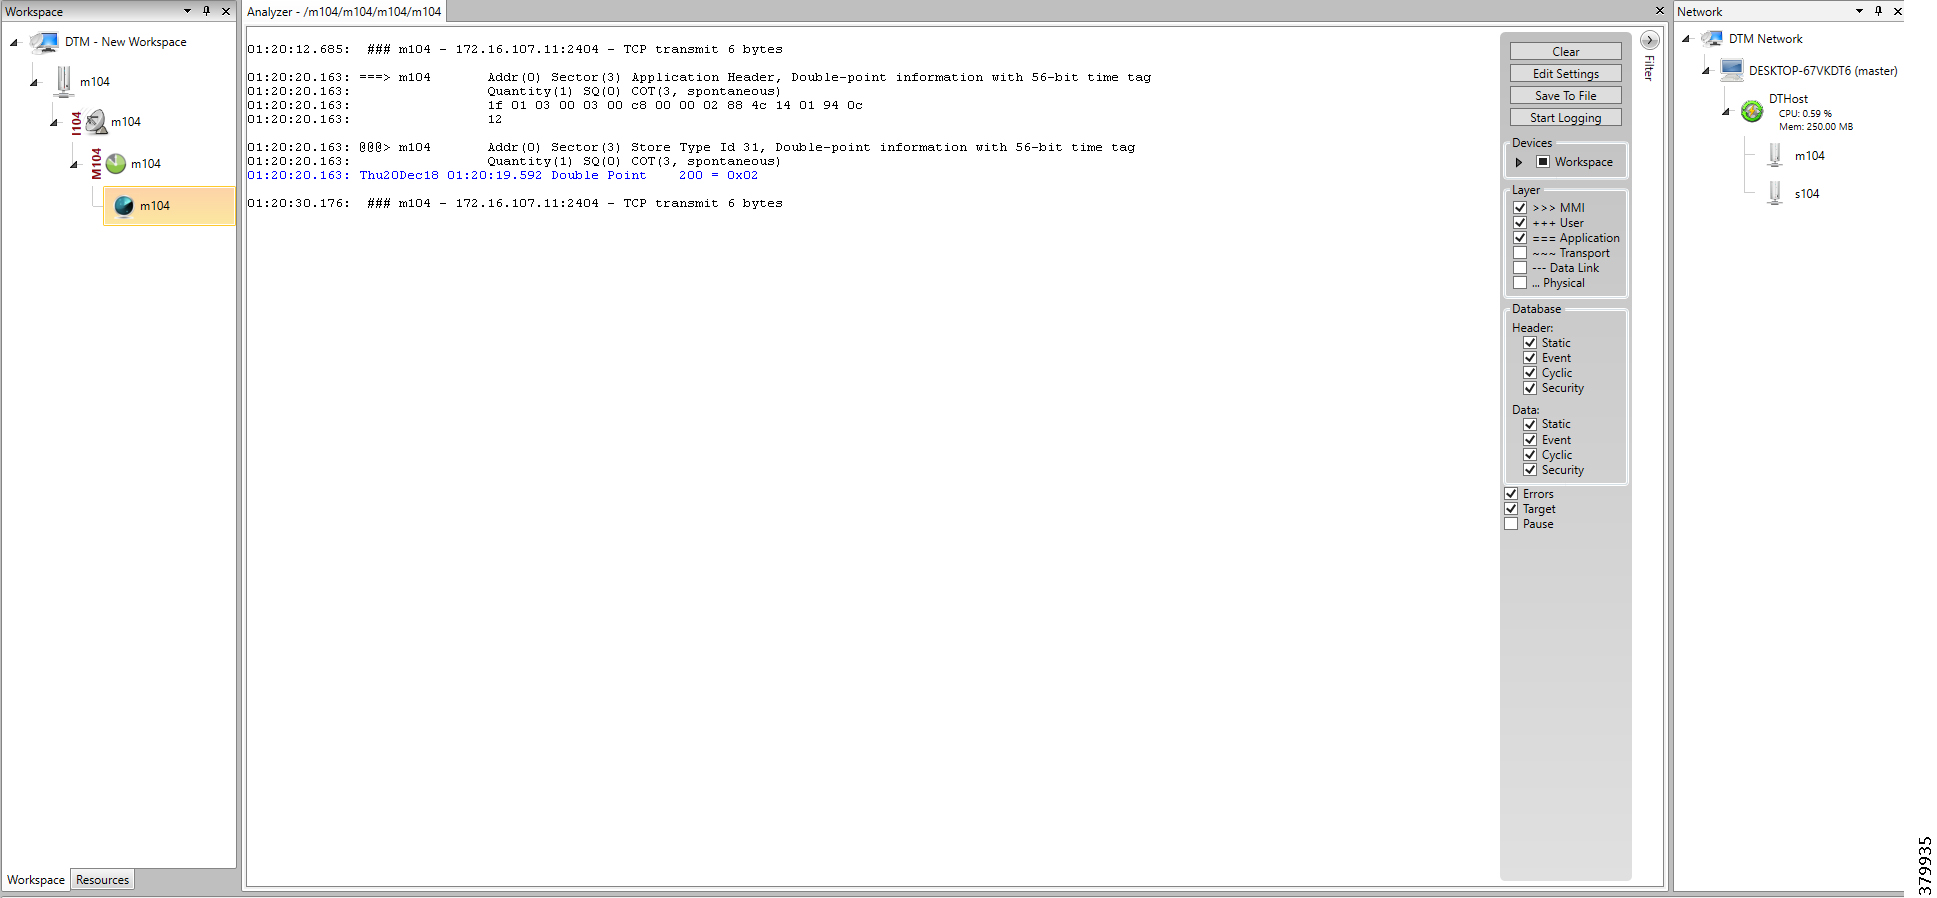
Figure 115 CC-2 Master Analyzer after Change in Register Value
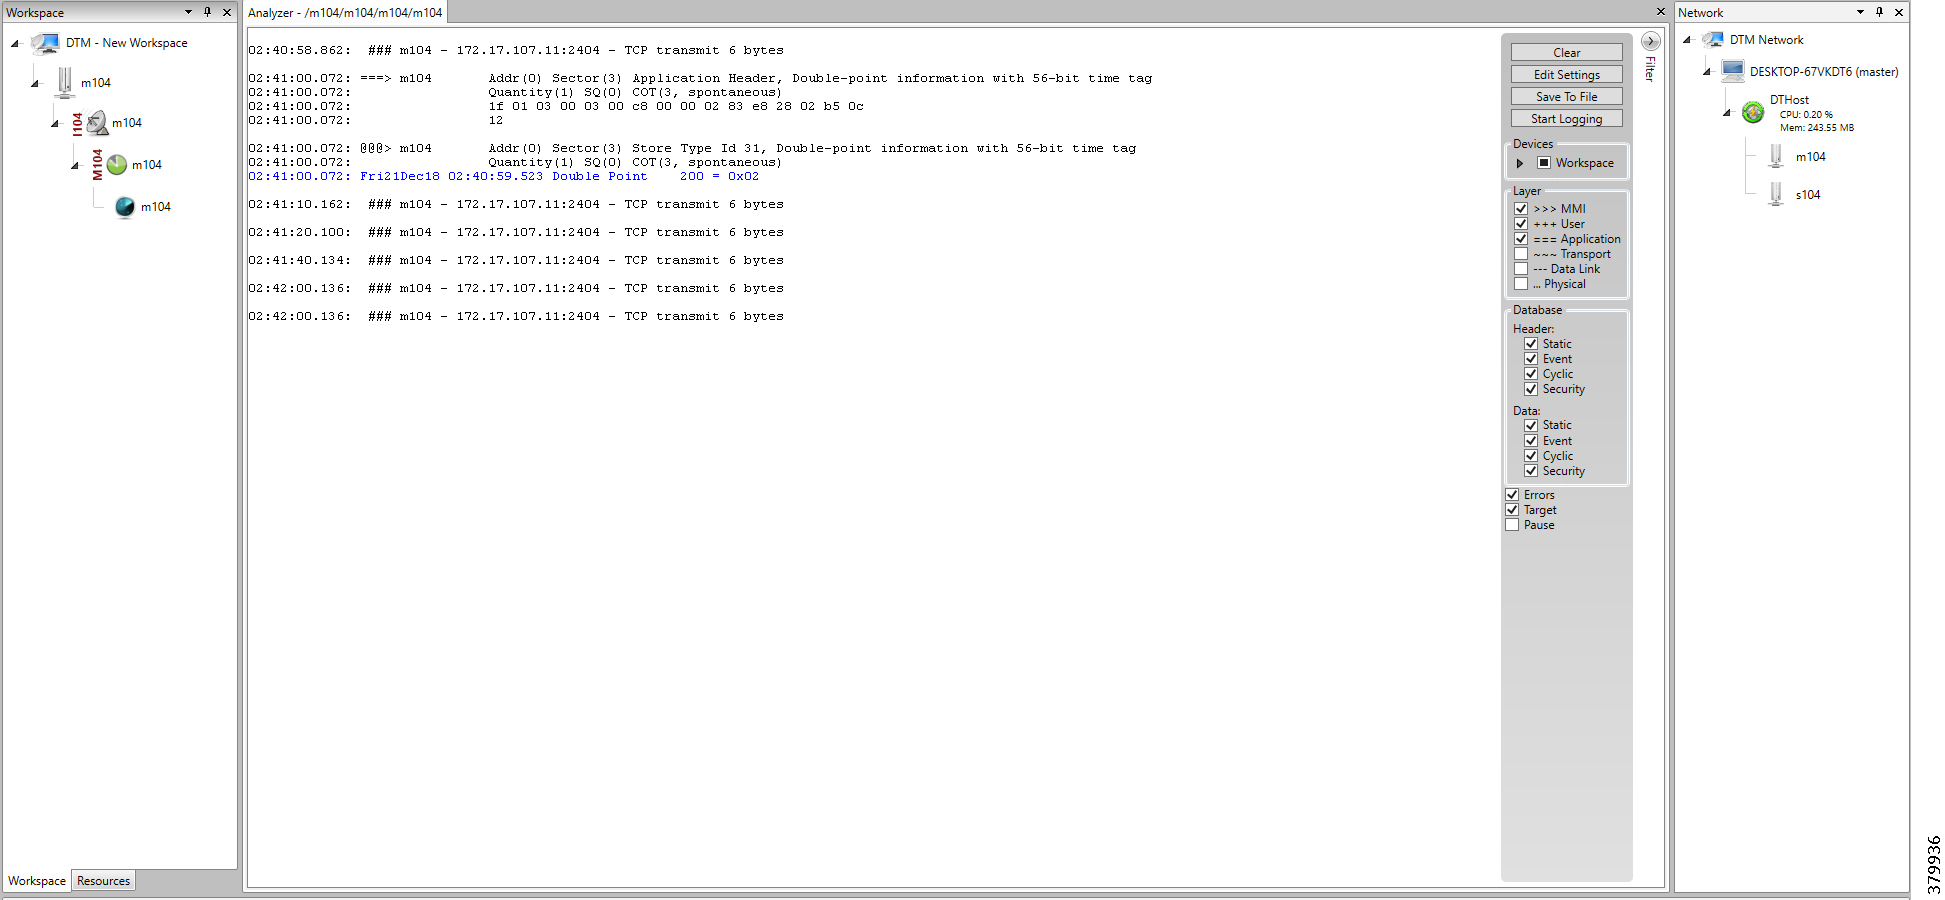
IEC 61850
This section covers the implementation of the solution architecture for MMS and GOOSE. The architecture involves the communication between SCADA to IEDs and IEDs to IEDs.
For design and conceptual understanding of this section please refer to the “Distribution Automation Solution Architecture” chapter of the Design Guide. To enable the network to allow MMS and GOOSE traffic, the following additional configurations are needed:
HER and FAR Configuration for MMS
Figure 116 shows the flow of MMS traffic from SCADA to the IEDs. This section covers the configuration required on HER and FAR to enable communication between SCADA and the MMS device.
Figure 116 IEC 61850 MMS Communication Flow with IEDs in Local LAN and Extended LAN

Note: No additional configuration on the HER is needed.
SCADA in the control center connects to the loopback 0 address on the FAR on a particular port number. This connection from the SCADA control center is translated to a local address of the MMS device using NAT. The loopback address is enabled as part of ZTD. For ZTD and the loopback addressing, please refer to IoT Gateway Onboarding and Management.
The MMS device can reside in the local LAN or in the Extended LAN as shown in the Figure 116 above. These devices are in a private network; therefore, NAT configuration is required. This configuration helps in scaling when a large number of FARs have to be configured. The following details provide the step-by-step configuration:
1.![]() The MMS device can reside either in the local LAN or in the extended LAN. Either of the connections to the FAR are via the gig port. As shown in the above figure, the ports connected to MMS device are VLAN 300 and SVI created for routing packets from SCADA to MMS device and vice versa. The following configurations have to be added in this step:
The MMS device can reside either in the local LAN or in the extended LAN. Either of the connections to the FAR are via the gig port. As shown in the above figure, the ports connected to MMS device are VLAN 300 and SVI created for routing packets from SCADA to MMS device and vice versa. The following configurations have to be added in this step:
2.![]() The next step is to add the NAT configuration to the FAR. This configuration enables communication from SCADA to the MMS device. The port connected to the MMS device is configured with “vlan 300", the corresponding “interface vlan 300" is configured with “ip nat inside” and the connectivity to SCADA through which the tunnel interface is configured with “ip nat outside.” The elucidated configurations are as shown below and the lines in bold are the modifications:
The next step is to add the NAT configuration to the FAR. This configuration enables communication from SCADA to the MMS device. The port connected to the MMS device is configured with “vlan 300", the corresponding “interface vlan 300" is configured with “ip nat inside” and the connectivity to SCADA through which the tunnel interface is configured with “ip nat outside.” The elucidated configurations are as shown below and the lines in bold are the modifications:
HER and MMS Configuration for GOOSE
Figure 117 shows a diagram of the IED-IED communication architecture using GOOSE. This communication can be between two locally-connected GOOSE devices or between two IEDs in different extended LANs. In this section, we will cover the configurations that have to be added on HER and FAR for the GOOSE infrastructure to enable communication. Figure 118 shows a logical diagram of the GOOSE flow over the cellular network:
Figure 117 IED-IED GOOSE Architectural Flow

Figure 118 IED-IED Flow Hub-switched DA Design

Before FAR can be configured with L2TPV3, HER acts as the L2TPv3 Hub and the necessary configurations have to be added on the HER. Figure 119 shows HER as L2TPv3 Hub for creating Layer 2 Bridge Domain:

In Figure 119, two HERs are shown. Multiple HERs can be used for redundancy. Here the second HER acts as the backup hub. Figure 120 shows the logical flow of GOOSE traffic from one IED to another IED. The configuration on HER and FAR should be understood using both Figure 119 and Figure 120 as references.
Figure 120 IED-IED GOOSE Logical Flow

The hub configurations are as follows:
1.![]() Multiple IR1101s connect to the primary hub via the L2TPv3 tunnel. The hub connects to each IR1101 with a different VC ID. Pseudowire configurations mentions the local interface at which the L2TPv3 tunnel must end. For a single tunnel from the hub to one IR1101, a subinterface is created and tagged with VC ID which is unique to the connecting IR1101. Similar subinterfaces must be created for different IR1101 to connect to the hub.
Multiple IR1101s connect to the primary hub via the L2TPv3 tunnel. The hub connects to each IR1101 with a different VC ID. Pseudowire configurations mentions the local interface at which the L2TPv3 tunnel must end. For a single tunnel from the hub to one IR1101, a subinterface is created and tagged with VC ID which is unique to the connecting IR1101. Similar subinterfaces must be created for different IR1101 to connect to the hub.
2.![]() When packets arrive at the hub over the L2TPV3 tunnel from one IR1101, those packets must be untagged and bridged to one VLAN (this guide implements VLAN 1000). After the packets have been bridged to VLAN 1000, they are sent to other IR1101s in the network with their respective VC IDs. Figure 120 clearly shows the flow of packets from one IR1101 to another. The packet from Device 1 is sent to Hub with VC ID 1001. This VC ID 1001 is removed and sent to the bridge interface to which all the other L2TPv3 tunnels are connected. The received packet from Device 1 is tapped by other tunnel interfaces. The packet is sent over the other L2TPv3 after tagging it with the respective VC ID. The following configuration provides the untagging and bridging:
When packets arrive at the hub over the L2TPV3 tunnel from one IR1101, those packets must be untagged and bridged to one VLAN (this guide implements VLAN 1000). After the packets have been bridged to VLAN 1000, they are sent to other IR1101s in the network with their respective VC IDs. Figure 120 clearly shows the flow of packets from one IR1101 to another. The packet from Device 1 is sent to Hub with VC ID 1001. This VC ID 1001 is removed and sent to the bridge interface to which all the other L2TPv3 tunnels are connected. The received packet from Device 1 is tapped by other tunnel interfaces. The packet is sent over the other L2TPv3 after tagging it with the respective VC ID. The following configuration provides the untagging and bridging:
3.![]() In this step, if another HER needs to be connected, then the Layer 2 trunk needs to be established between the ports connecting the HERs and the configurations done in the previous two steps have to be repeated. This is labeled as Step 4 and Step 5 in Figure 119.
In this step, if another HER needs to be connected, then the Layer 2 trunk needs to be established between the ports connecting the HERs and the configurations done in the previous two steps have to be repeated. This is labeled as Step 4 and Step 5 in Figure 119.
At the FAR side, the configurations are simple. Refer to Figure 119 and Figure 120 for the topological diagram and the logical flow of GOOSE traffic to comprehend the following configuration. The FAR configurations are as follows:
1.![]() The pseudowire configurations are similar to the pseudo wire configured on the Hub.
The pseudowire configurations are similar to the pseudo wire configured on the Hub.
2.![]() In this step, the xConnect configurations have to made on VLAN, which is used to connect to the IED. In this guide, we are using VLAN 600 to connect to the IED. The following configuration lines display the necessary configurations required to configure xConnect on FAR:
In this step, the xConnect configurations have to made on VLAN, which is used to connect to the IED. In this guide, we are using VLAN 600 to connect to the IED. The following configuration lines display the necessary configurations required to configure xConnect on FAR:
Note: Avoid using default routes on FAR to achieve better Layer 2 resiliency timers.
End-to-End Application Use Case Scenarios
This chapter includes the following major topics:
■![]() Fault Location, Isolation, and Service Restoration
Fault Location, Isolation, and Service Restoration
Volt/VAR
The main purpose of Volt/VAR Control (VVC) is to maintain acceptable voltage levels at all points along the distribution feeder under all loading conditions. For optimizing the movement of electric energy, it is necessary to minimize the reactive power flows, which is done locally by reactive power compensation equipment such as capacitor banks.
The advanced Volt/VAR Optimization (VVO) application will be using two-way communication infrastructure and remote control capability for capacitor banks, and voltage-regulating transformers, to optimize the energy delivery efficiency at the distribution level. In fact, the reactive power flow creates a voltage drop on an inductive element of wires. So, in order to keep the voltage always within certain limits, the reactive power flow and voltage control must be considered together. Therefore, we call it VVC (Volt/VAR Control). For the voltage and reactive power control, Load Tap Changer (LTC) transformers, switched shunt capacitors, and step voltage regulators are used. A minimum requirement for voltage control is the ability of the operator to maintain the voltage on the feeder at an acceptable range by changing the position of a movable tap changer on a voltage regulator.
Note: Volt/VAR Control = Power Factor Regulation + Conservation Voltage Regulation
Please refer to the Design Guide for more information about the Volt/VAR architecture and infrastructure setup. For this Implementation Guide, we have chosen the radial feeder setup for simulating the Volt/VAR use case.
Volt/VAR Devices
The devices involved in the Volt/VAR use case are listed in Table 15:
Data Points
The data points involved in the Volt/VAR use case are listed in Table 16:
Volt/VAR Use Case Simulation Components
The entire event sequence of the Volt/VAR use case is simulated using the Triangle MicroWork’s DTM application with the help of the Java script.
Table 17 describes the components involved in Volt/VAR simulation:
SCADA Control Center General Configuration
The following steps detail the common SCADA Control Center configuration for Volt/VAR Control and FLISR use cases.
1.![]() Choose the DTM Role as DTM Master from the Tools > Configure DTM Services menu.
Choose the DTM Role as DTM Master from the Tools > Configure DTM Services menu.
Figure 121 DTM SCADA Control Server Role
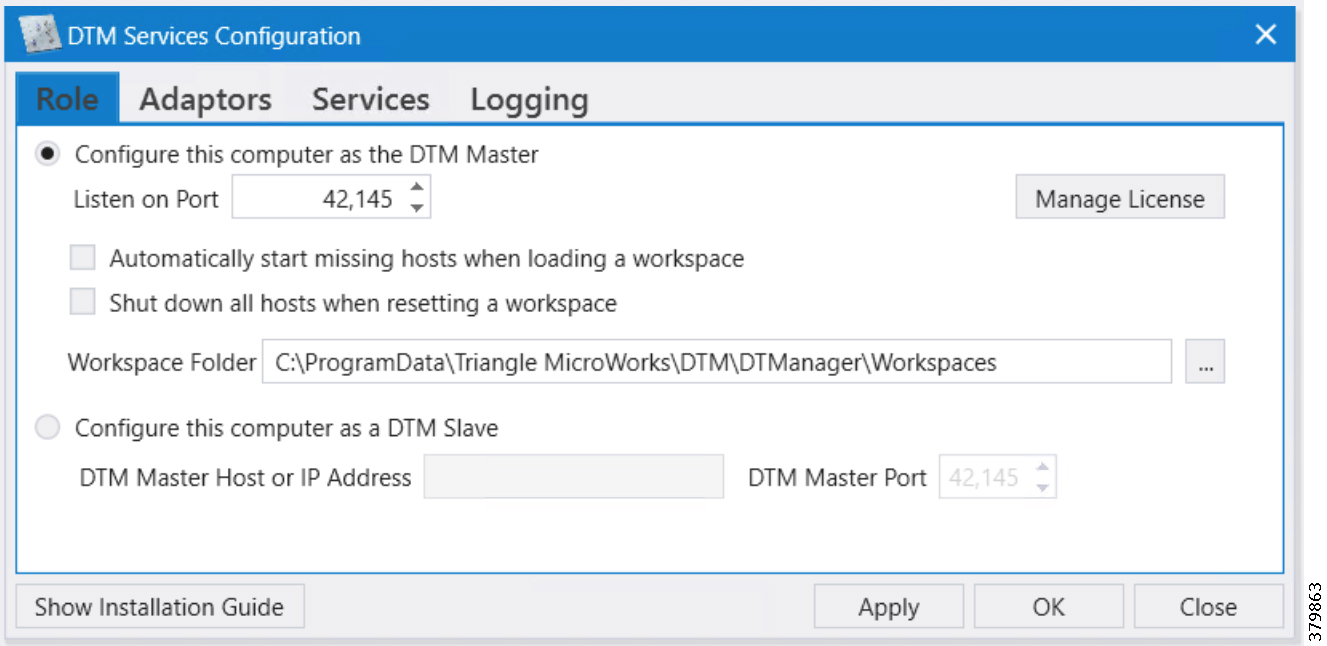
2.![]() Choose the correct network interface adapter in the Adapters tab.
Choose the correct network interface adapter in the Adapters tab.
Figure 122 DTM SCADA Control Center Adapter Configuration
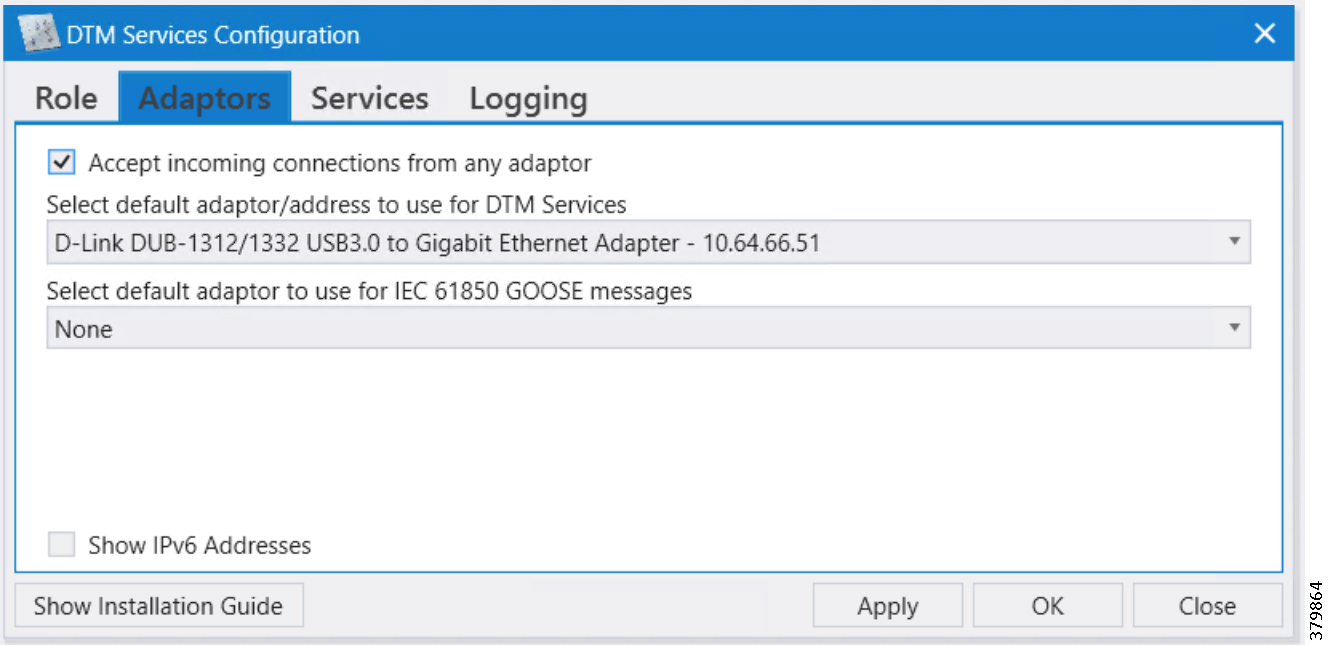
3.![]() The chosen network interface adapter would be used for communication between the DTM Master and the DTM Slave/Client PC.
The chosen network interface adapter would be used for communication between the DTM Master and the DTM Slave/Client PC.
Outstation General Configuration
Outstation or IEDs are configured in the DTM machine. There are five IEDs and one substation monitoring device. All six devices are simulated in the TMW's DTM application.
Start the DTM service in the client machine with the role as Client, and Master IP pointing to the SCADA Control Center.
Figure 123 DTM Outstation Role
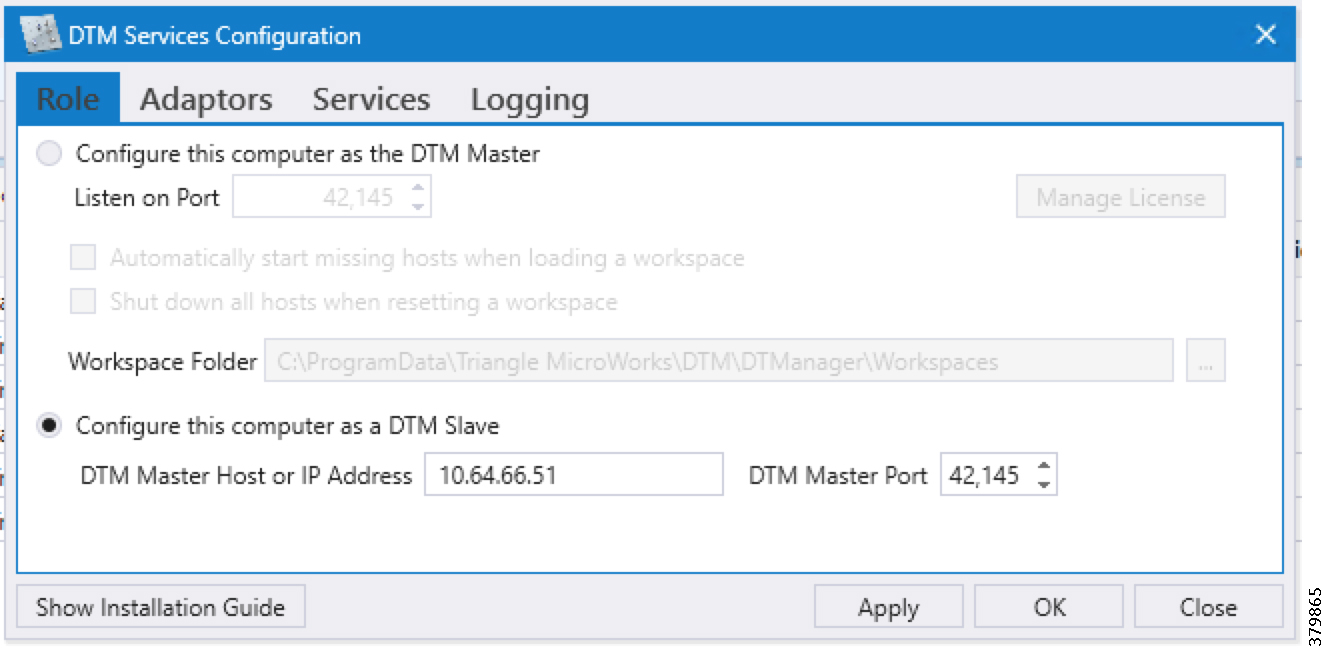
Note: When the DTM Master is loaded with the Volt/VAR workspace and the DTM service is started in the Client, then the entire outstation configuration is automatically loaded into the client machine as well as the outstation or IED data points per the details in Figure 124:
Figure 124 DTM Outstation Data Points

Eximprod Virtual Remote Terminal Unit
Eximprod's Virtual RTU is installed on the Industrial Router located in the substation. The Control Center and outstation device data points mapping are configured on the Virtual RTU using Eximprod's ES200 Windows application.
■![]() Eximprod's ES200 installation guide is available at the following URL:
Eximprod's ES200 installation guide is available at the following URL:
–![]() http://www.epg.ro/wp-content/uploads/2017/09/ES200-Datasheet-public.pdf
http://www.epg.ro/wp-content/uploads/2017/09/ES200-Datasheet-public.pdf
■![]() Virtual RTU IOx application life cycle management guide is available at the following URL:
Virtual RTU IOx application life cycle management guide is available at the following URL:
–![]() https://www.cisco.com/c/en/us/td/docs/solutions/Verticals/Utilities/FAN/Virtual- RTU/IG/CU-VRTU-IG/CU-VRTU-IG.html
https://www.cisco.com/c/en/us/td/docs/solutions/Verticals/Utilities/FAN/Virtual- RTU/IG/CU-VRTU-IG/CU-VRTU-IG.html
Alternatively, the virtual RTU application can also be installed from the Local Manager GUI. Please refer to the link for installation steps in the IOx Local Manager Guide at the following URL:
■![]() https://www.cisco.com/c/en/us/td/docs/routers/access/800/software/guides/iox/lm/reference-guide/1-2-0/iox_local_manager_ref_guide.html
https://www.cisco.com/c/en/us/td/docs/routers/access/800/software/guides/iox/lm/reference-guide/1-2-0/iox_local_manager_ref_guide.html
Launch the ES200 application and complete the following steps to configure the Control Center data points and the Outstation device points.
Control Center and IED Channel Configuration
1.![]() Launch the ES200 application and click New Project.
Launch the ES200 application and click New Project.
Figure 125 Eximprod Create New Project

Figure 126 Eximprod Create Control / Command Center
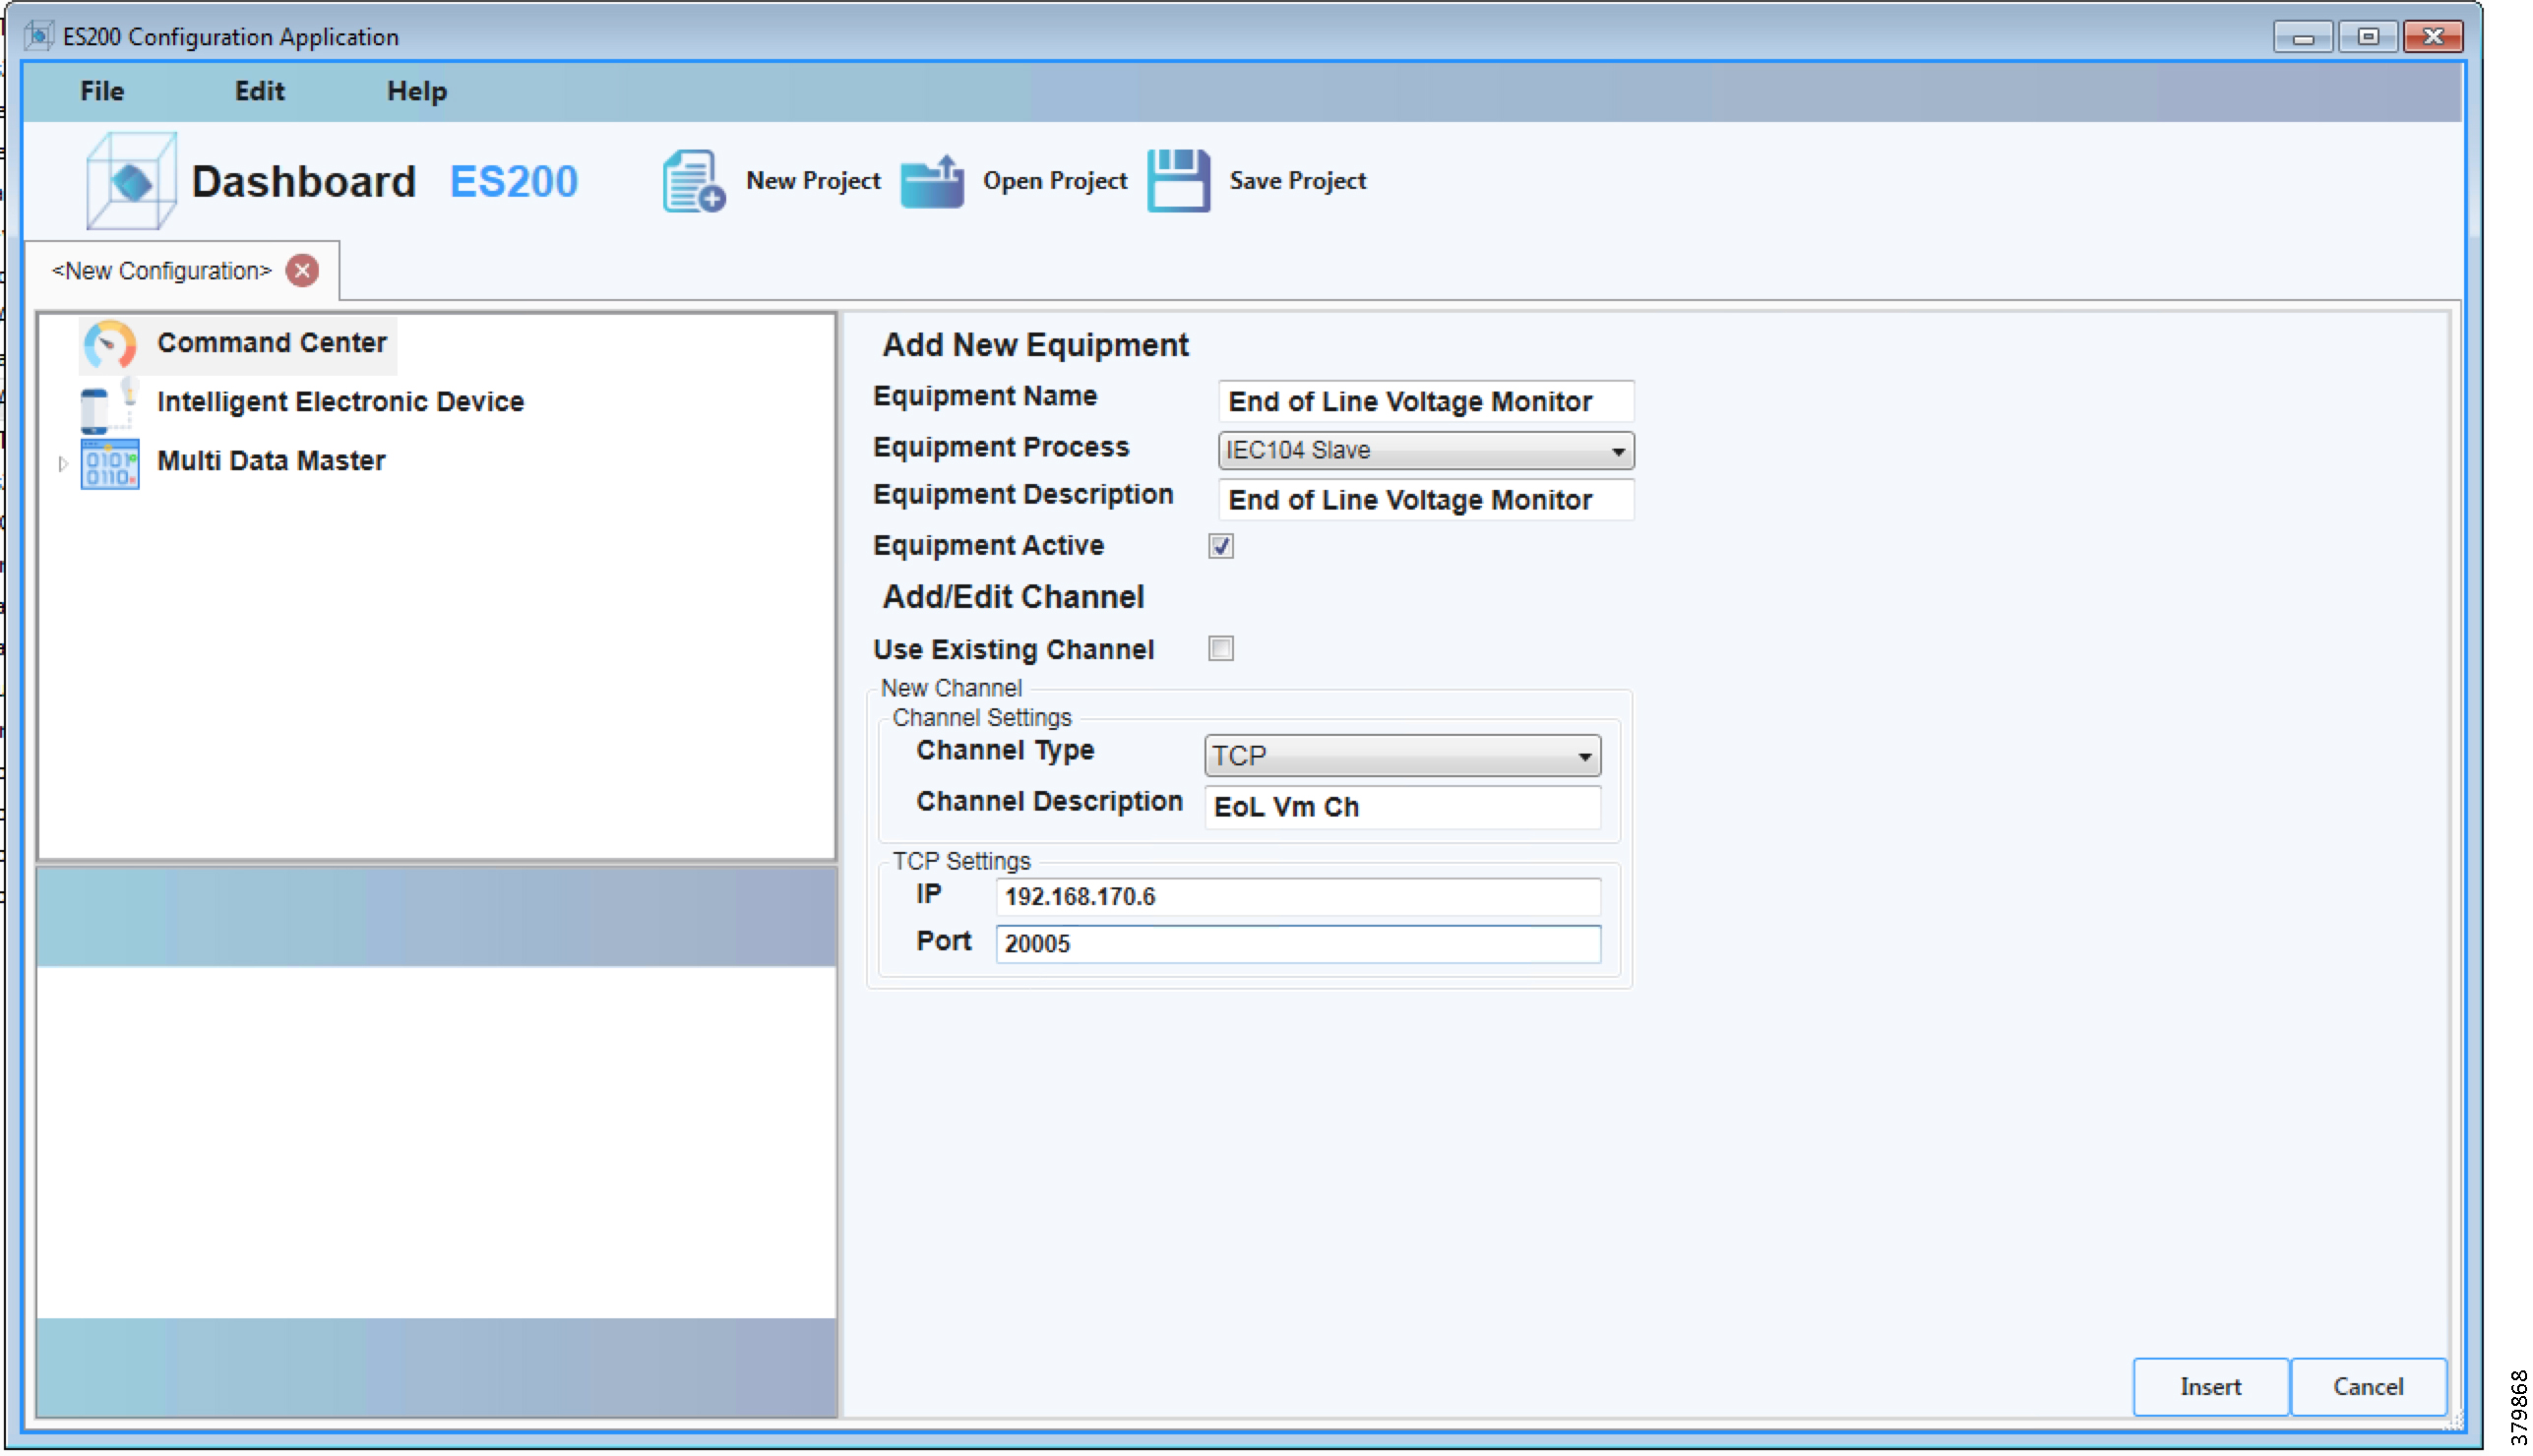
3.![]() Choose Equipment Process as IEC104 Slave and provide the SCADA Control Center IP and Port number. Continue with the default settings in other fields.
Choose Equipment Process as IEC104 Slave and provide the SCADA Control Center IP and Port number. Continue with the default settings in other fields.
Figure 127 Eximprod Create IED / Outstation
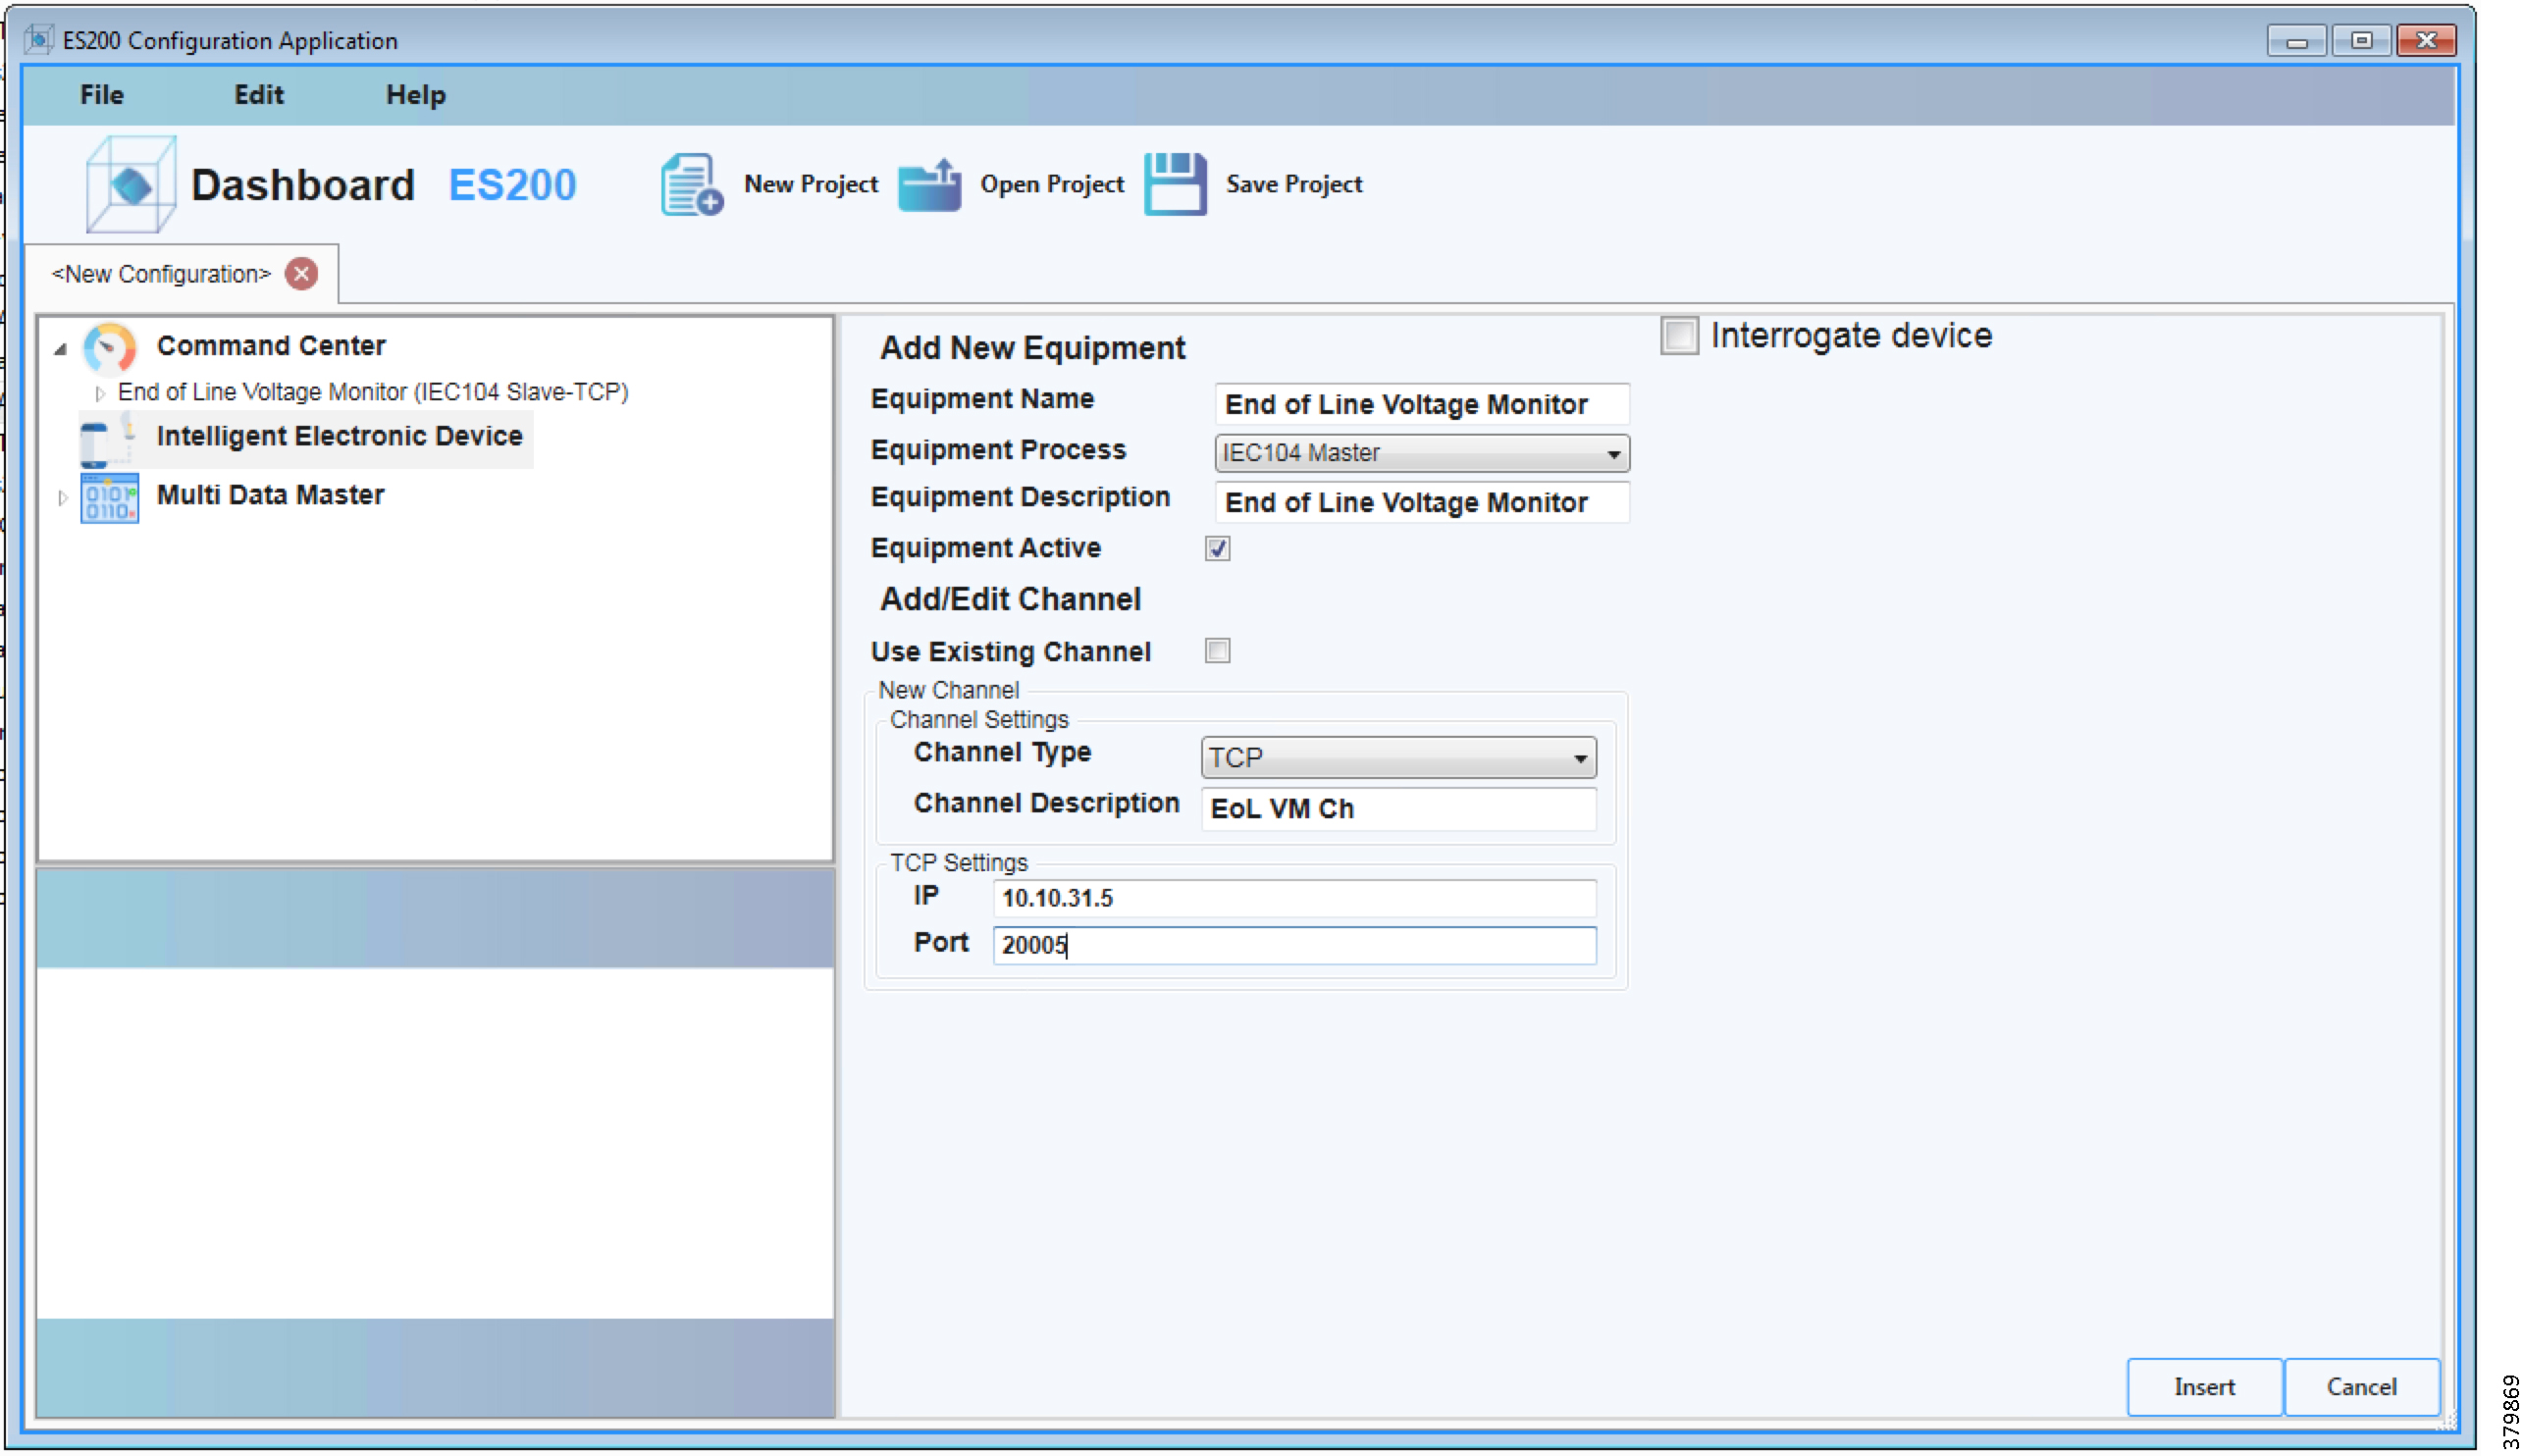
5.![]() Choose Equipment Process as IEC104 Master and provide the IED IP and Port number. Continue with the default settings in other fields.
Choose Equipment Process as IEC104 Master and provide the IED IP and Port number. Continue with the default settings in other fields.
6.![]() Repeat Steps 2 and 3 to create all Control Center and IEDs.
Repeat Steps 2 and 3 to create all Control Center and IEDs.
Figure 128 Eximprod Complete Control Center and IED Created
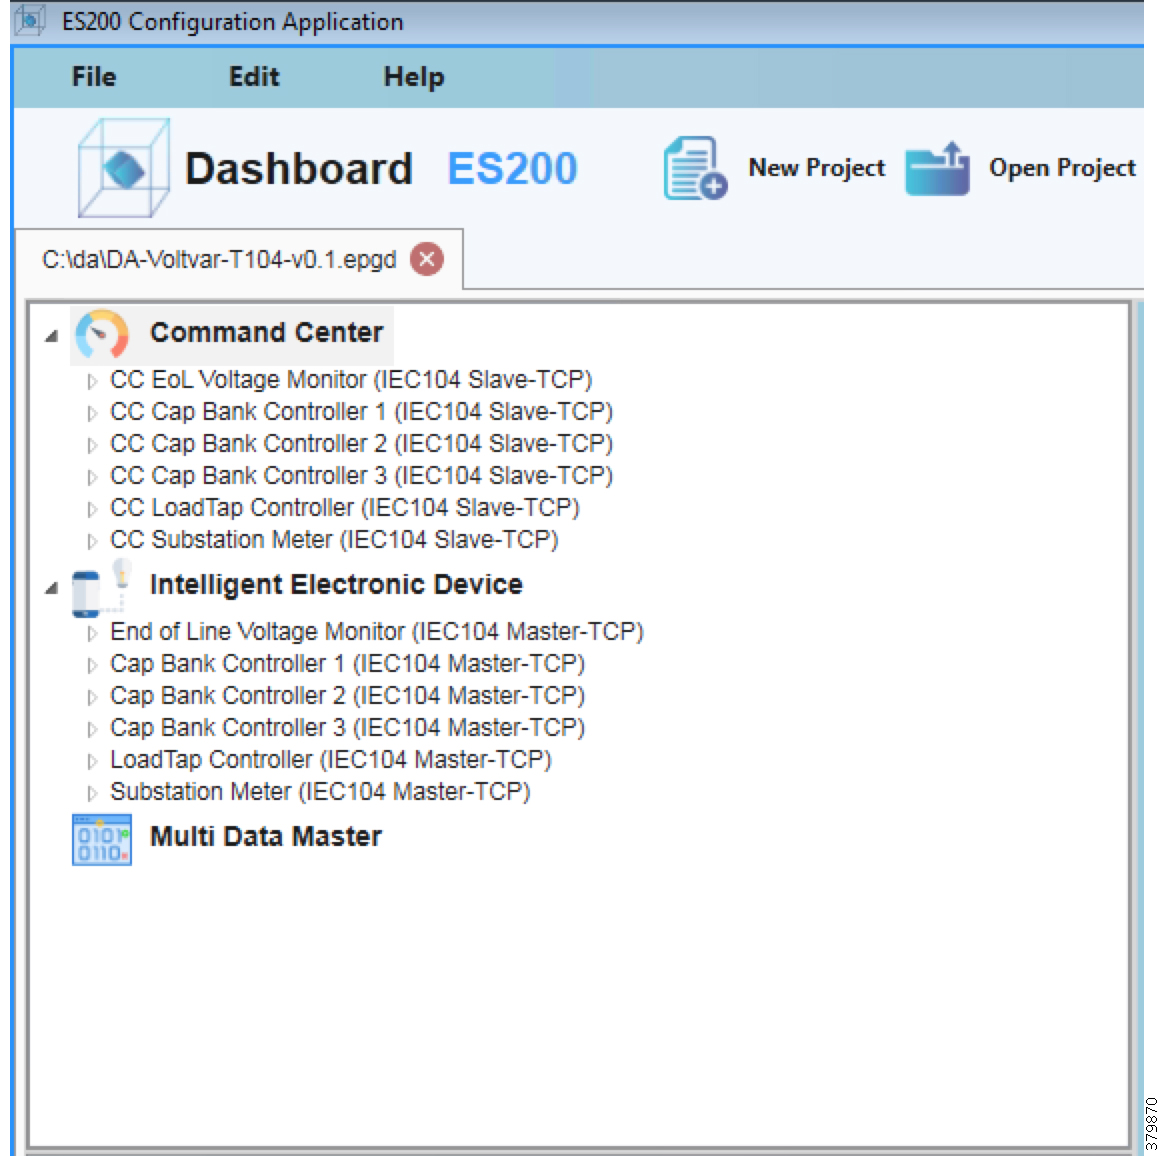
Outstation Data Points
7.![]() Create IED data points with appropriate register types. Right-click on the IED Register List to add a register.
Create IED data points with appropriate register types. Right-click on the IED Register List to add a register.
Figure 129 Eximprod IED Data Point Creation
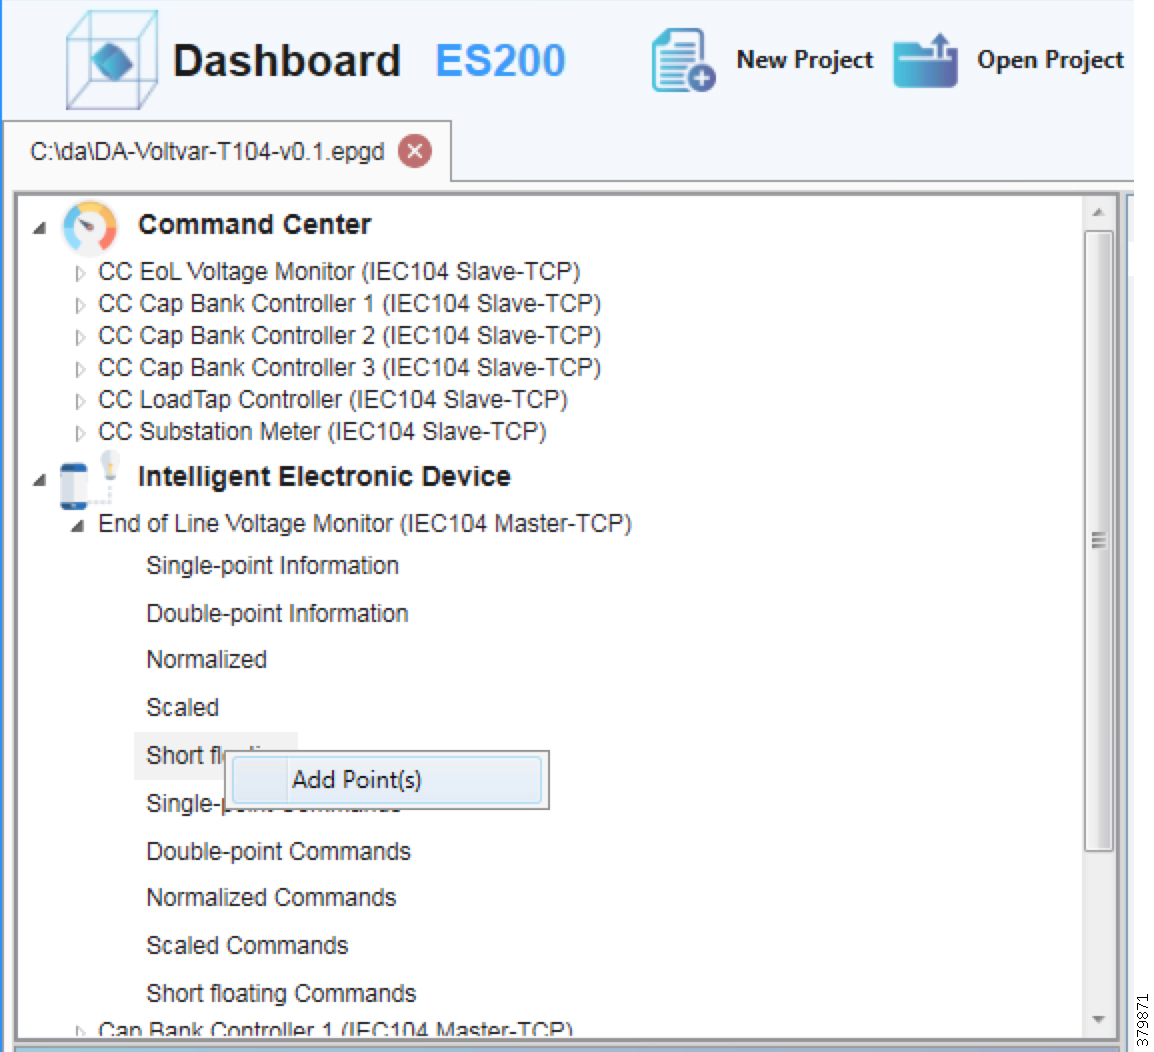
8.![]() Provide the starting address and number of register to create.
Provide the starting address and number of register to create.
Figure 130 Eximprod IED Data Point Register Configuration
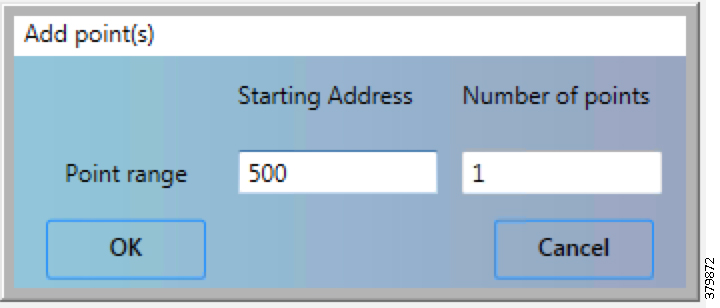
Data Points Mapping to Control Center
9.![]() Repeat Steps 5 and 6 to create Control Center data points for all the IED data points.
Repeat Steps 5 and 6 to create Control Center data points for all the IED data points.
10.![]() Map the IED data points to Control Center data points.
Map the IED data points to Control Center data points.
Figure 131 Eximprod Control Center and IED Data Points Mapping

11.![]() Map all IED data points to Control Center data points and save the database.
Map all IED data points to Control Center data points and save the database.
12.![]() To export the Virtual RTU database to Industrial Router, choose File > Export Project.
To export the Virtual RTU database to Industrial Router, choose File > Export Project.
Figure 132 Eximprod Export Project
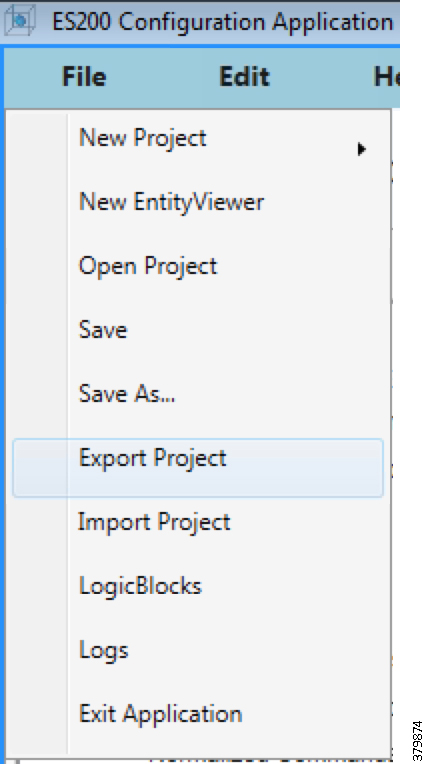
13.![]() Provide IOx IP, SSH Port, username and PEM file as private key file and then click Connect.
Provide IOx IP, SSH Port, username and PEM file as private key file and then click Connect.
Figure 133 Eximprod Export Project - Connect to ESRemote
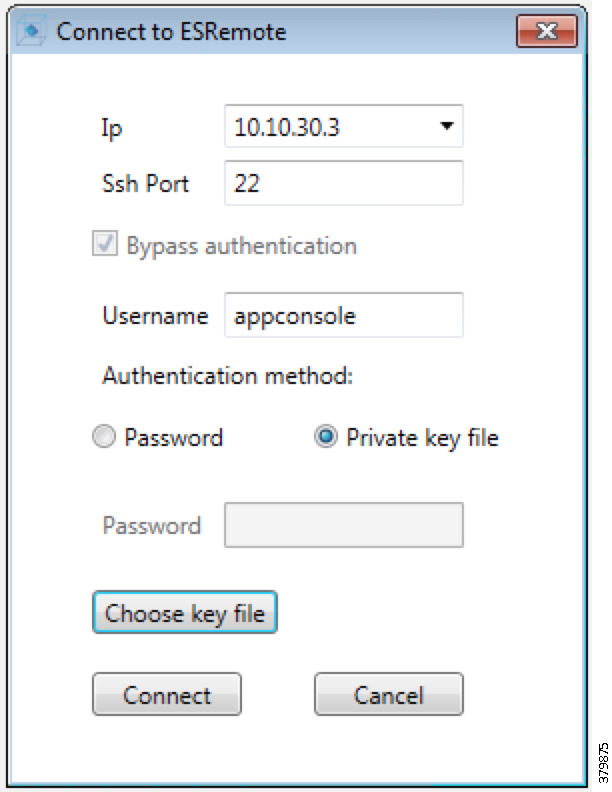
14.![]() Choose the correct database to export from the Open dialogue box. Click OK to continue.
Choose the correct database to export from the Open dialogue box. Click OK to continue.
Figure 134 Eximprod License Info

Figure 135 Eximprod DB Upload Status
VAR Control (Power Factor Regulation)
VAR Control is achieved with the Capacitor Bank Controller On/Off operation.
Event Sequence Diagram
Figure 136 Volt/VAR—VAR Control Sequence Diagram
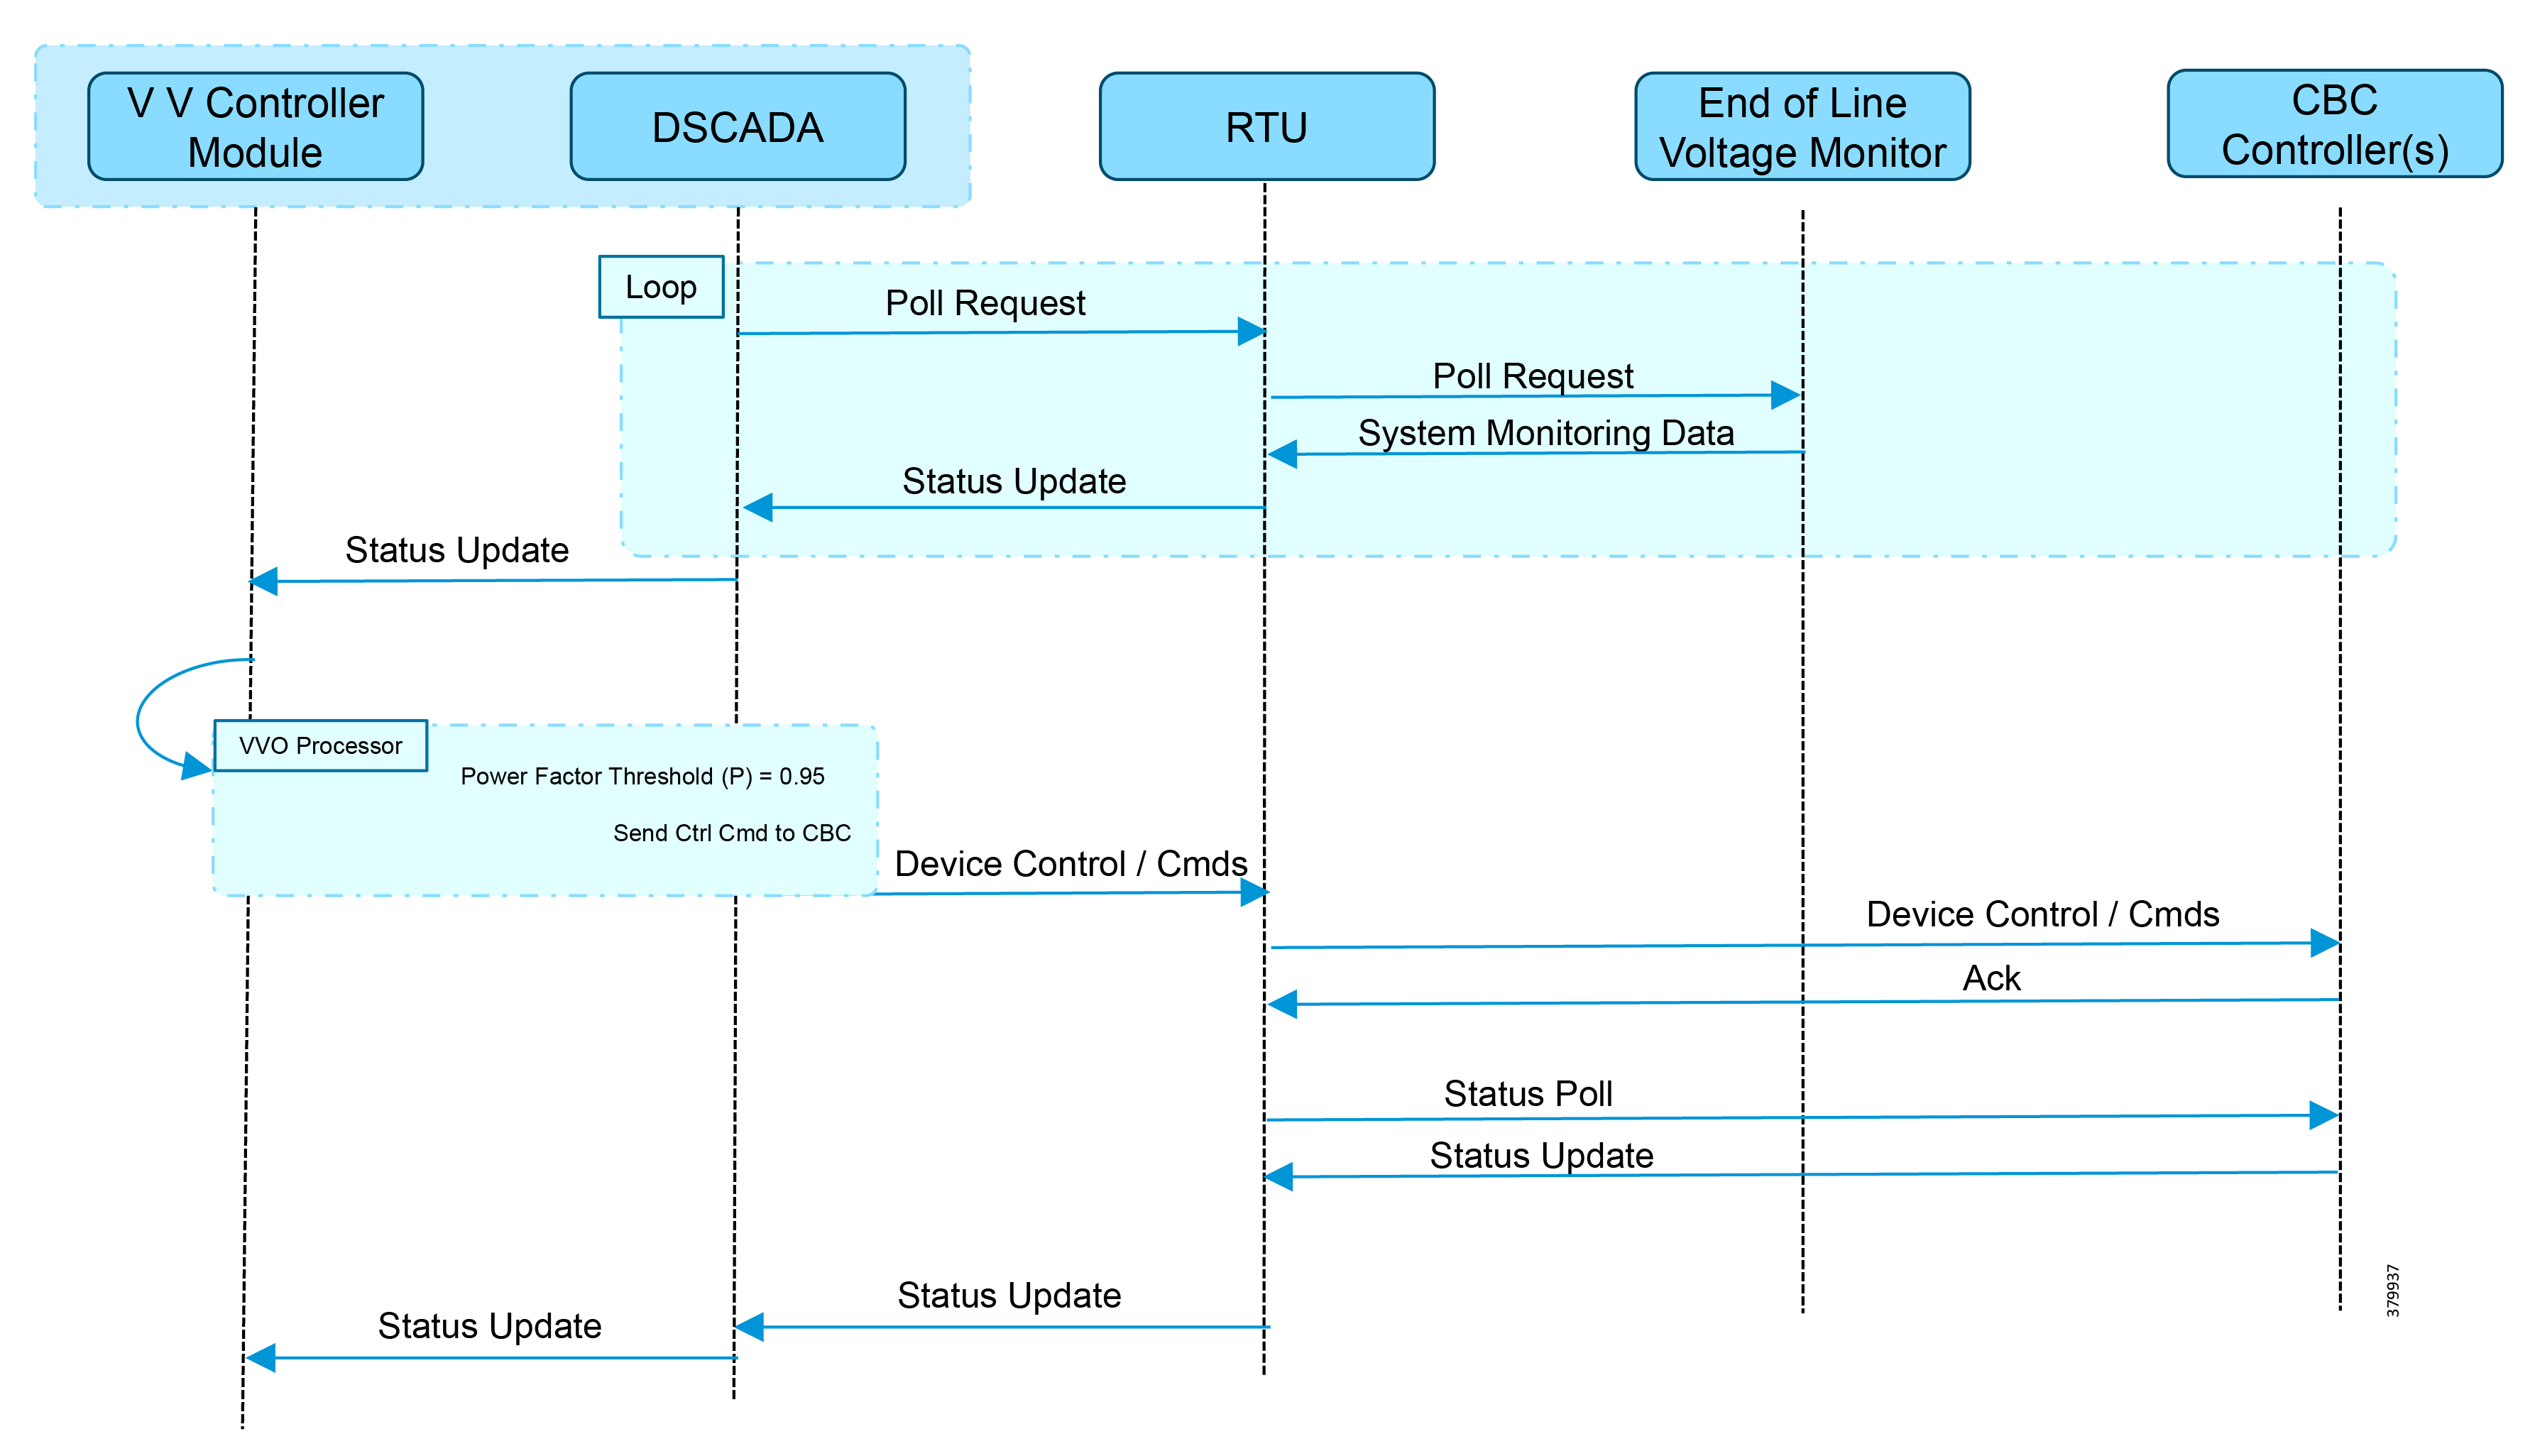
Use Case Steps
1.![]() Event class data poll to the following devices from the RTU:
Event class data poll to the following devices from the RTU:
–![]() Substation meter, poll Measured Value (Short Floating Point) registers
Substation meter, poll Measured Value (Short Floating Point) registers
–![]() All Capacitor Bank Controller(s), poll Measured Value (Short Floating Point) and Double Point registers
All Capacitor Bank Controller(s), poll Measured Value (Short Floating Point) and Double Point registers
–![]() End-of-Line voltage monitor, poll Measured Value (Short Floating Point) register
End-of-Line voltage monitor, poll Measured Value (Short Floating Point) register
2.![]() The Volt/VAR Optimization processor processes the data received from the devices and makes a control command decision based on the power factor calculation.
The Volt/VAR Optimization processor processes the data received from the devices and makes a control command decision based on the power factor calculation.
3.![]() The control command is sent to the RTU via SCADA to the capacitor banks to close capacitor bank controller N by writing in a Double Point Register of T104.
The control command is sent to the RTU via SCADA to the capacitor banks to close capacitor bank controller N by writing in a Double Point Register of T104.
4.![]() Event class data poll to the following devices from the RTU:
Event class data poll to the following devices from the RTU:
–![]() Substation meter, poll Measured Value (Short Floating Point) registers
Substation meter, poll Measured Value (Short Floating Point) registers
–![]() All Capacitor Bank Controller(s), poll Measured Value (Short Floating Point) and Double Point registers
All Capacitor Bank Controller(s), poll Measured Value (Short Floating Point) and Double Point registers
–![]() End-of-Line voltage monitor, poll Measured Value (Short Floating Point) register
End-of-Line voltage monitor, poll Measured Value (Short Floating Point) register
5.![]() The above steps are repeated for all the capacitor bank controllers on the feeder line to maintain a power factor value always close to value 1.
The above steps are repeated for all the capacitor bank controllers on the feeder line to maintain a power factor value always close to value 1.
VAR Control Use Case Simulation
1.![]() Import the Volt/VAR workspace, which is available in Appendix E: End-to-End Application Use Case Scenarios.
Import the Volt/VAR workspace, which is available in Appendix E: End-to-End Application Use Case Scenarios.
Figure 137 DTM Import Workspace
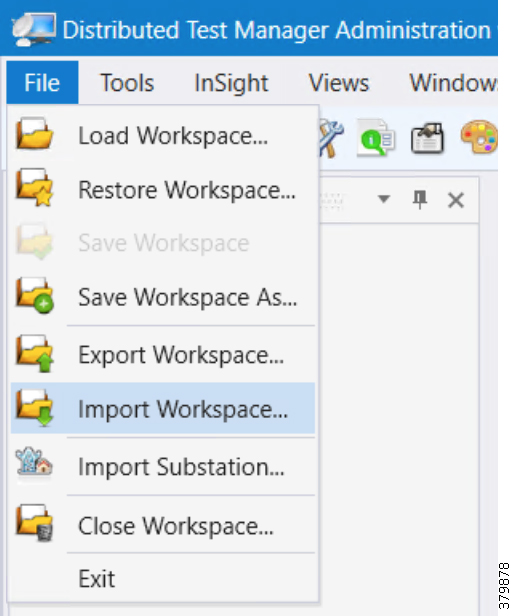
2.![]() Start all the host machines.
Start all the host machines.
Figure 138 DTM VVC Start All Hosts
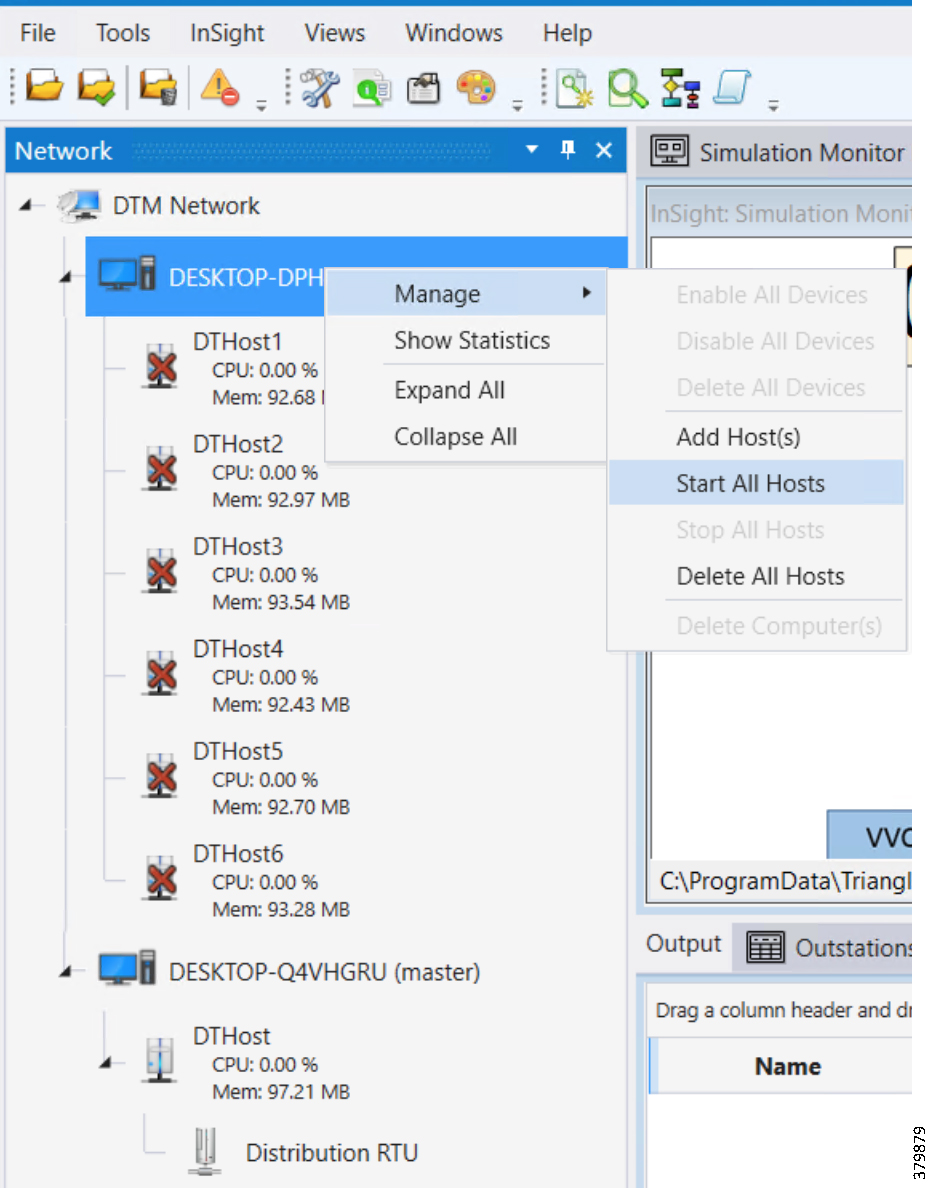
3.![]() Update the Remote IP address of all the RTU devices.
Update the Remote IP address of all the RTU devices.
Figure 139 DTM VVC Channel IP Config
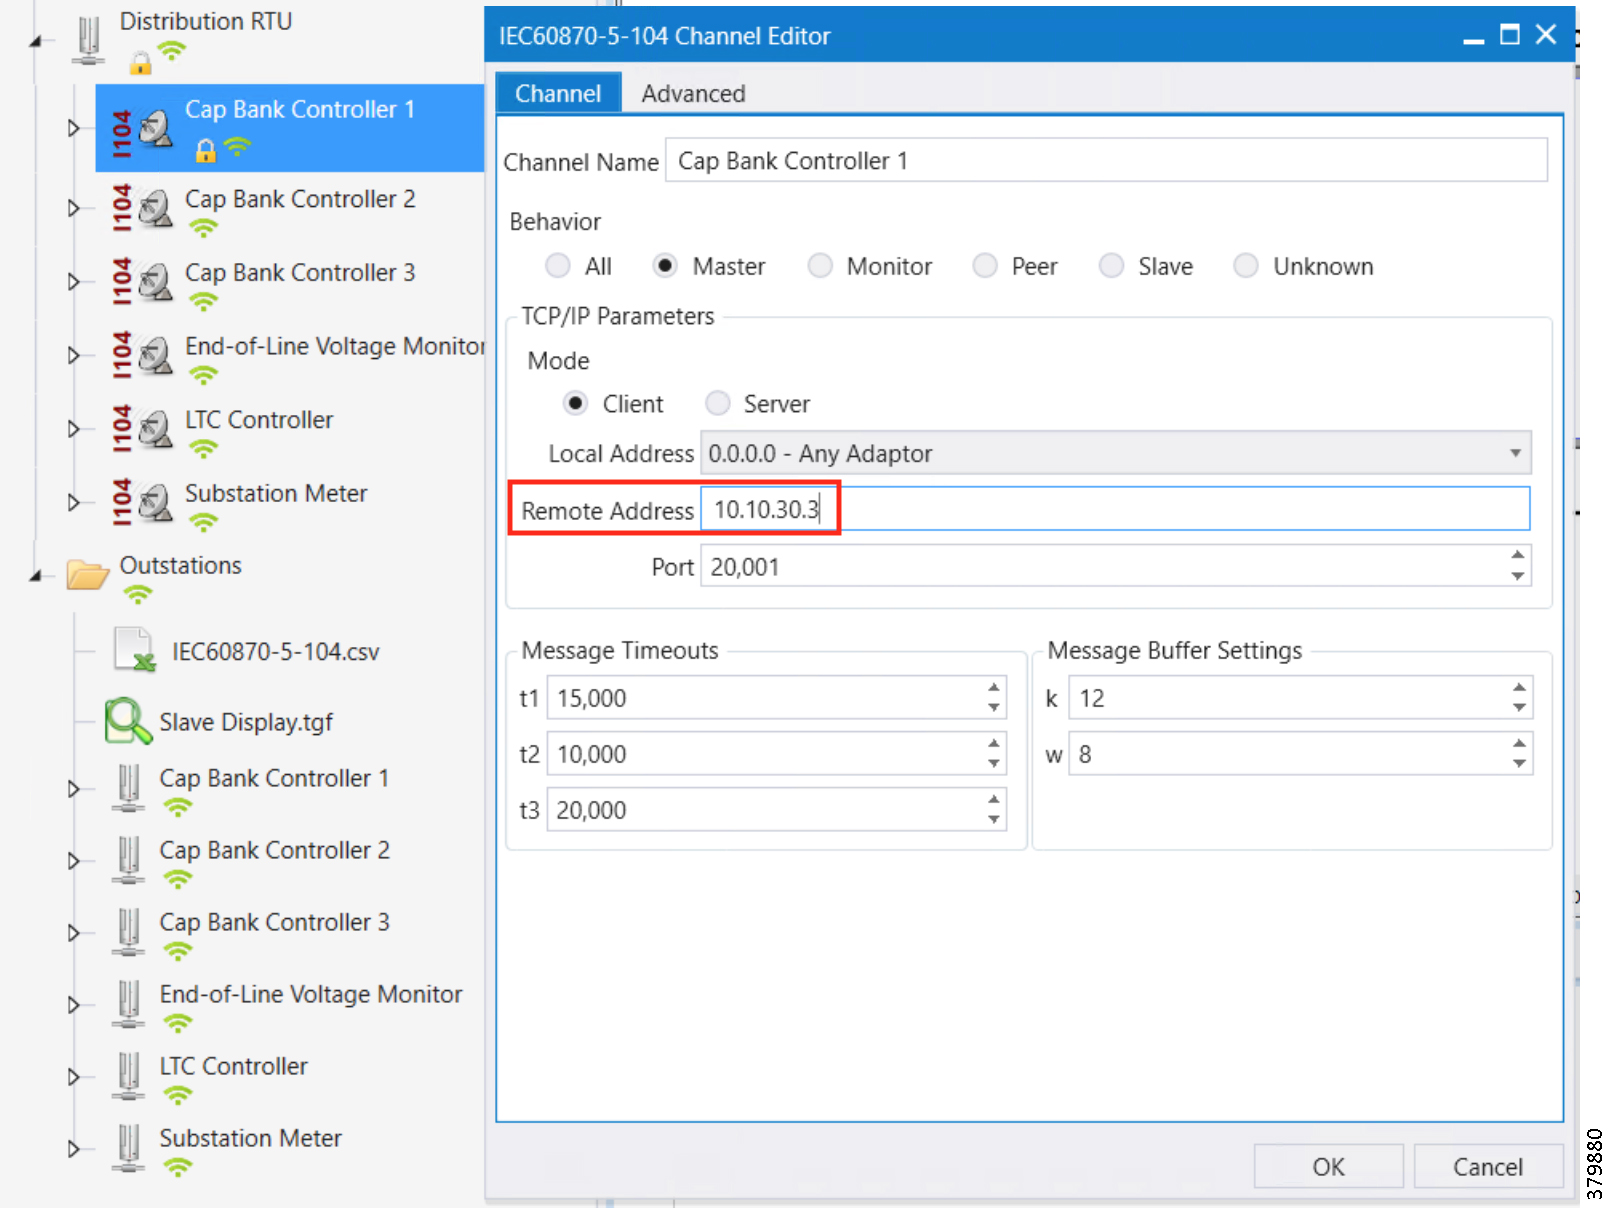
4.![]() Make sure all the channels are connected.
Make sure all the channels are connected.
Figure 140 DTM VVC Channel Status
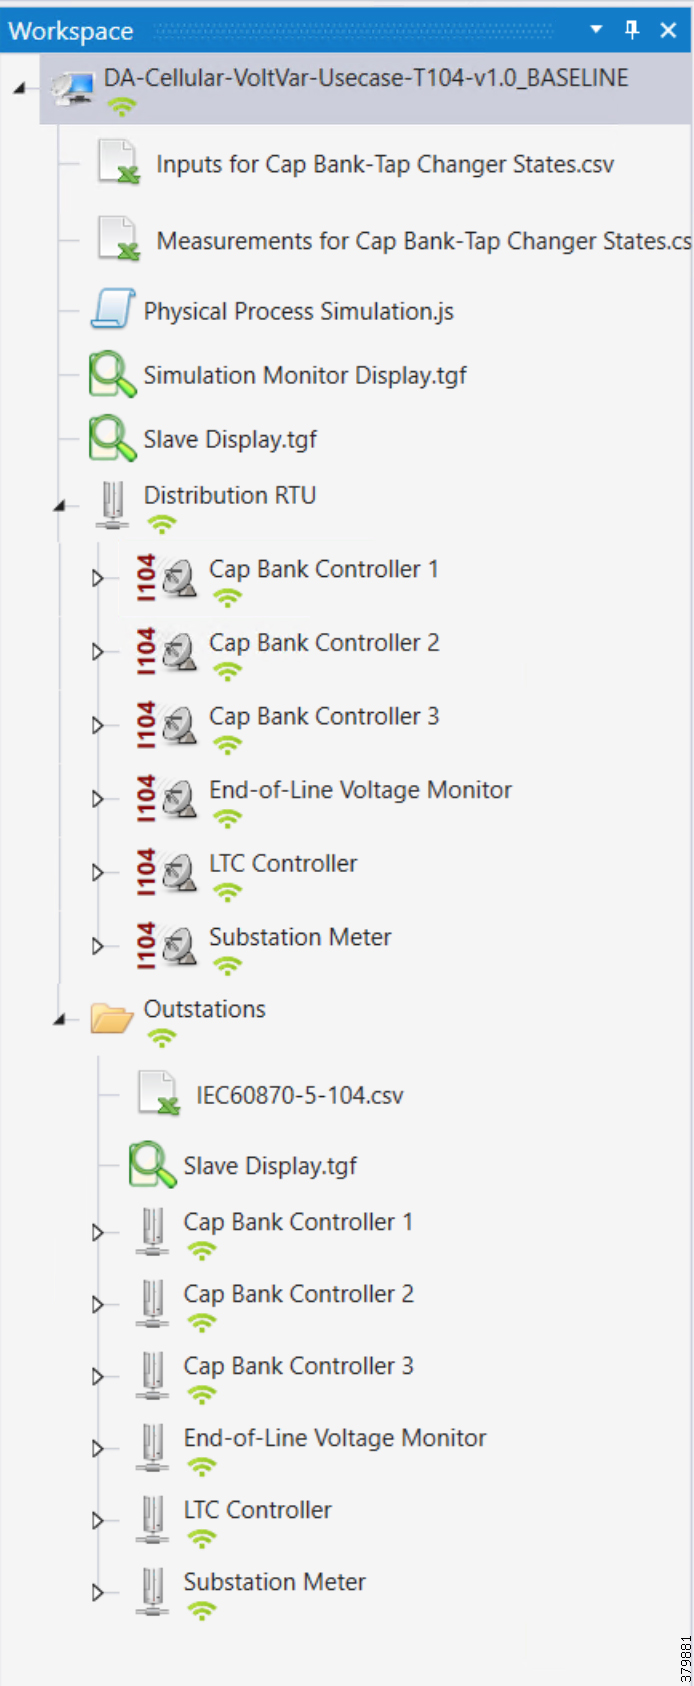
Figure 141 DTM VVC Start All Scripts
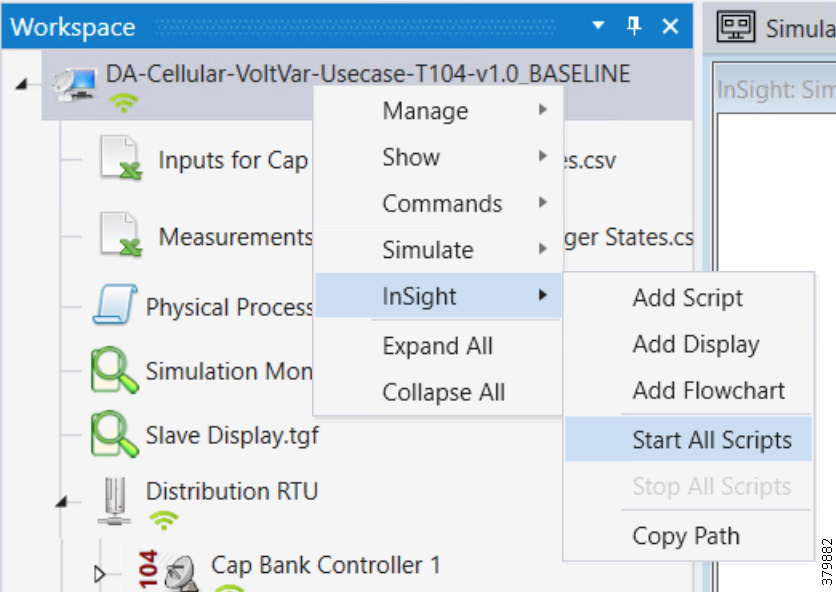
6.![]() Start the simulation by clicking Auto Play or Next.
Start the simulation by clicking Auto Play or Next.
Figure 142 DTM VVC Simulation Auto Play
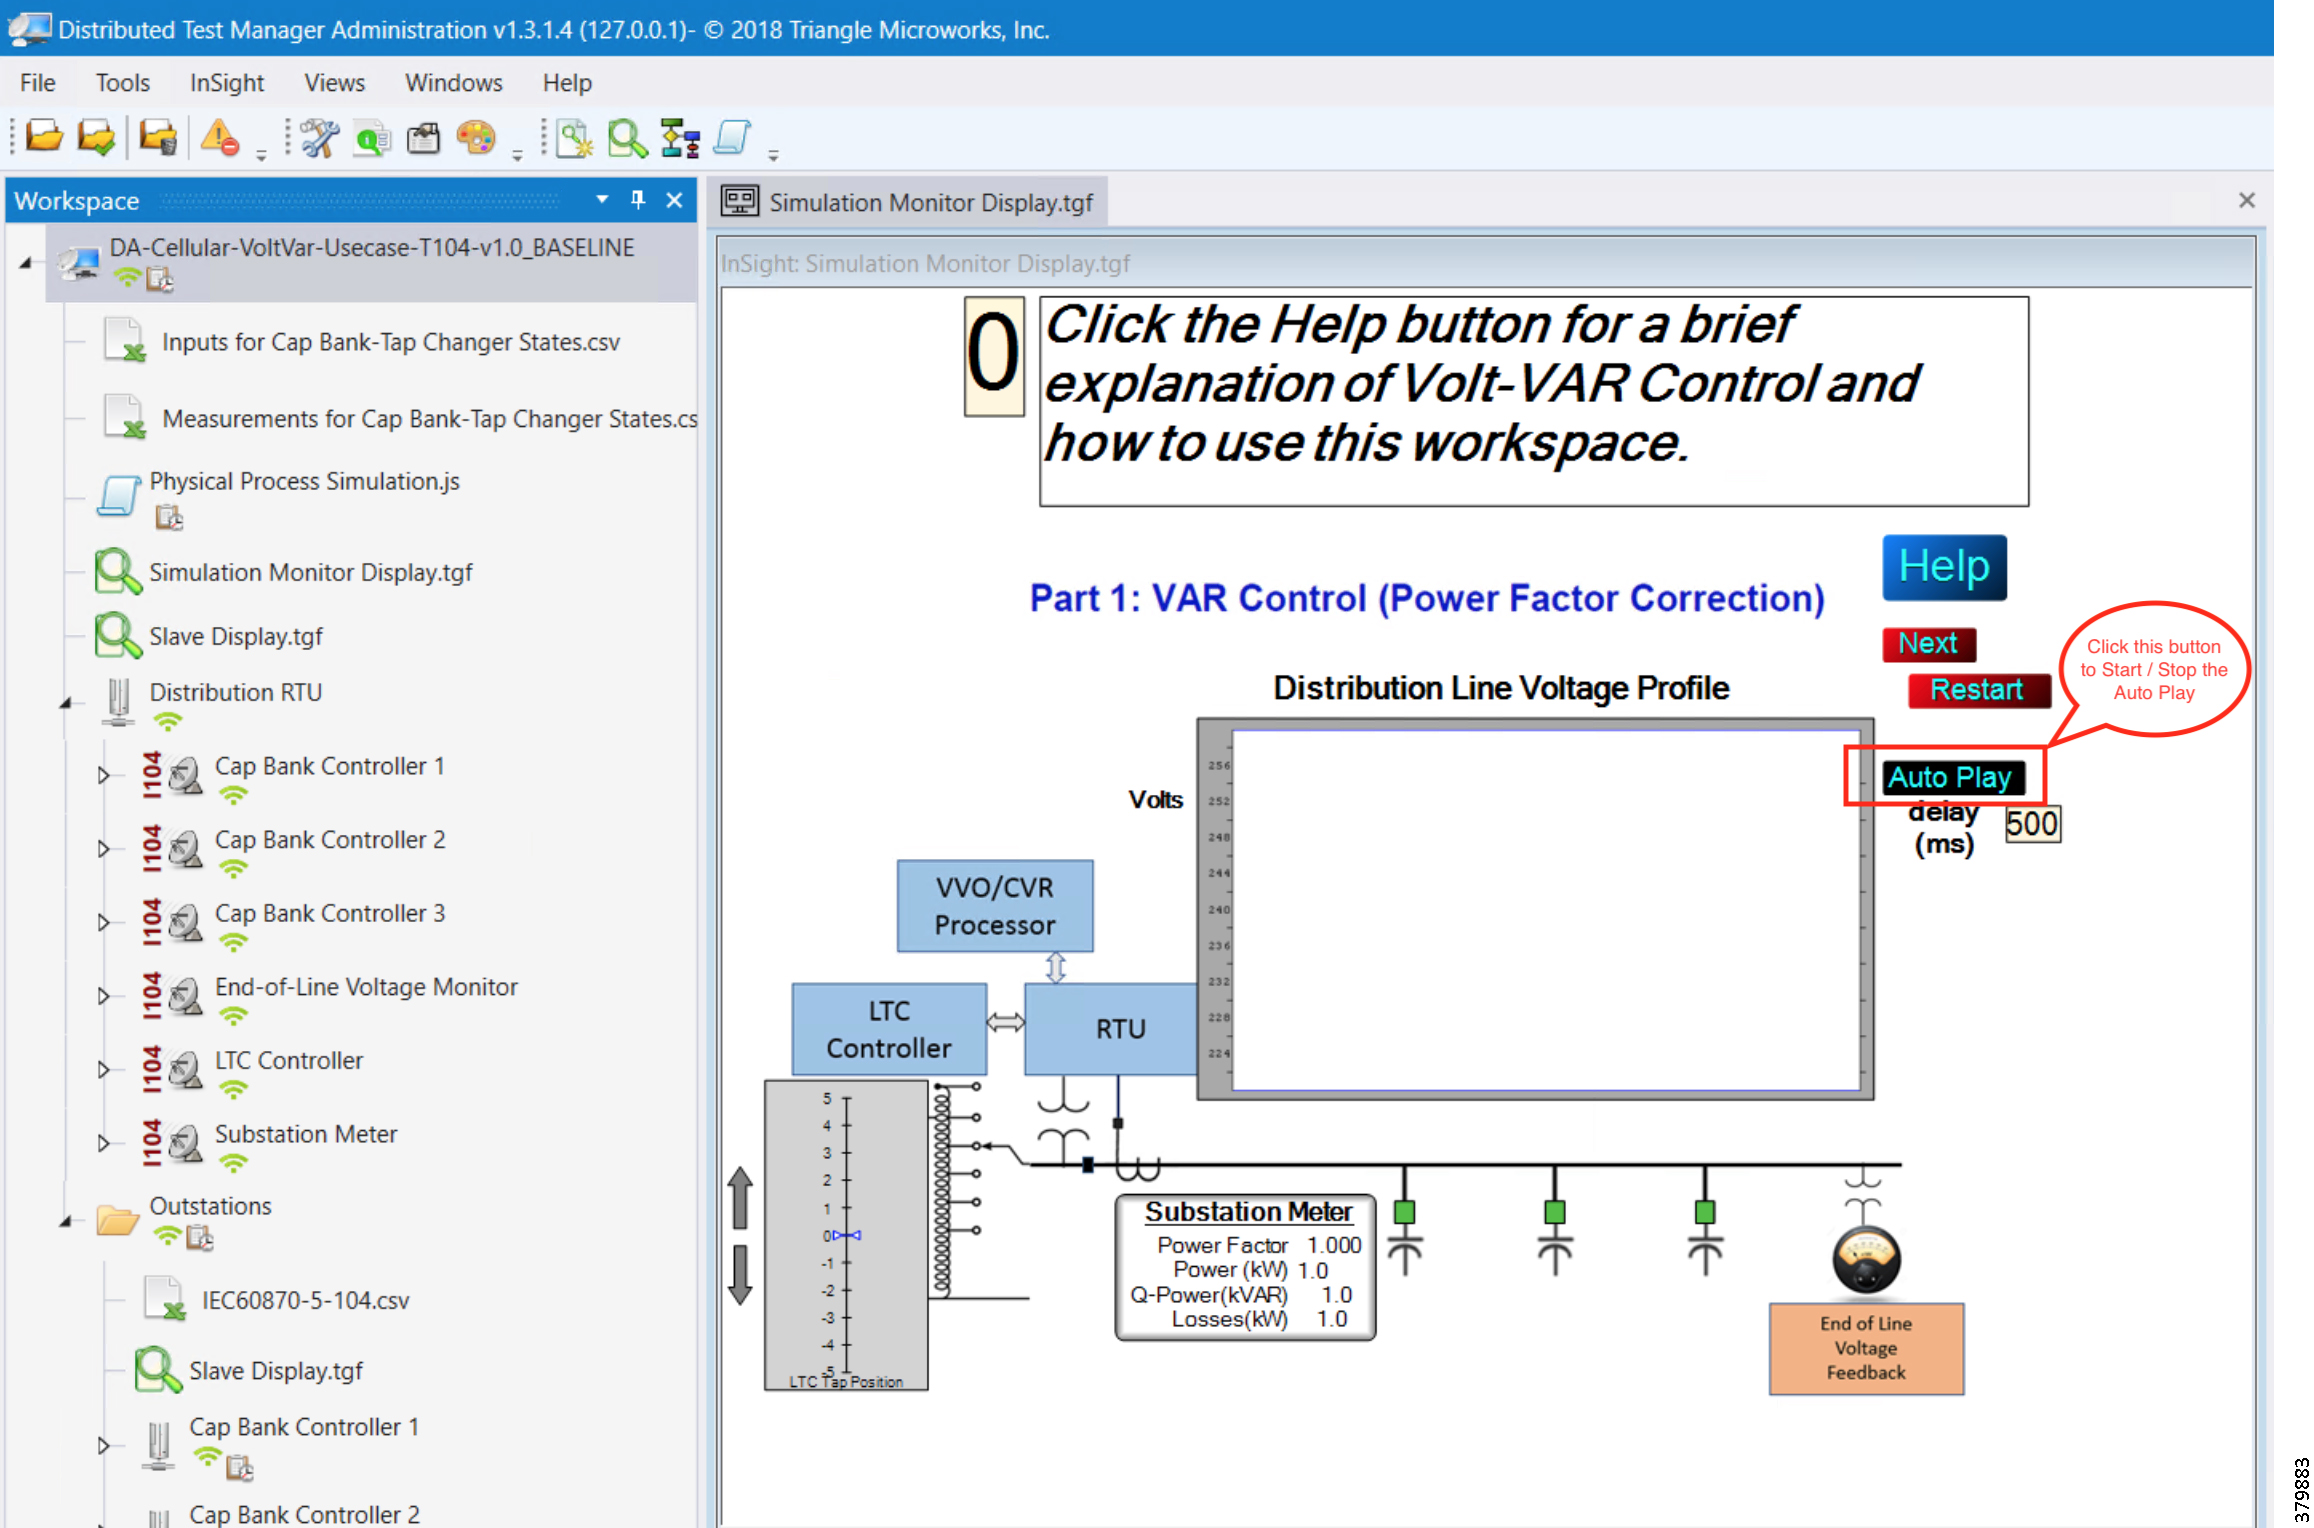
7.![]() The script, initialize the Outstation data points to default values.
The script, initialize the Outstation data points to default values.
Figure 143 DTM VVC Data Points Initialization
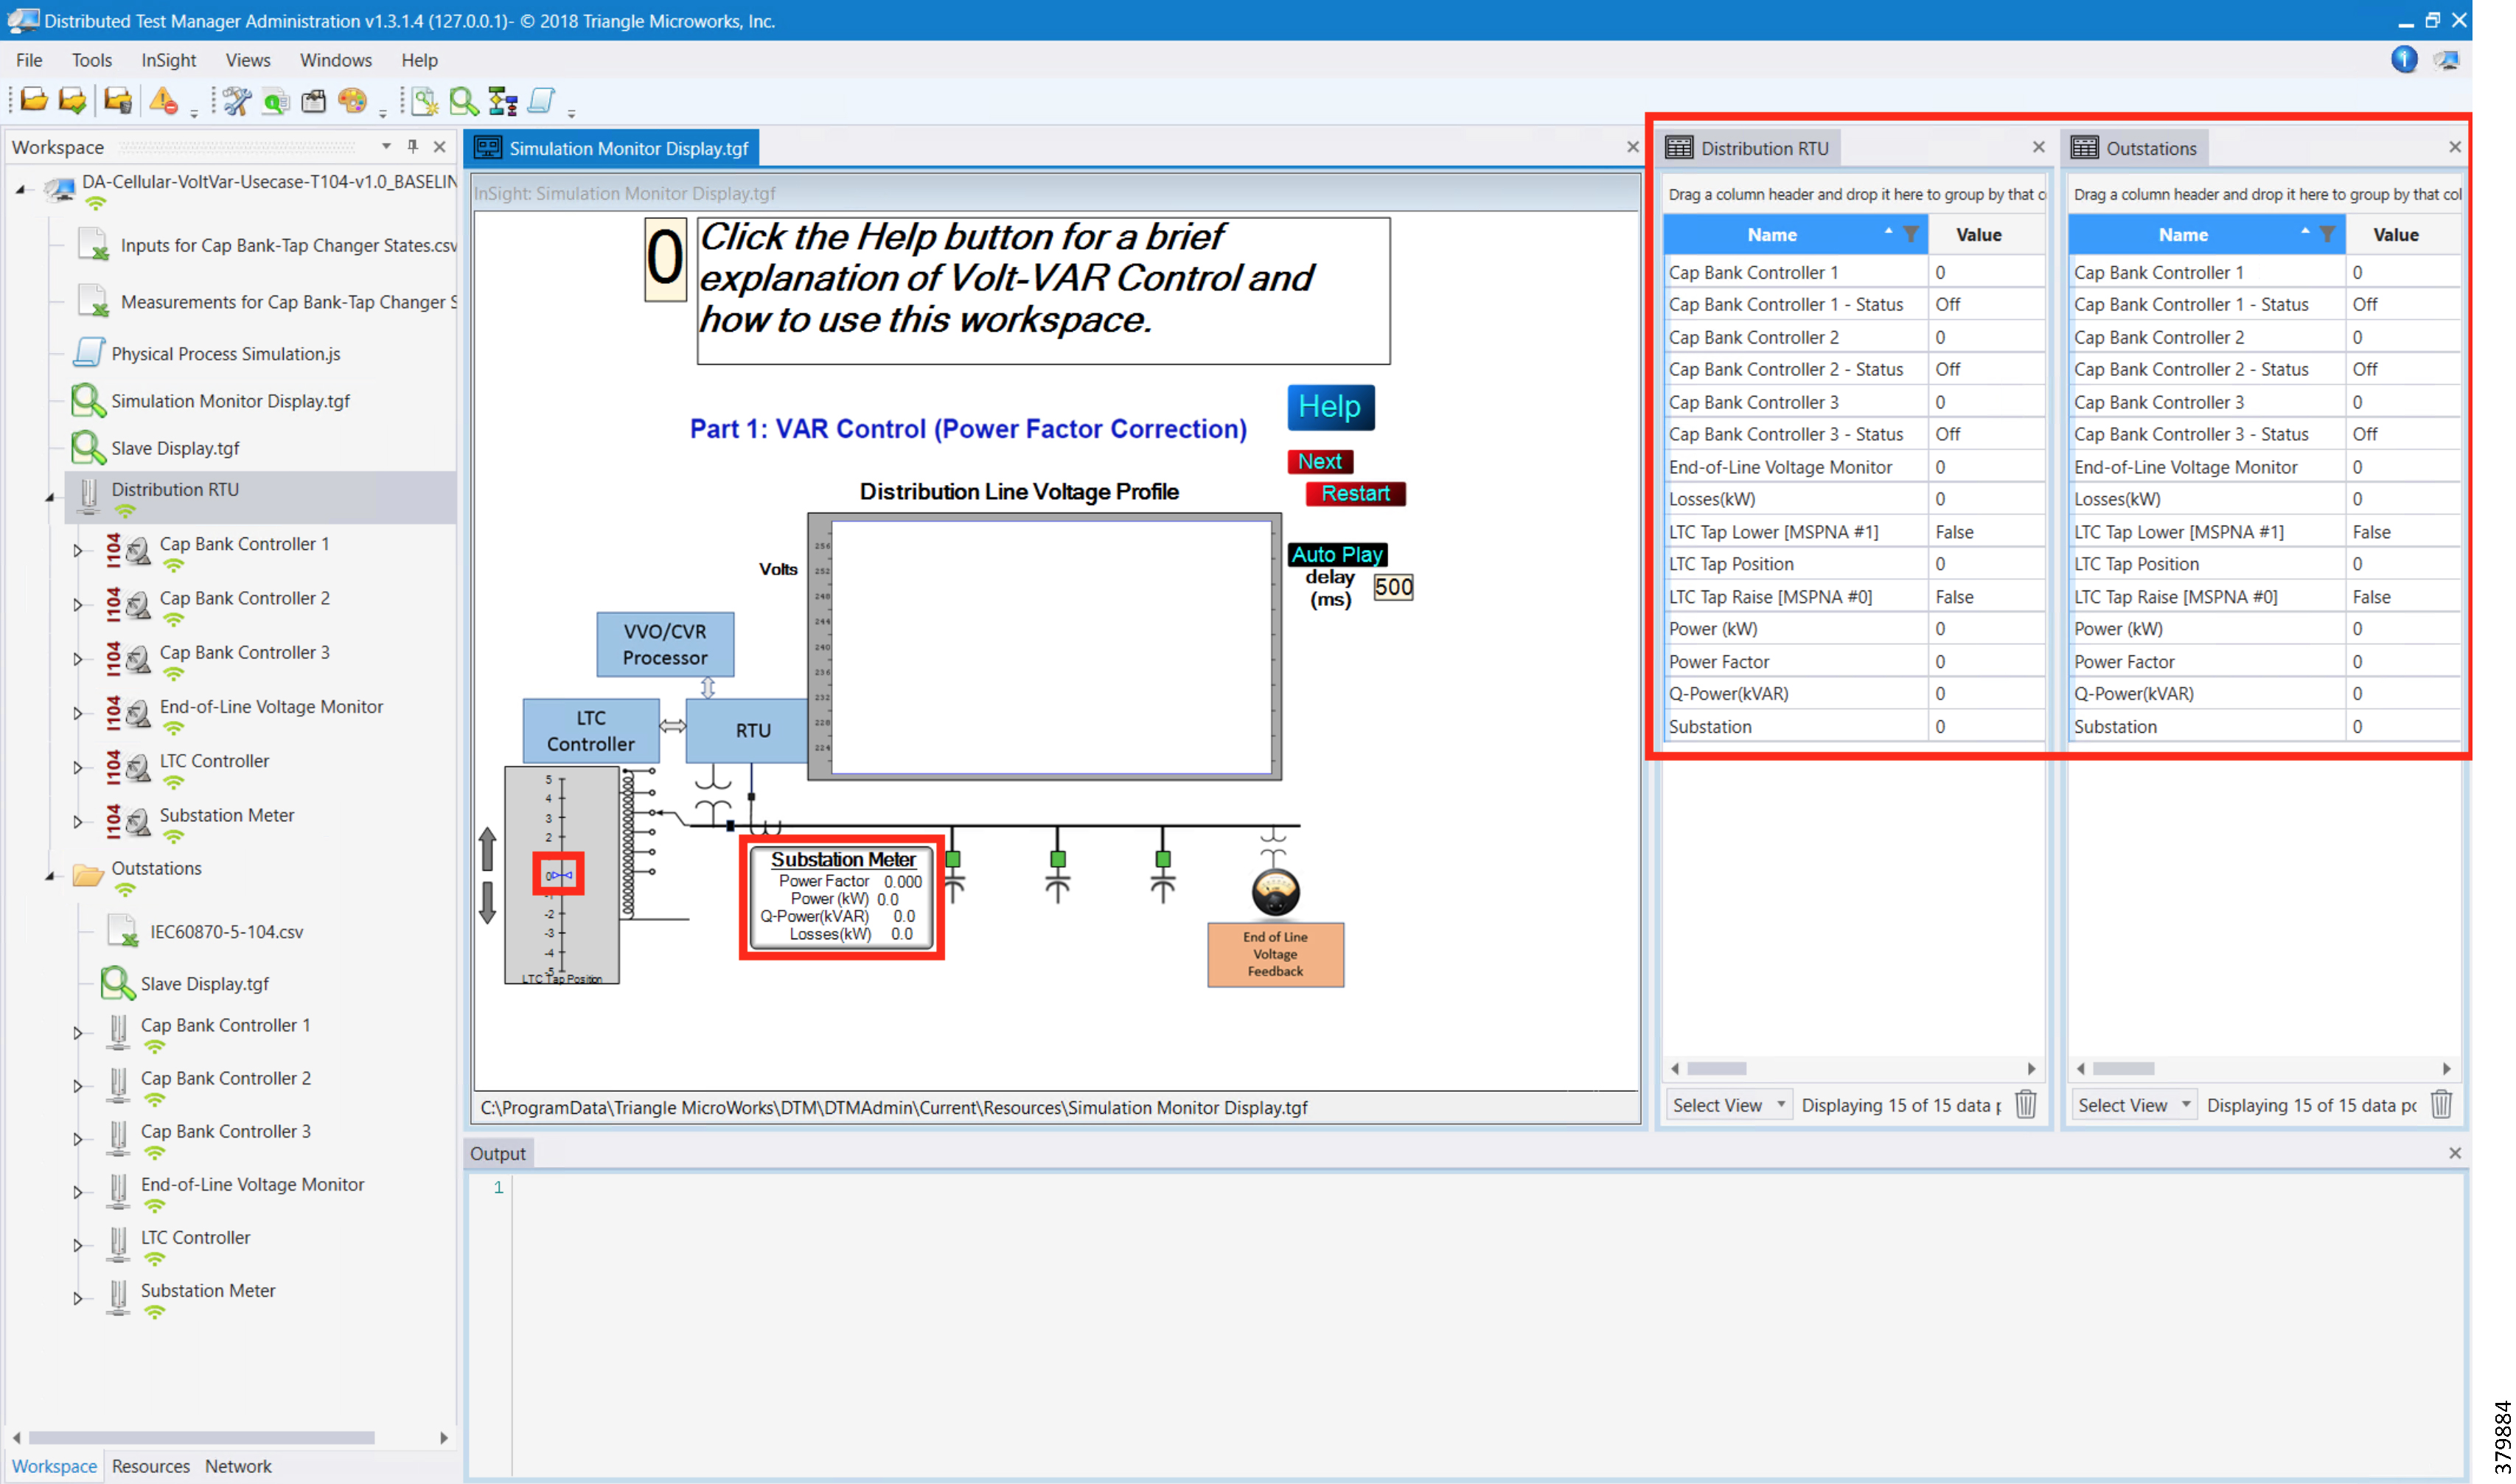
8.![]() Data points from the two CSV files are applied appropriately by the simulation script to simulate the real time Volt/VAR events sequence.
Data points from the two CSV files are applied appropriately by the simulation script to simulate the real time Volt/VAR events sequence.
Figure 144 DTM VVC Event Class Polling
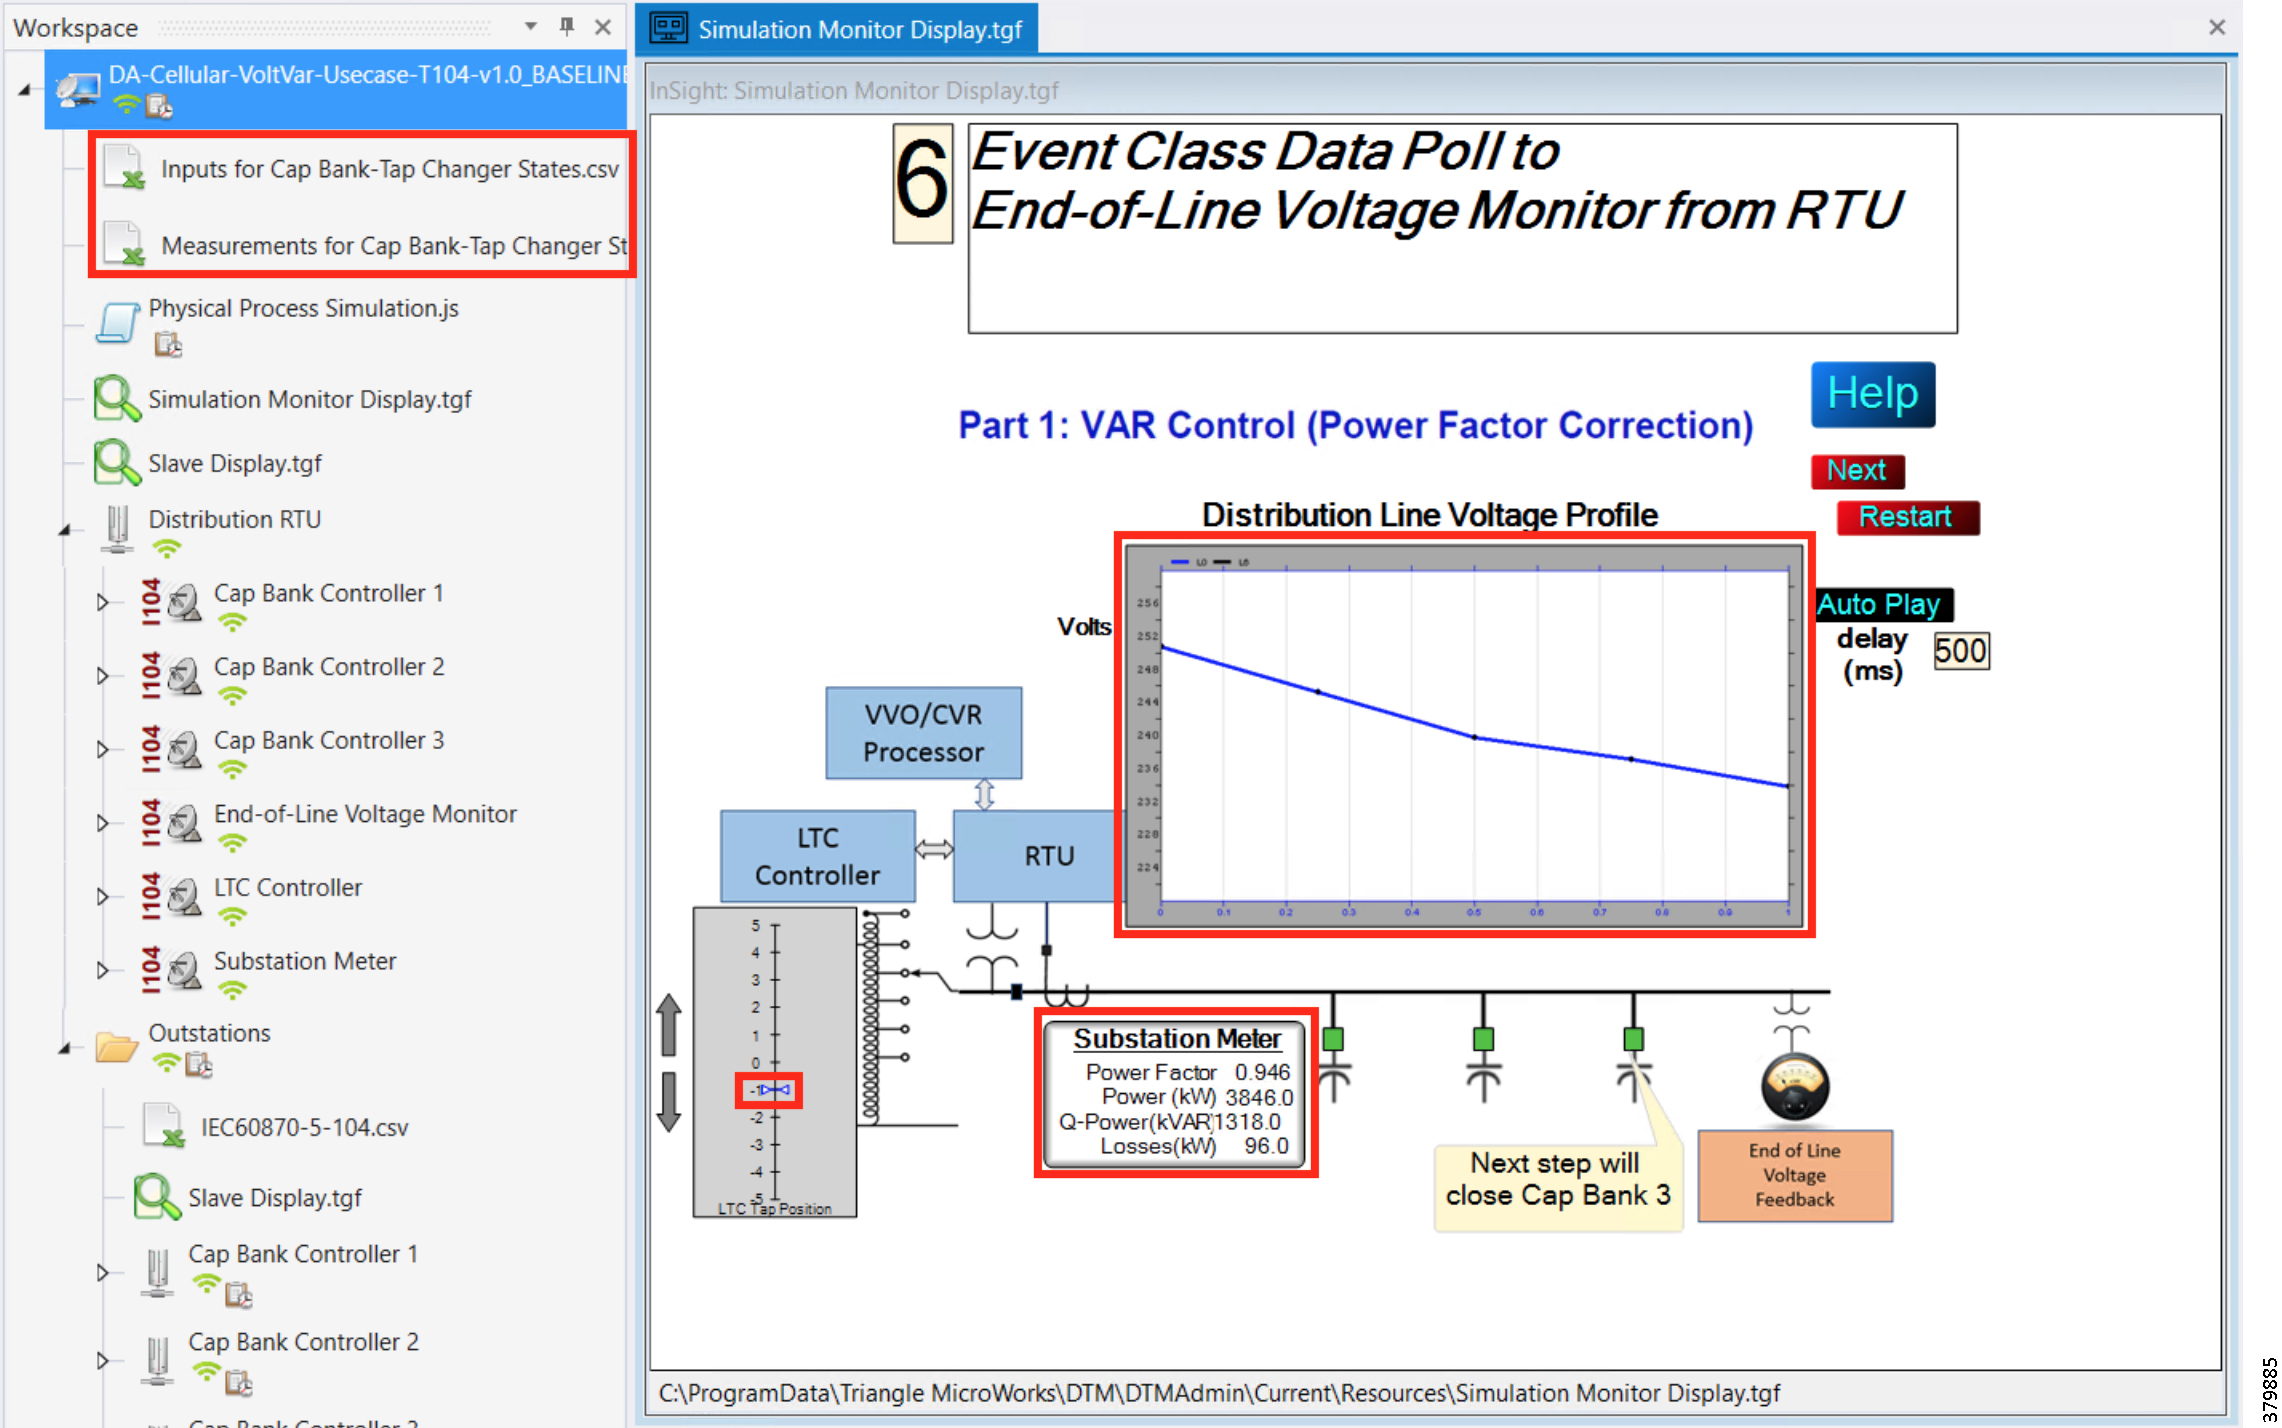
9.![]() The Volt/VAR Optimization processor processes the data received from the devices and makes a control command decision based on the power factor calculation.
The Volt/VAR Optimization processor processes the data received from the devices and makes a control command decision based on the power factor calculation.
10.![]() The control command is sent to the RTU via SCADA to the capacitor banks to close the Capacitor Bank Controller 3.
The control command is sent to the RTU via SCADA to the capacitor banks to close the Capacitor Bank Controller 3.
Figure 145 DTM VVC Cap Bank Controller Closing
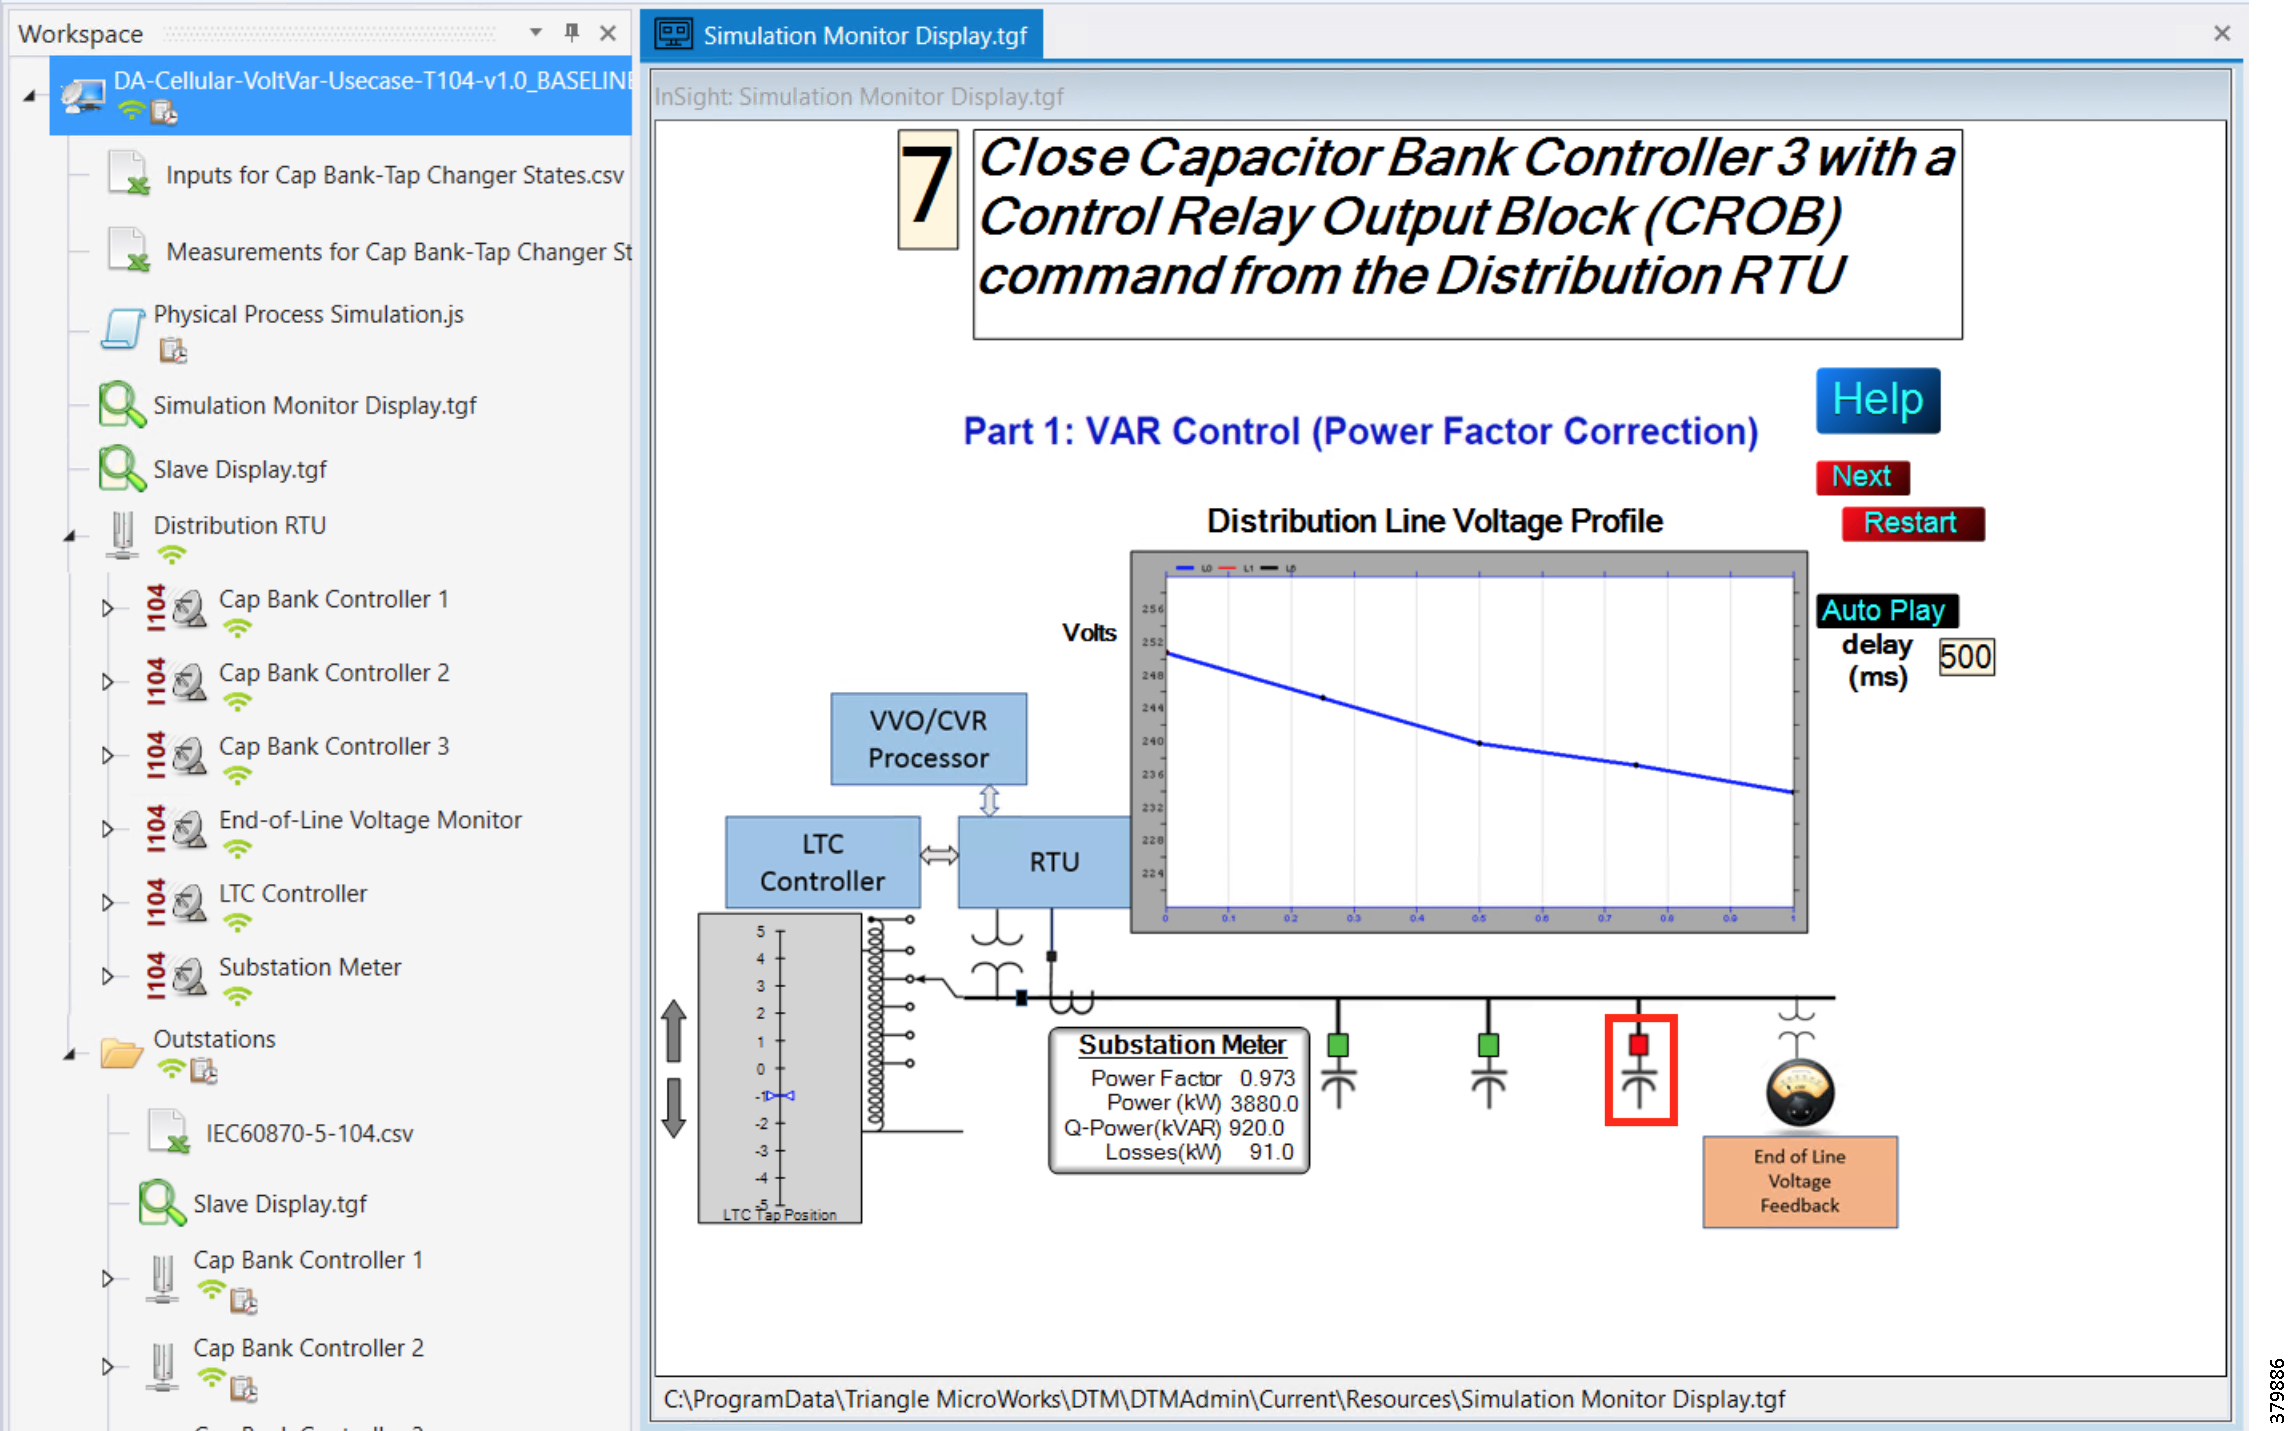
11.![]() Event class data poll to the following devices from the RTU:
Event class data poll to the following devices from the RTU:
–![]() Substation meter, poll Measured Value (Short Floating Point) registers
Substation meter, poll Measured Value (Short Floating Point) registers
–![]() All Capacitor Bank Controller(s), poll Measured Value (Short Floating Point) and Double Point registers
All Capacitor Bank Controller(s), poll Measured Value (Short Floating Point) and Double Point registers
–![]() End-of-Line voltage monitor, poll Measured Value (Short Floating Point) register
End-of-Line voltage monitor, poll Measured Value (Short Floating Point) register
Figure 146 DTM VVC Event Class Polling with CBC3 Closed
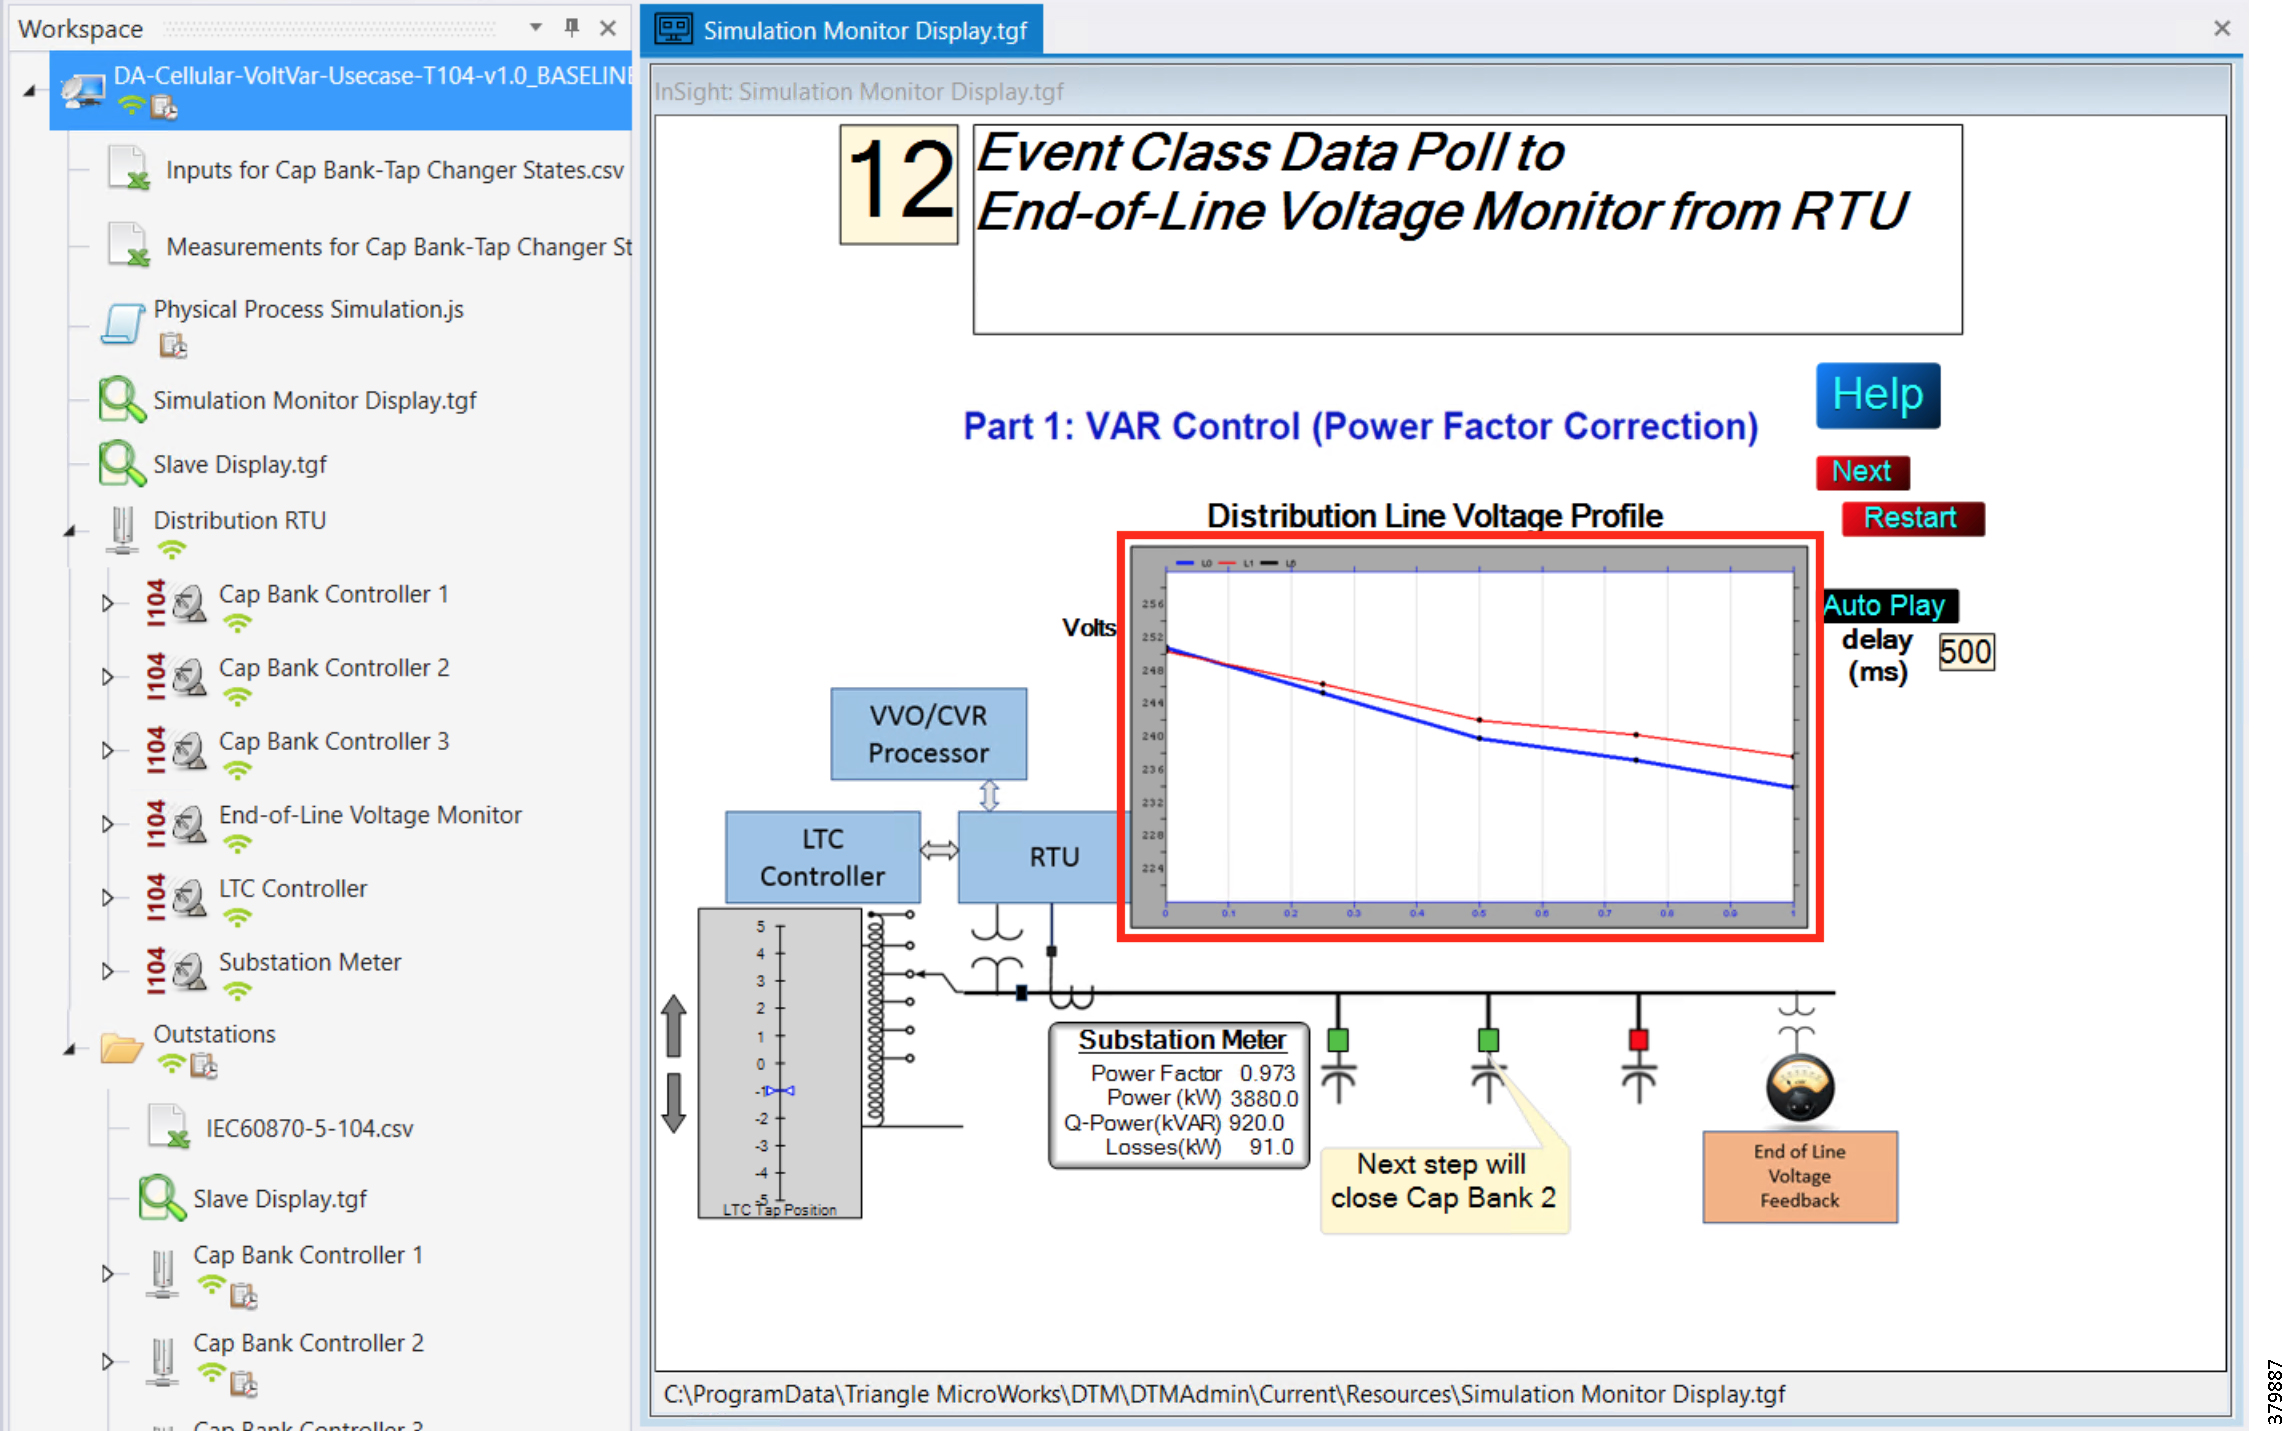
12.![]() All the above steps are repeated for all capacitor bank controllers on the feeder line to maintain a power factor value always close to 1 at all the points in the feeder line.
All the above steps are repeated for all capacitor bank controllers on the feeder line to maintain a power factor value always close to 1 at all the points in the feeder line.
Figure 147 DTM VVC All 3 Cap Bank Controller Closed
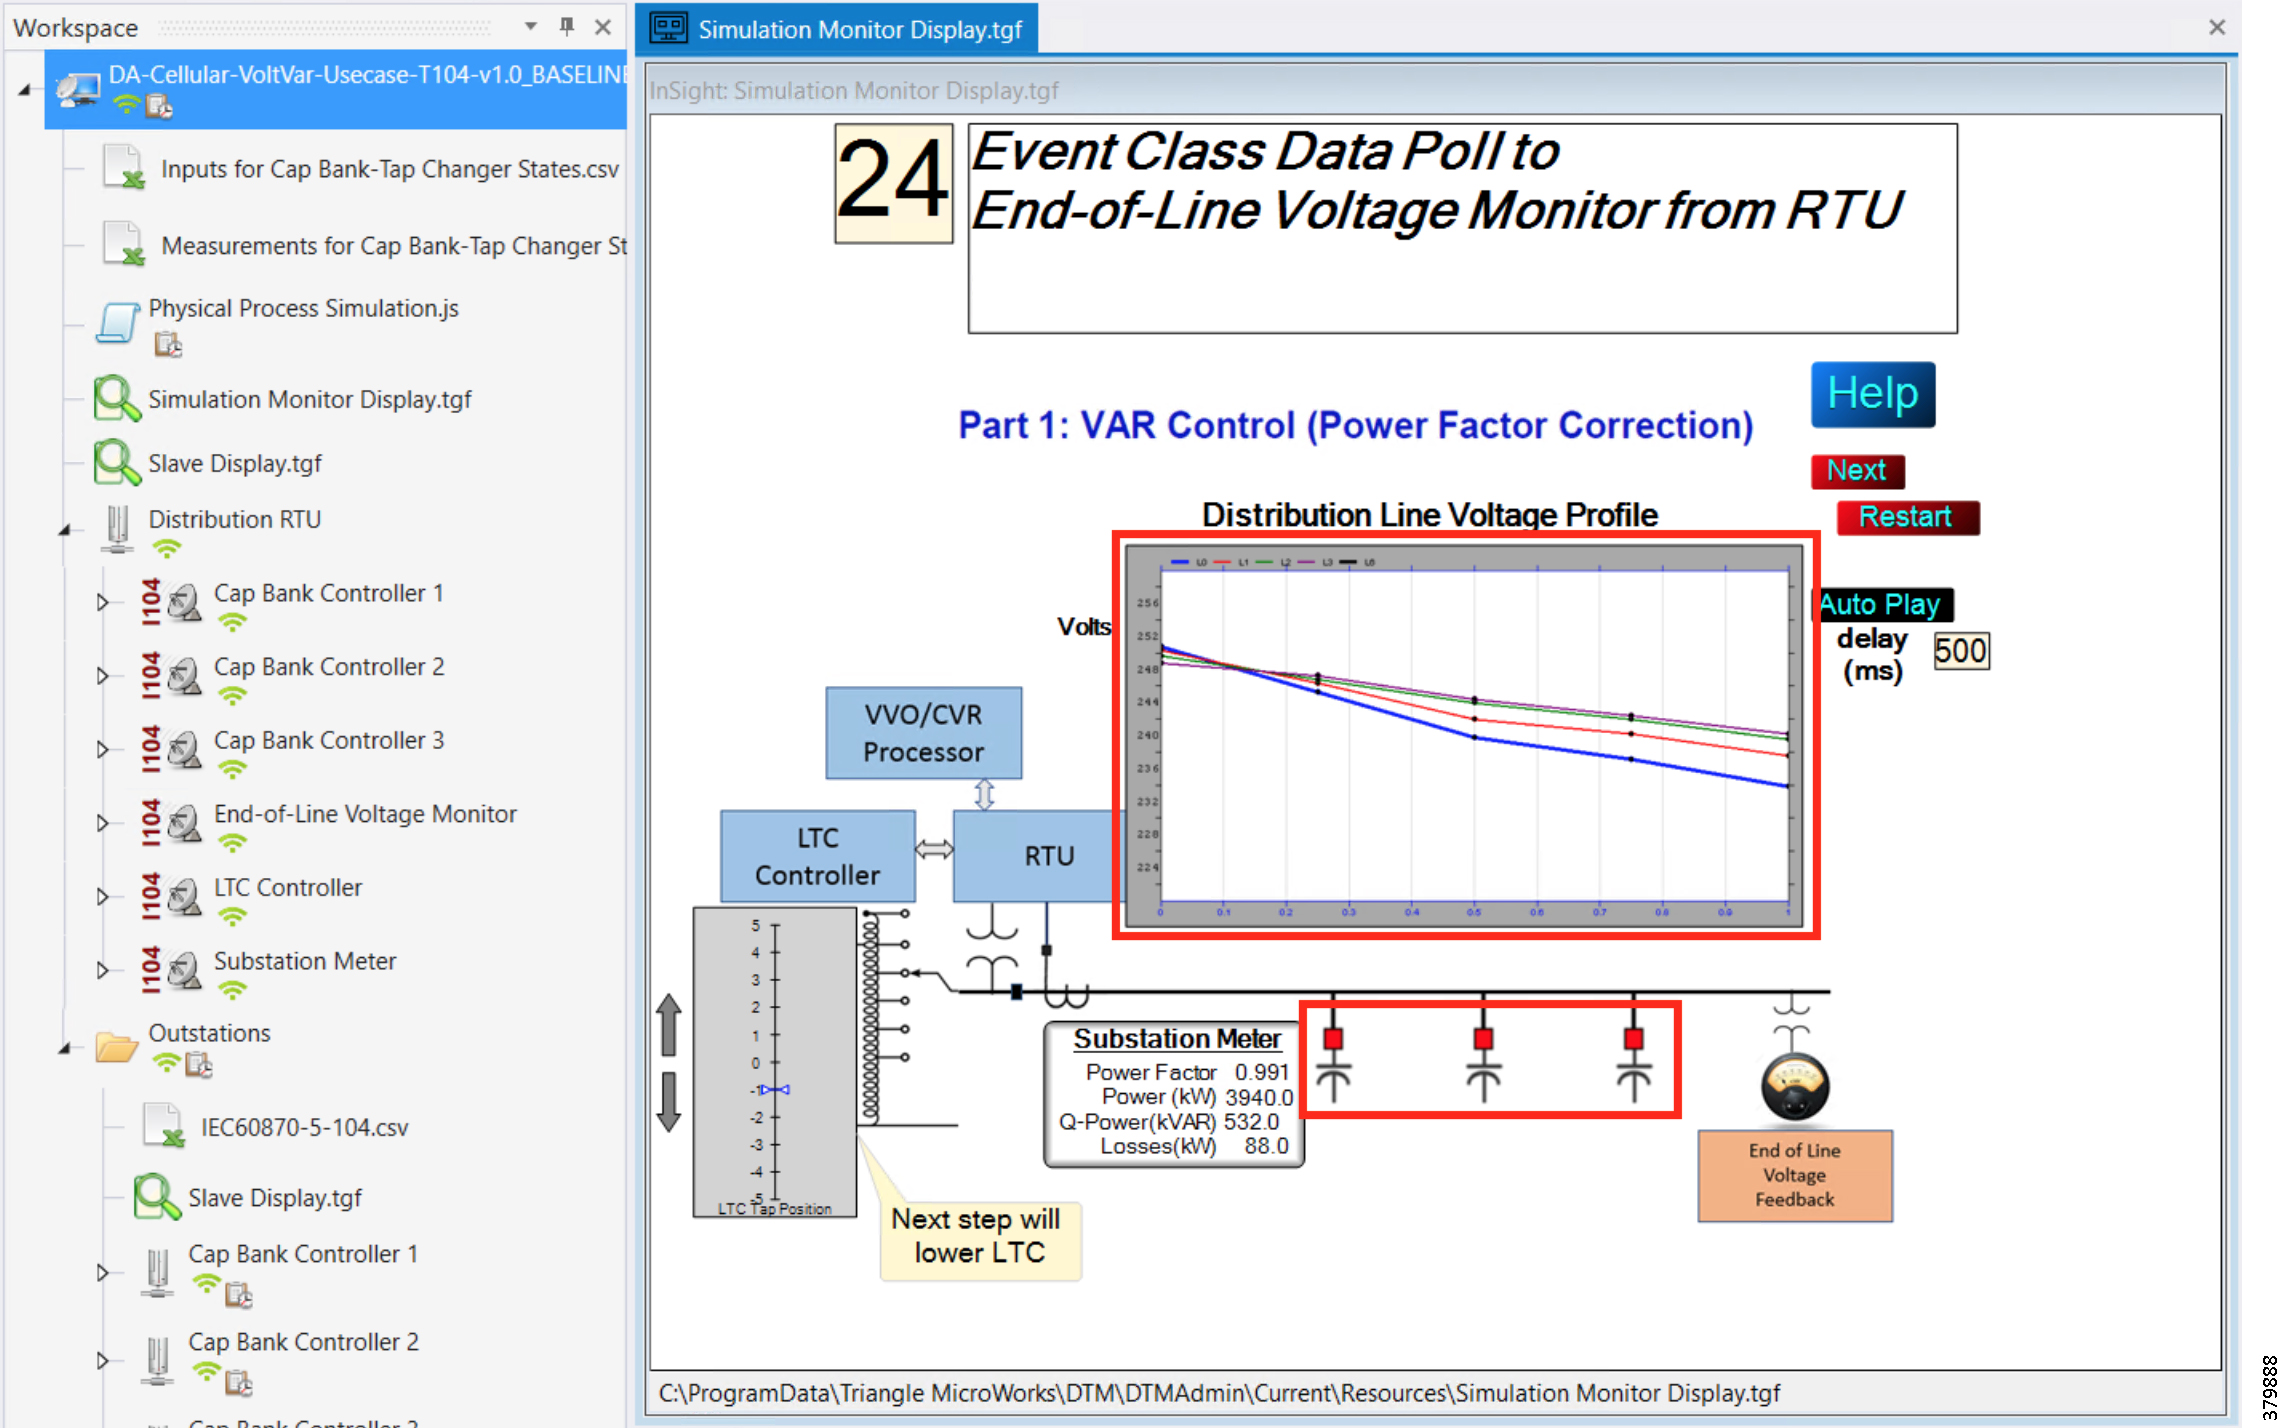
Voltage Control (Conservation Voltage Reduction)
Conservation Voltage Reduction (CVR) can be achieved by moving the Load Tap Controller up or down to maintain the Power Factor close to 1.
Event Sequence Diagram
Figure 148 Volt/VAR—CVR Sequence Diagram
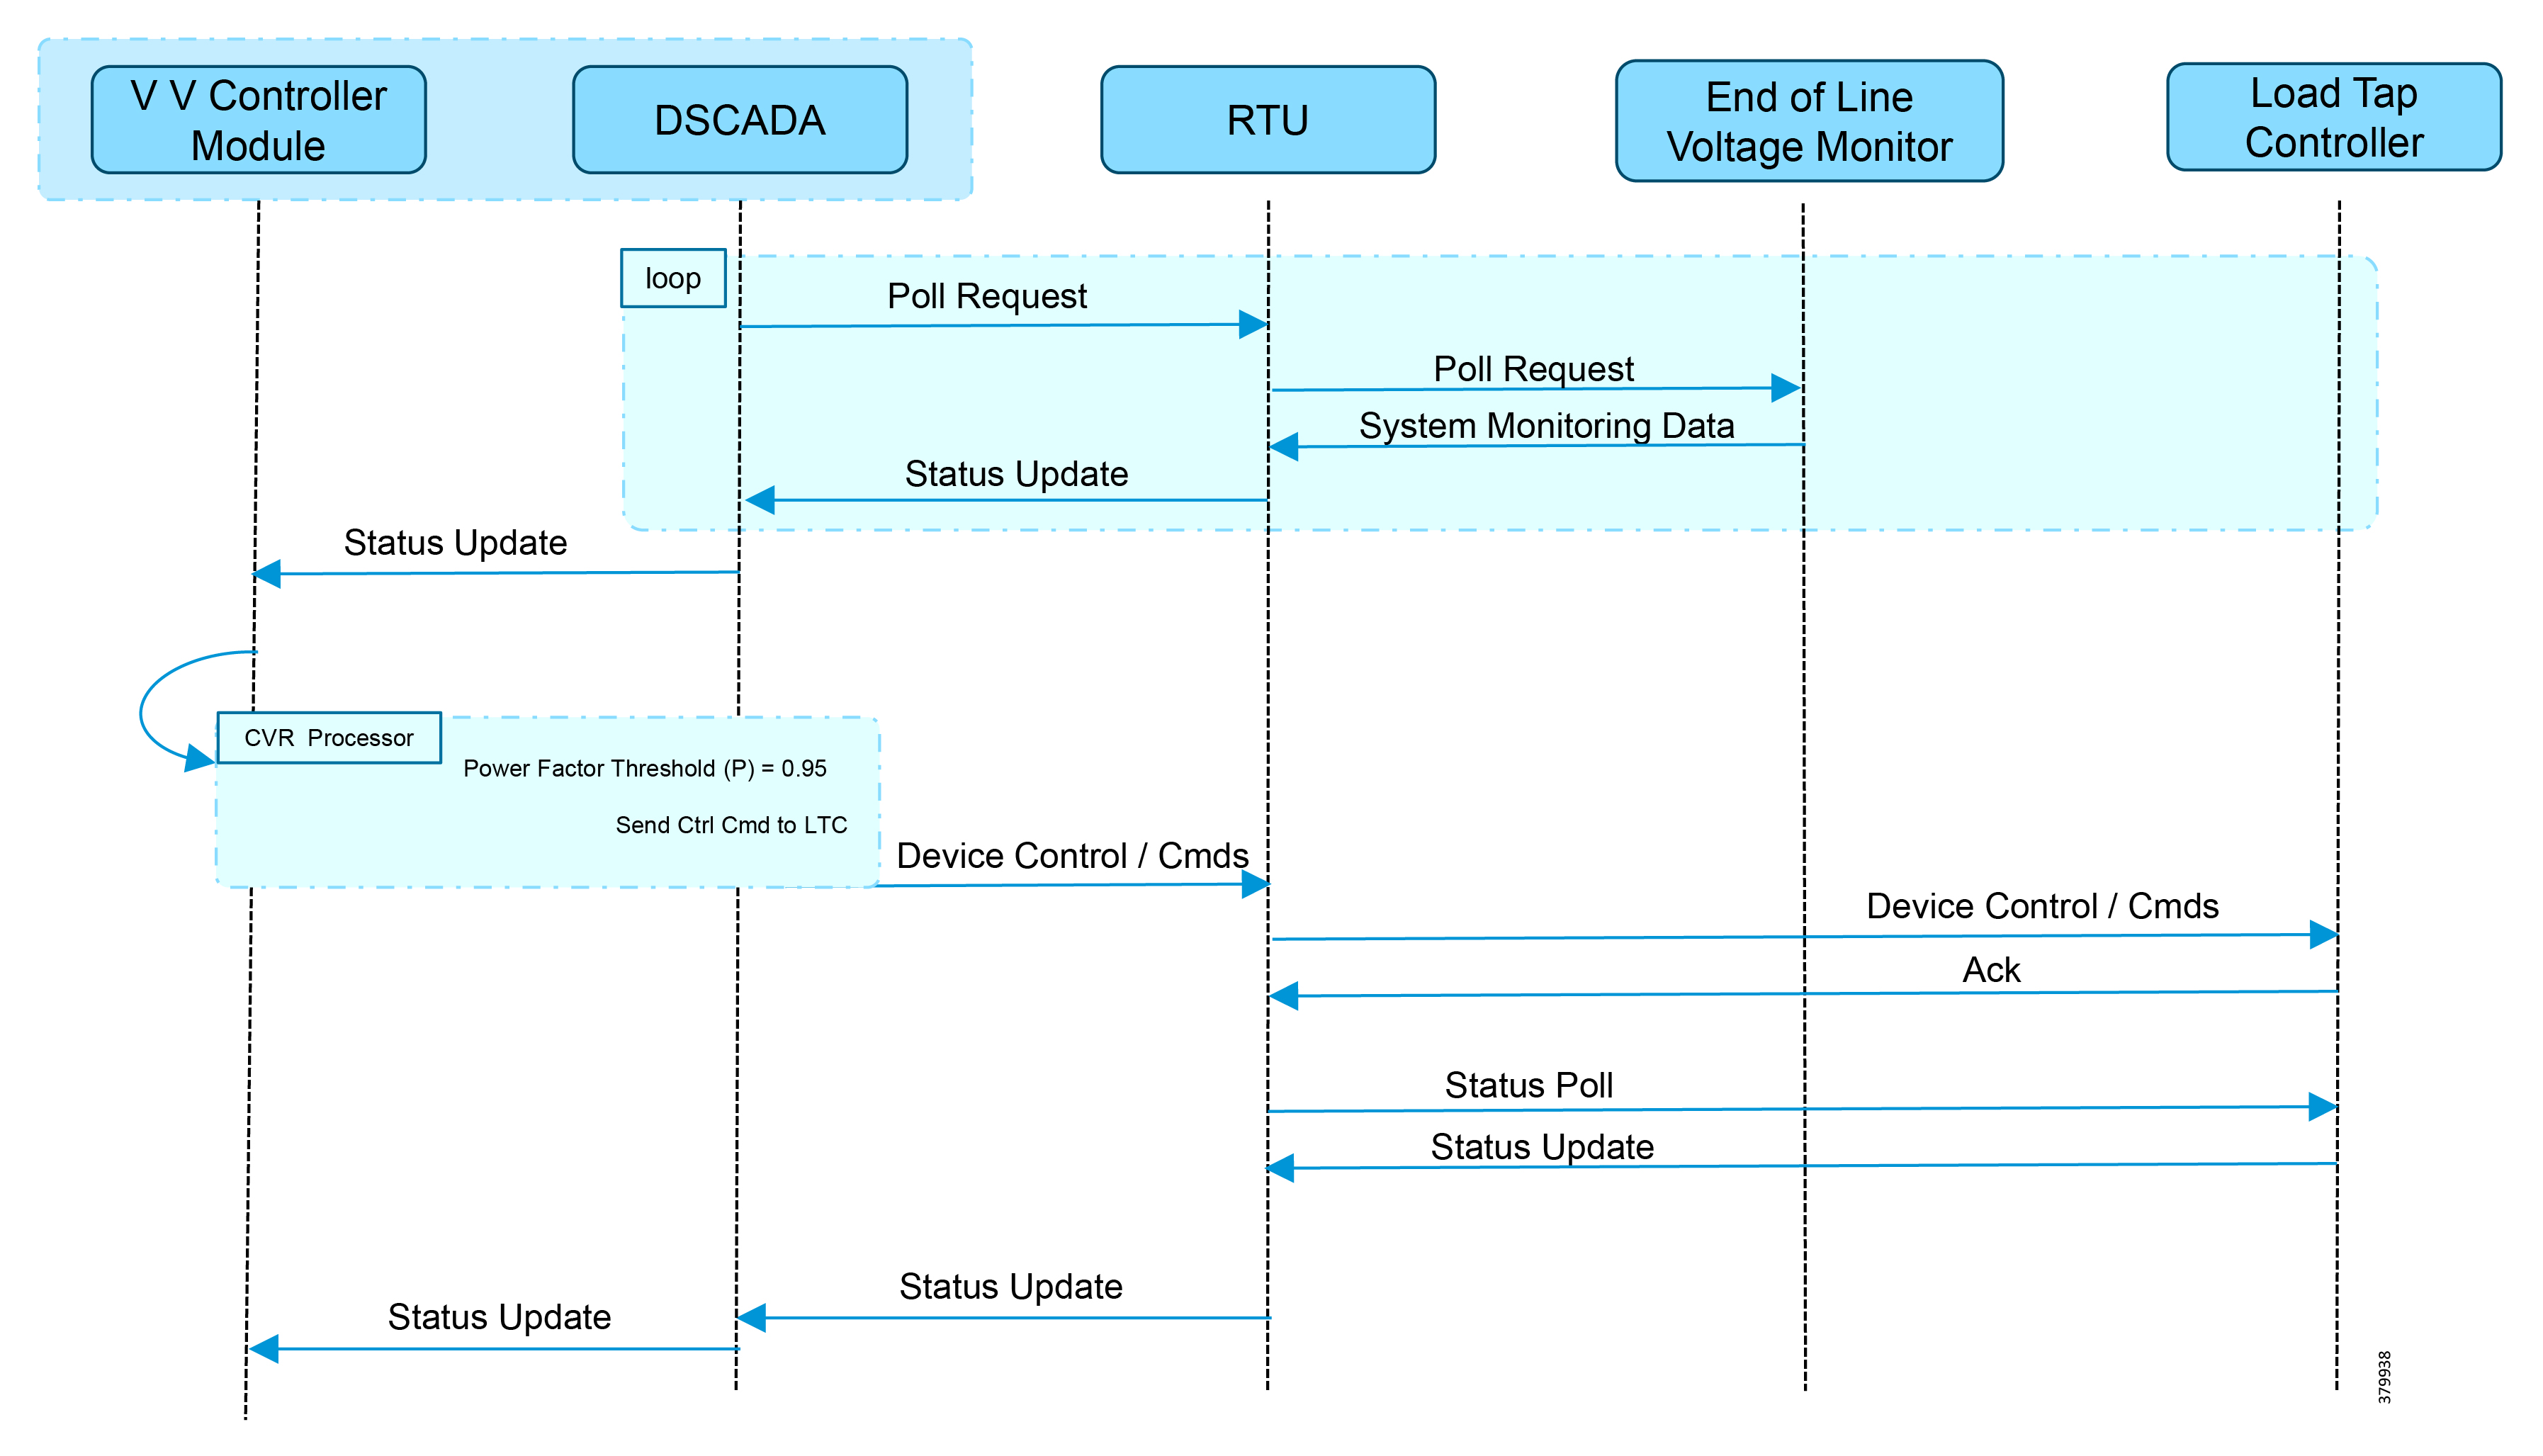
Use Case Steps
1.![]() Event class data poll to the following devices from the RTU:
Event class data poll to the following devices from the RTU:
–![]() Substation meter, poll Measured Value (Short Floating Point) registers
Substation meter, poll Measured Value (Short Floating Point) registers
–![]() All Capacitor Bank Controller(s), poll Measured Value (Short Floating Point) and Double Point registers
All Capacitor Bank Controller(s), poll Measured Value (Short Floating Point) and Double Point registers
–![]() End-of-Line voltage monitor, poll Measured Value (Short Floating Point) register
End-of-Line voltage monitor, poll Measured Value (Short Floating Point) register
2.![]() The Volt/VAR Optimization processor processes the data received from the devices and makes a control command decision based on the power factor calculation.
The Volt/VAR Optimization processor processes the data received from the devices and makes a control command decision based on the power factor calculation.
3.![]() Control command is sent to the RTU via SCADA to the LTC to Lower/Raise LTC.
Control command is sent to the RTU via SCADA to the LTC to Lower/Raise LTC.
4.![]() Event class data poll to the following devices from the RTU:
Event class data poll to the following devices from the RTU:
–![]() Substation meter, poll Measured Value (Short Floating Point) registers
Substation meter, poll Measured Value (Short Floating Point) registers
–![]() All Capacitor Bank Controller(s), poll Measured Value (Short Floating Point) and Double Point registers
All Capacitor Bank Controller(s), poll Measured Value (Short Floating Point) and Double Point registers
–![]() End-of-Line voltage monitor, poll Measured Value (Short Floating Point) register
End-of-Line voltage monitor, poll Measured Value (Short Floating Point) register
5.![]() All the above steps are repeated to maintain Power Factor value always close to value 1.
All the above steps are repeated to maintain Power Factor value always close to value 1.
CVR Use Case Simulation
Follow the steps 1 to 8, in VAR Control Use Case Simulation.
1.![]() After following the steps above, this is the ninth step.
After following the steps above, this is the ninth step.
2.![]() Control command is sent to the RTU via SCADA to the LTC to Lower/Raise LTC by writing in a command register. LTC is lowered to -2, by the script.
Control command is sent to the RTU via SCADA to the LTC to Lower/Raise LTC by writing in a command register. LTC is lowered to -2, by the script.
Figure 149 DTM CVR LTC Lowering
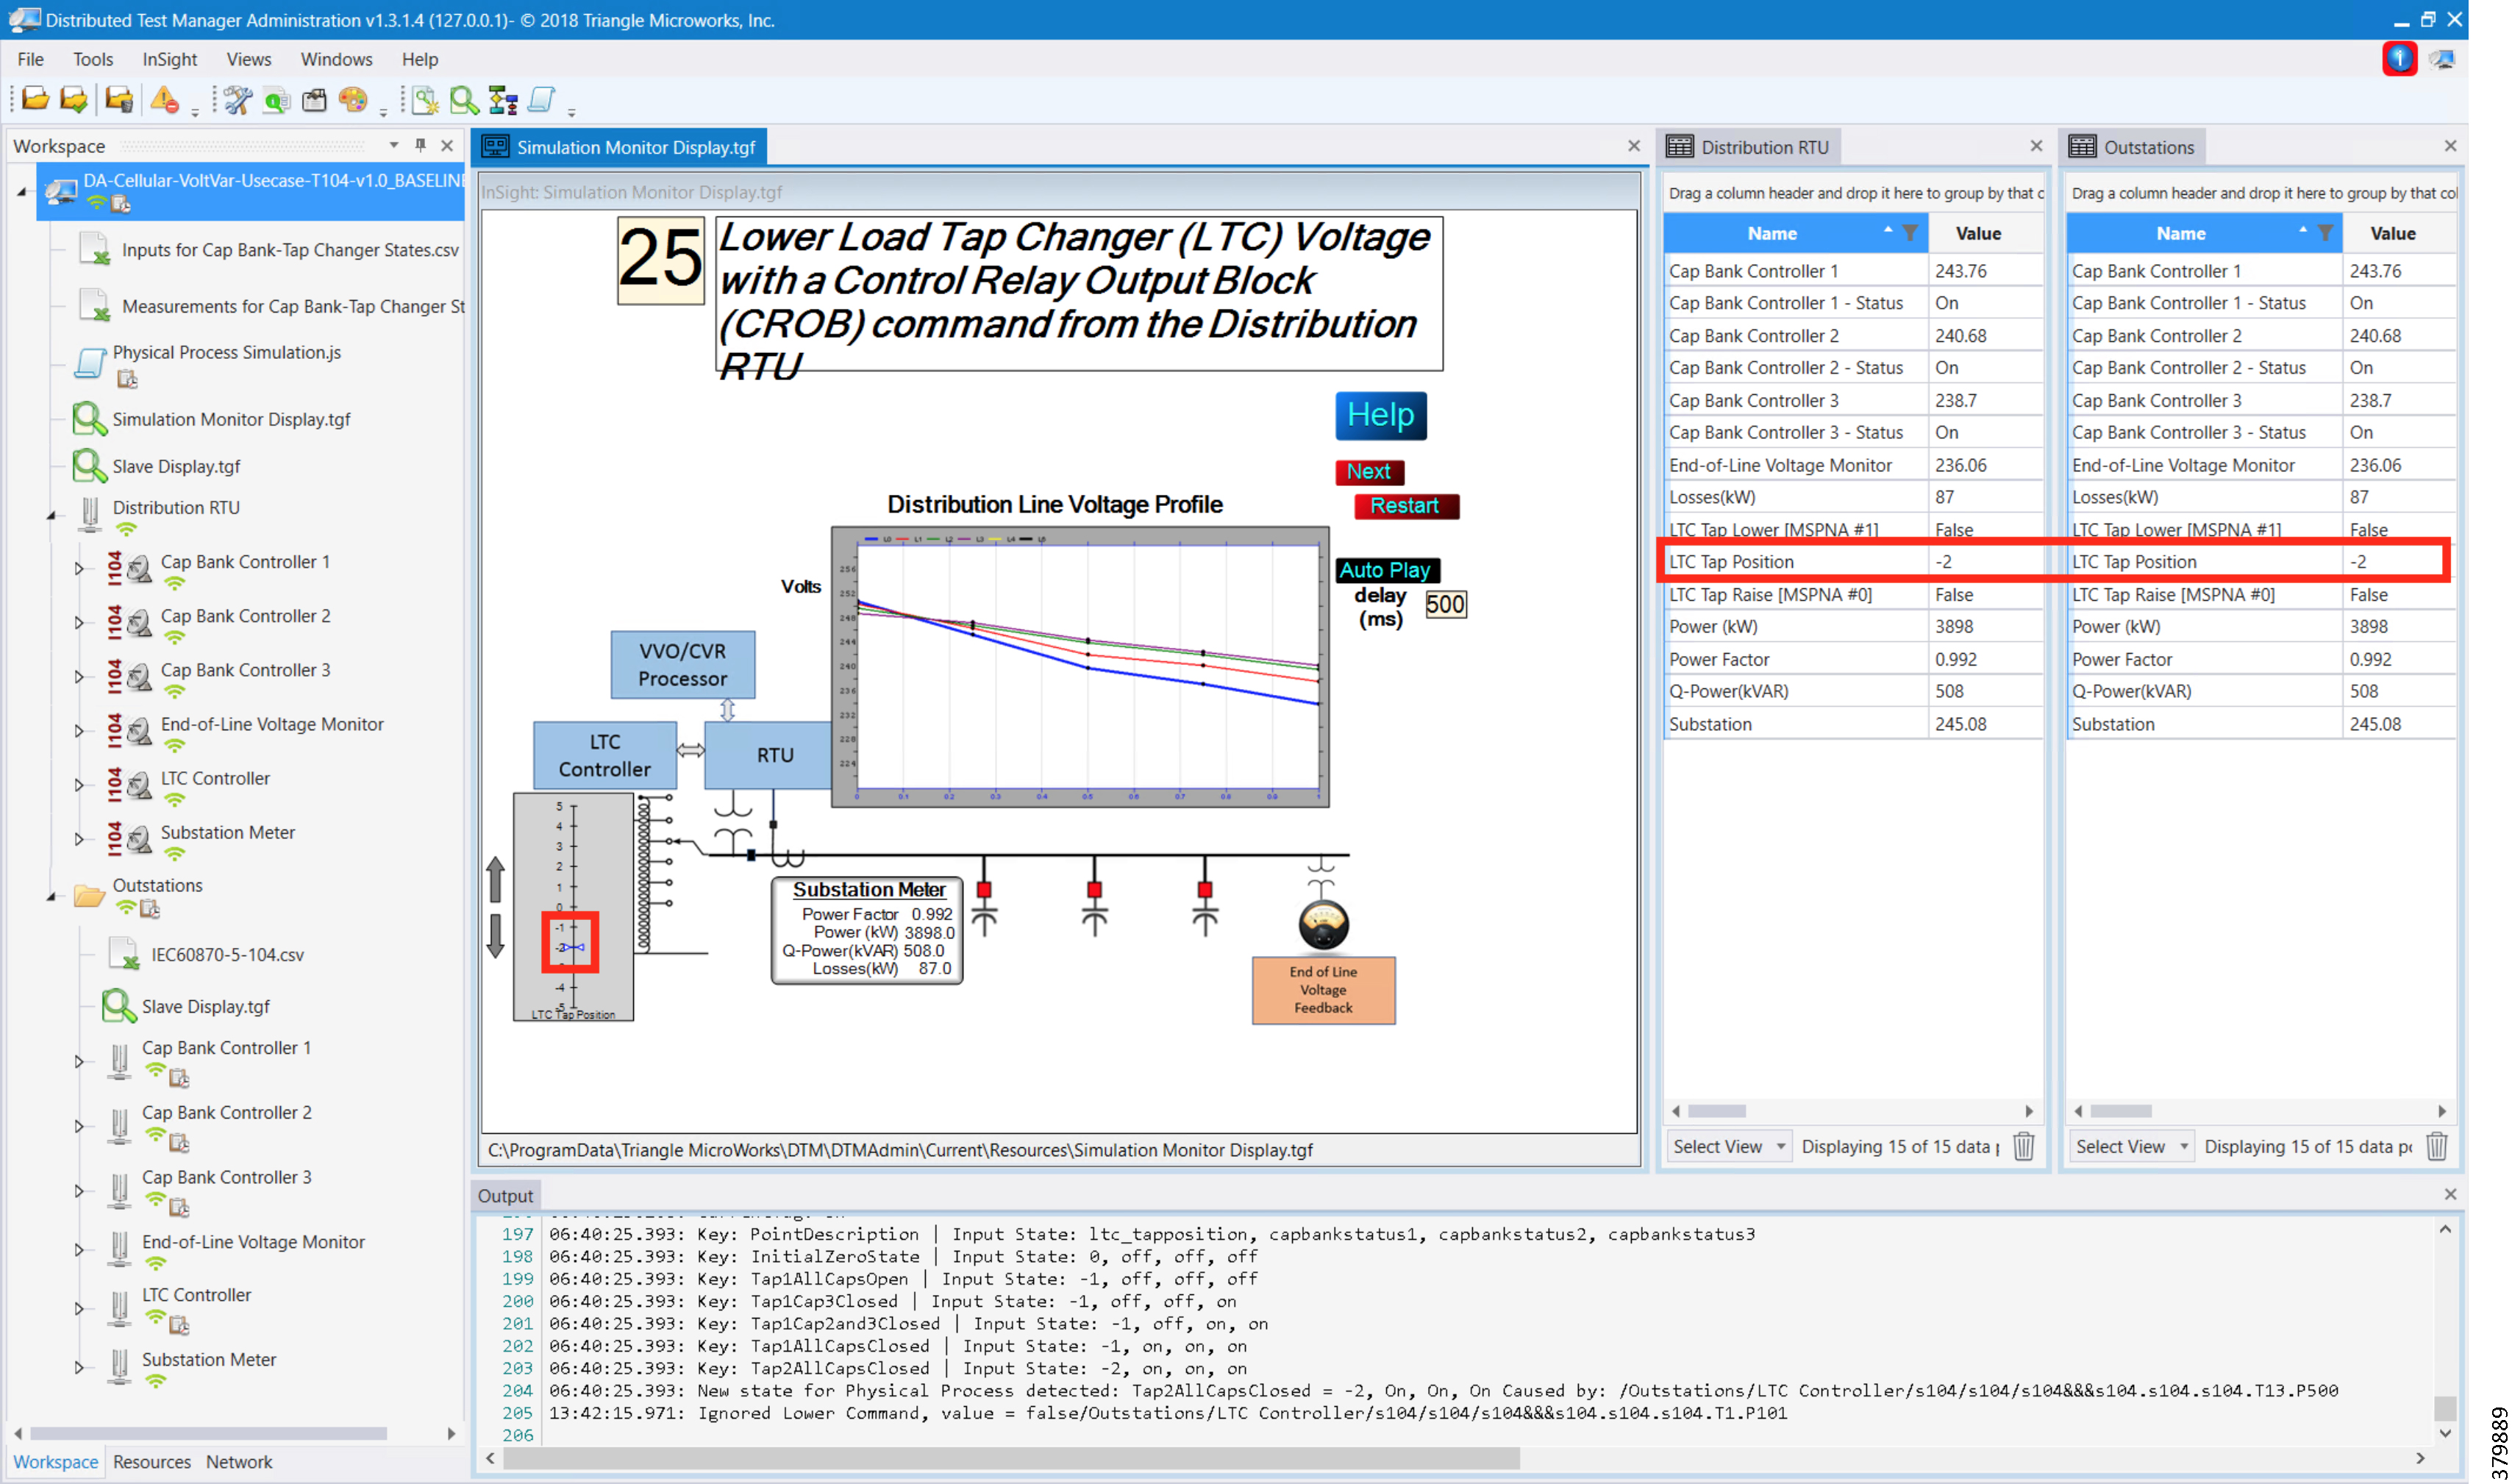
3.![]() Event class data poll to the following devices from the RTU:
Event class data poll to the following devices from the RTU:
–![]() Substation meter, poll Measured Value (Short Floating Point) registers
Substation meter, poll Measured Value (Short Floating Point) registers
–![]() All Capacitor Bank Controller(s), poll Measured Value (Short Floating Point) and Double Point registers
All Capacitor Bank Controller(s), poll Measured Value (Short Floating Point) and Double Point registers
–![]() End-of-Line voltage monitor, poll Measured Value (Short Floating Point) register
End-of-Line voltage monitor, poll Measured Value (Short Floating Point) register
Figure 150 DTM CVR Event Class Polling
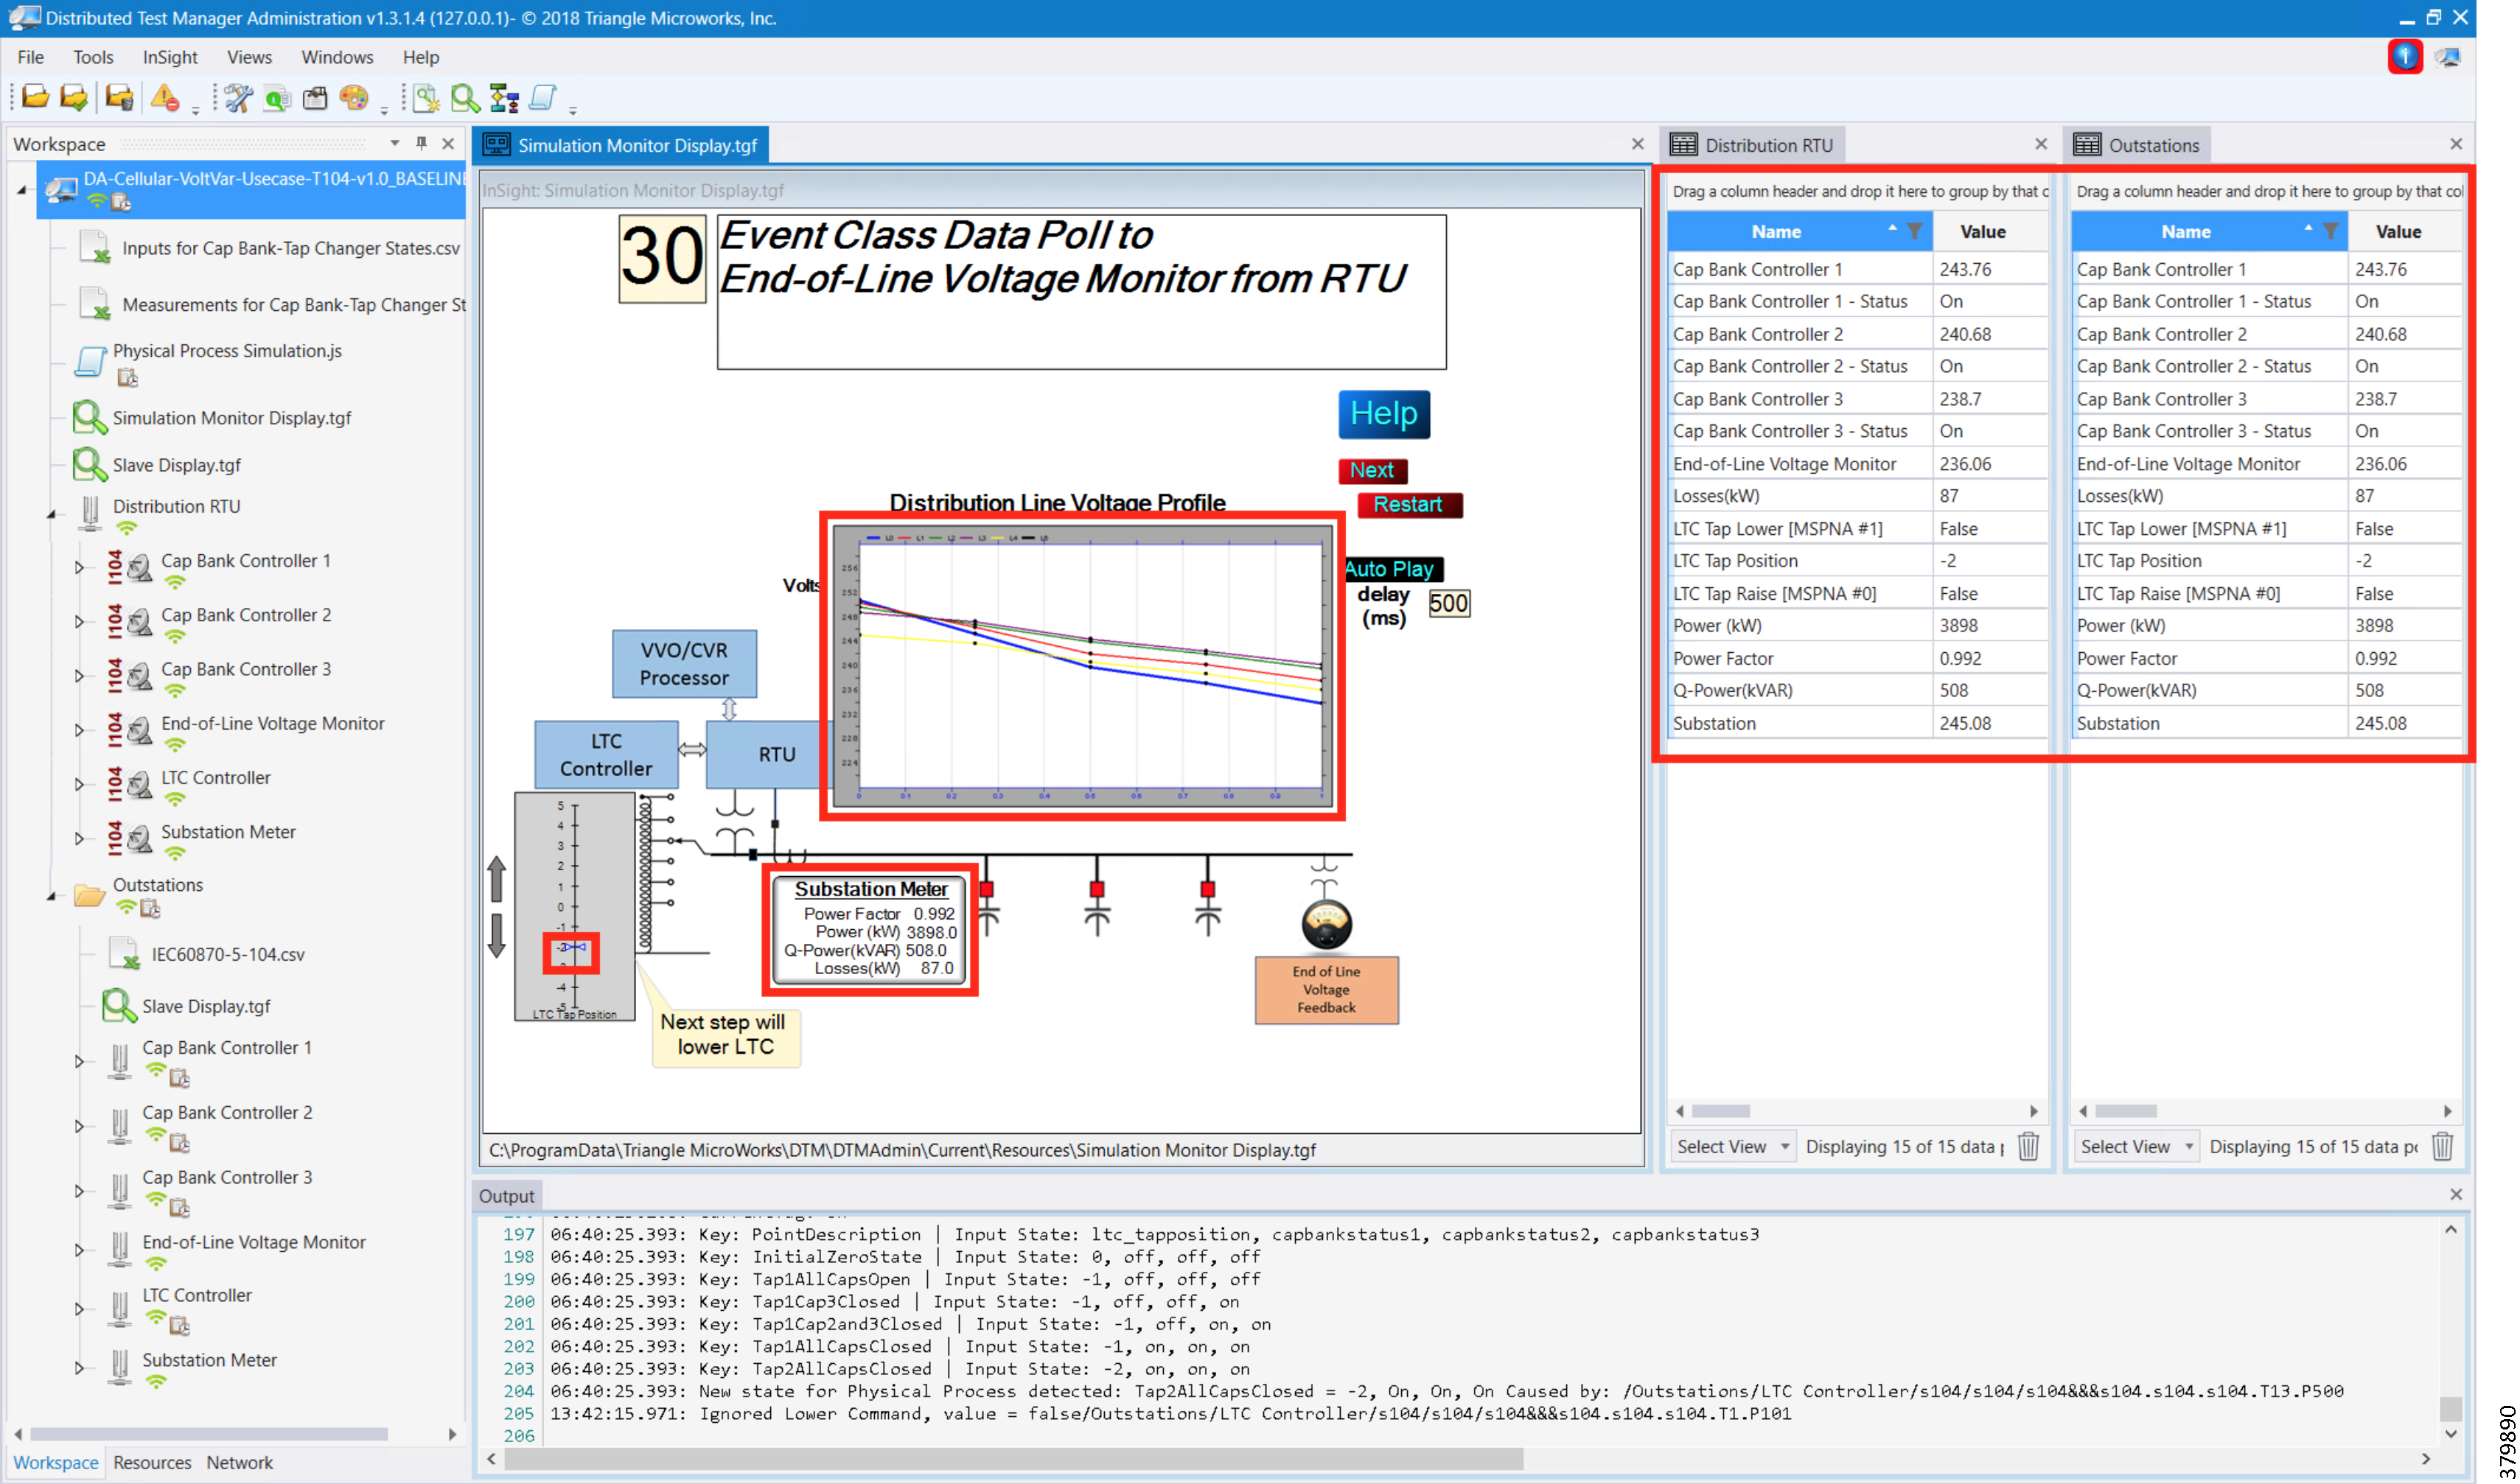
4.![]() All the above steps are repeated to maintain Power Factor value always close to 1, at all points in the feeder line.
All the above steps are repeated to maintain Power Factor value always close to 1, at all points in the feeder line.
Figure 151 DTM CVR End of Simulation
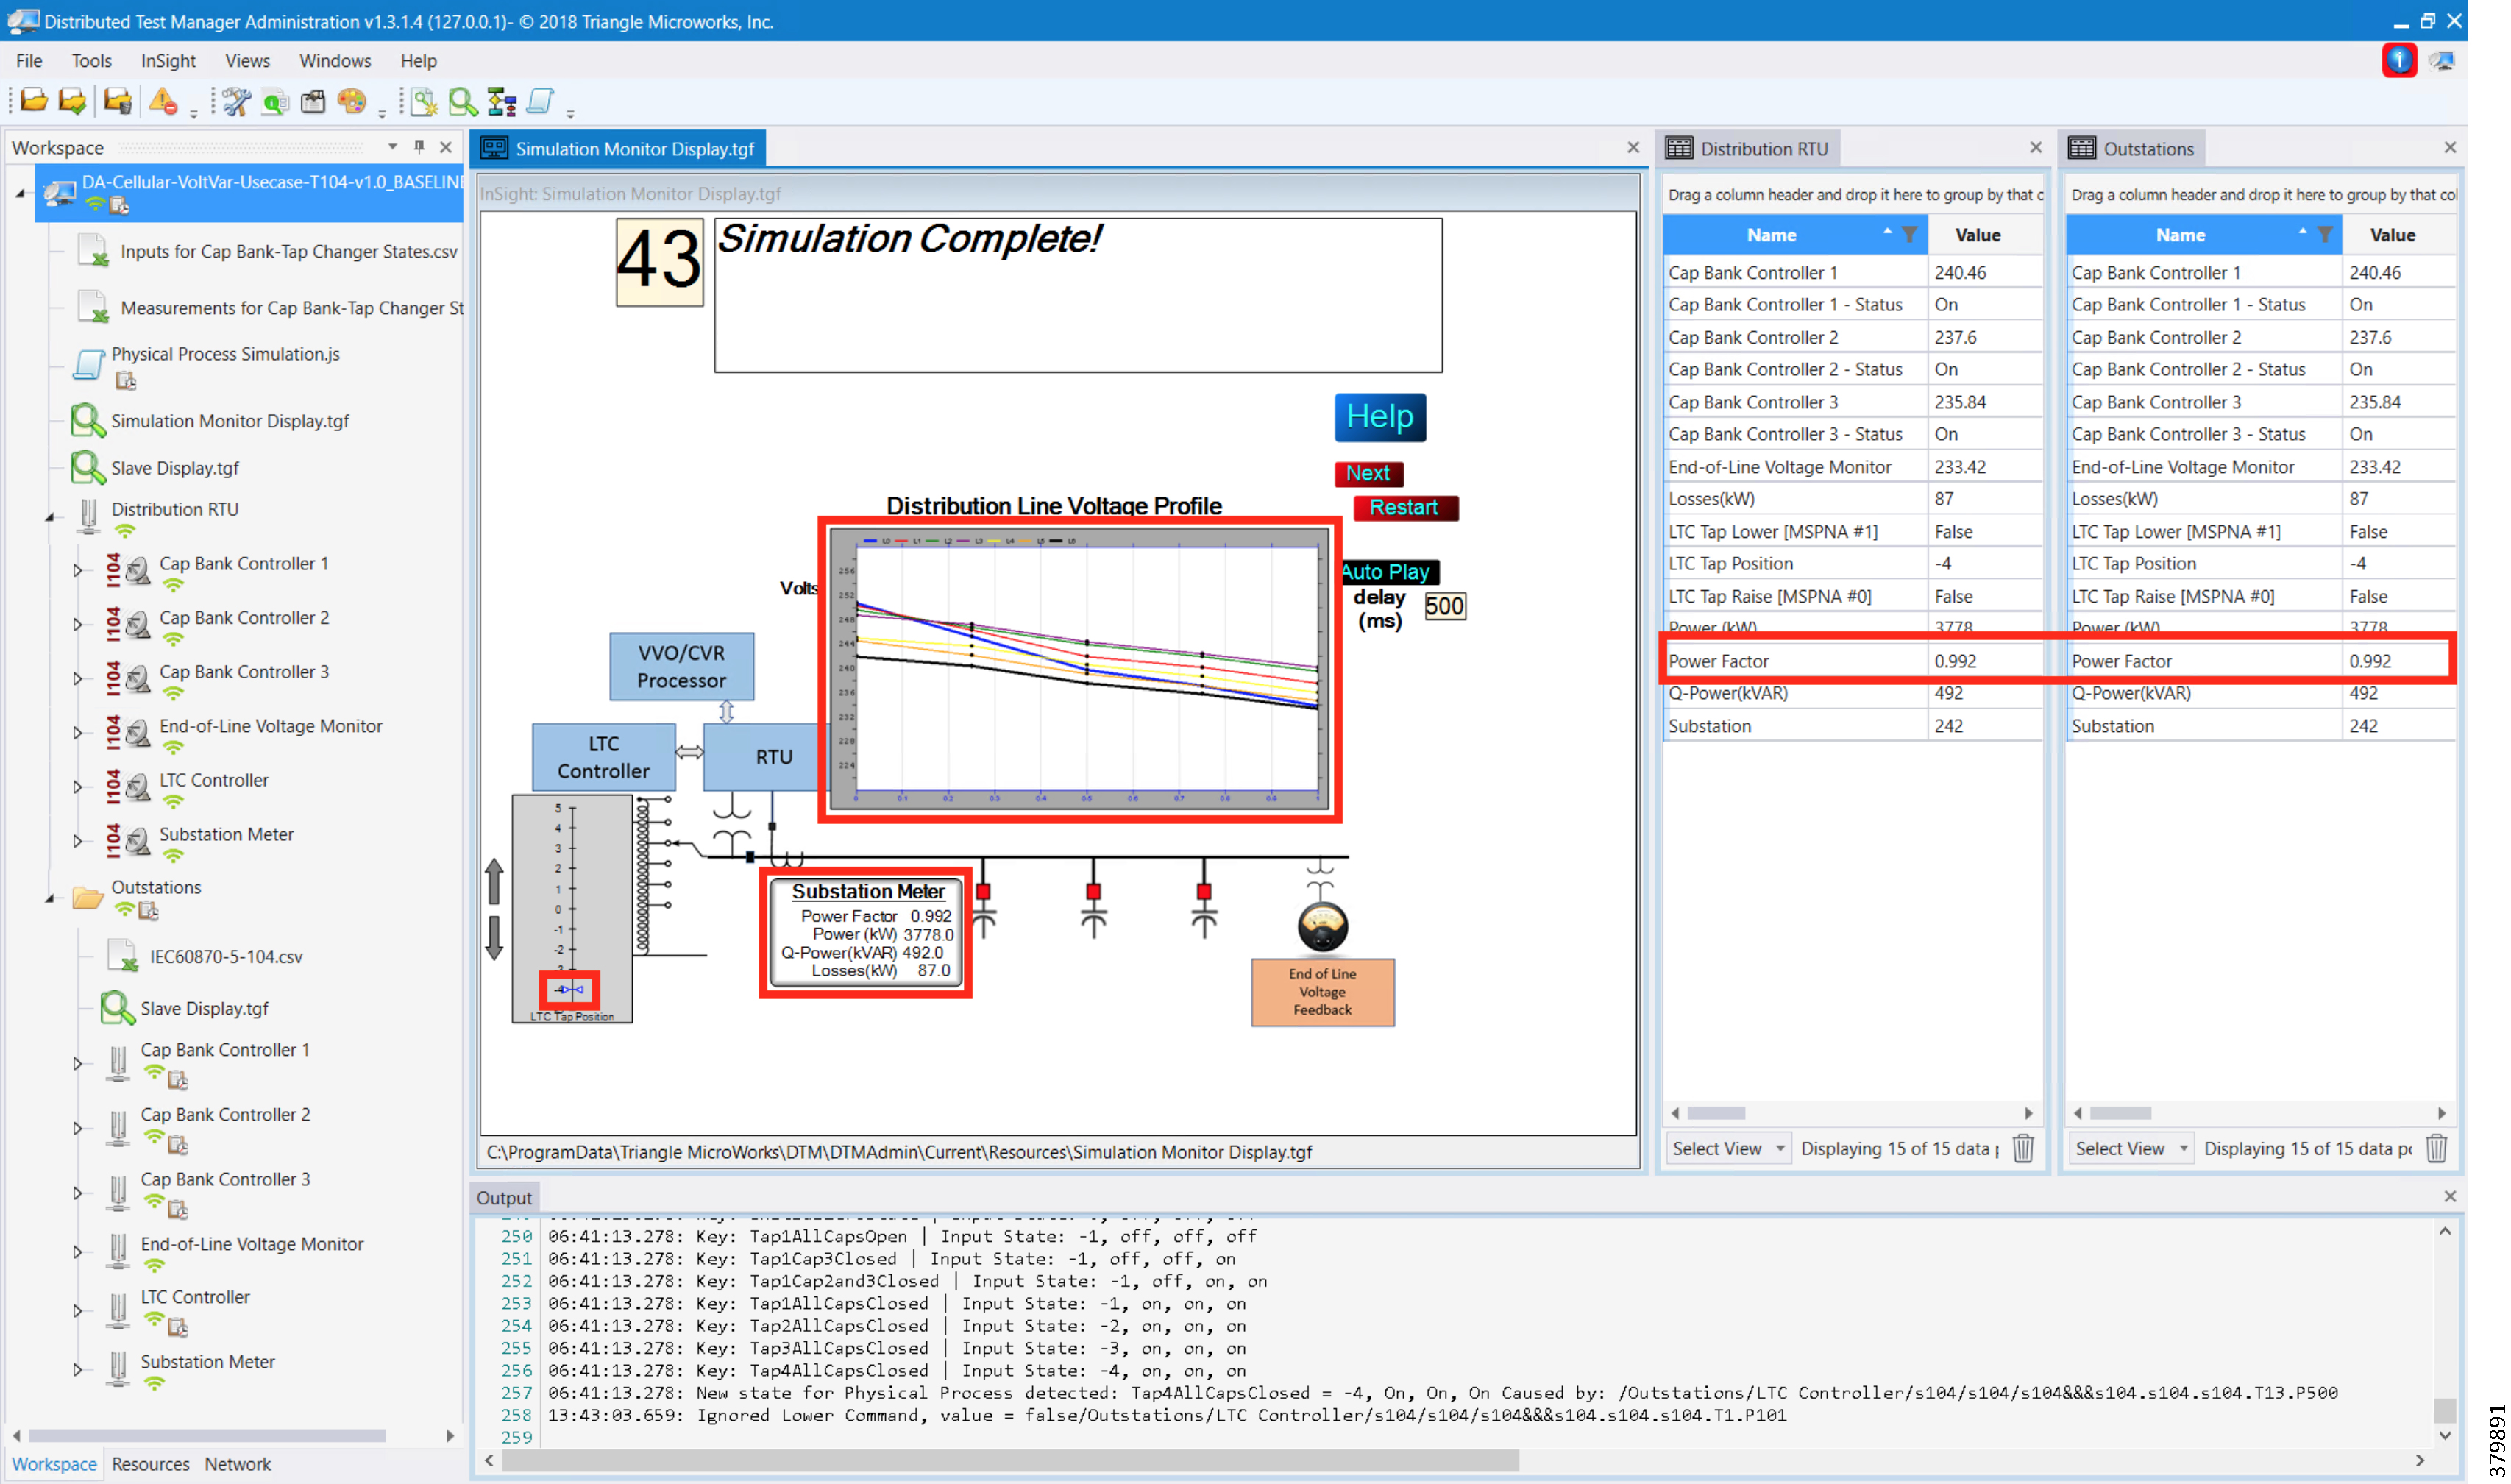
Fault Location, Isolation, and Service Restoration
FLISR is the process for dealing with fault conditions on the electrical grid. When a fault occurs in a section of the grid, first identify the fault location and isolate the smallest possible section affected by the fault. Then restore the power to the larger possible section of the grid.
The goal of the FLISR to minimize the fault affect area with a very short turnaround time, by identifying the fault location, isolating the fault section, and restoring the power to remaining section of the grid within short turnaround time.
Event Sequence Diagram
Figure 152 FLISR—Semi-Automatic Sequence Diagram
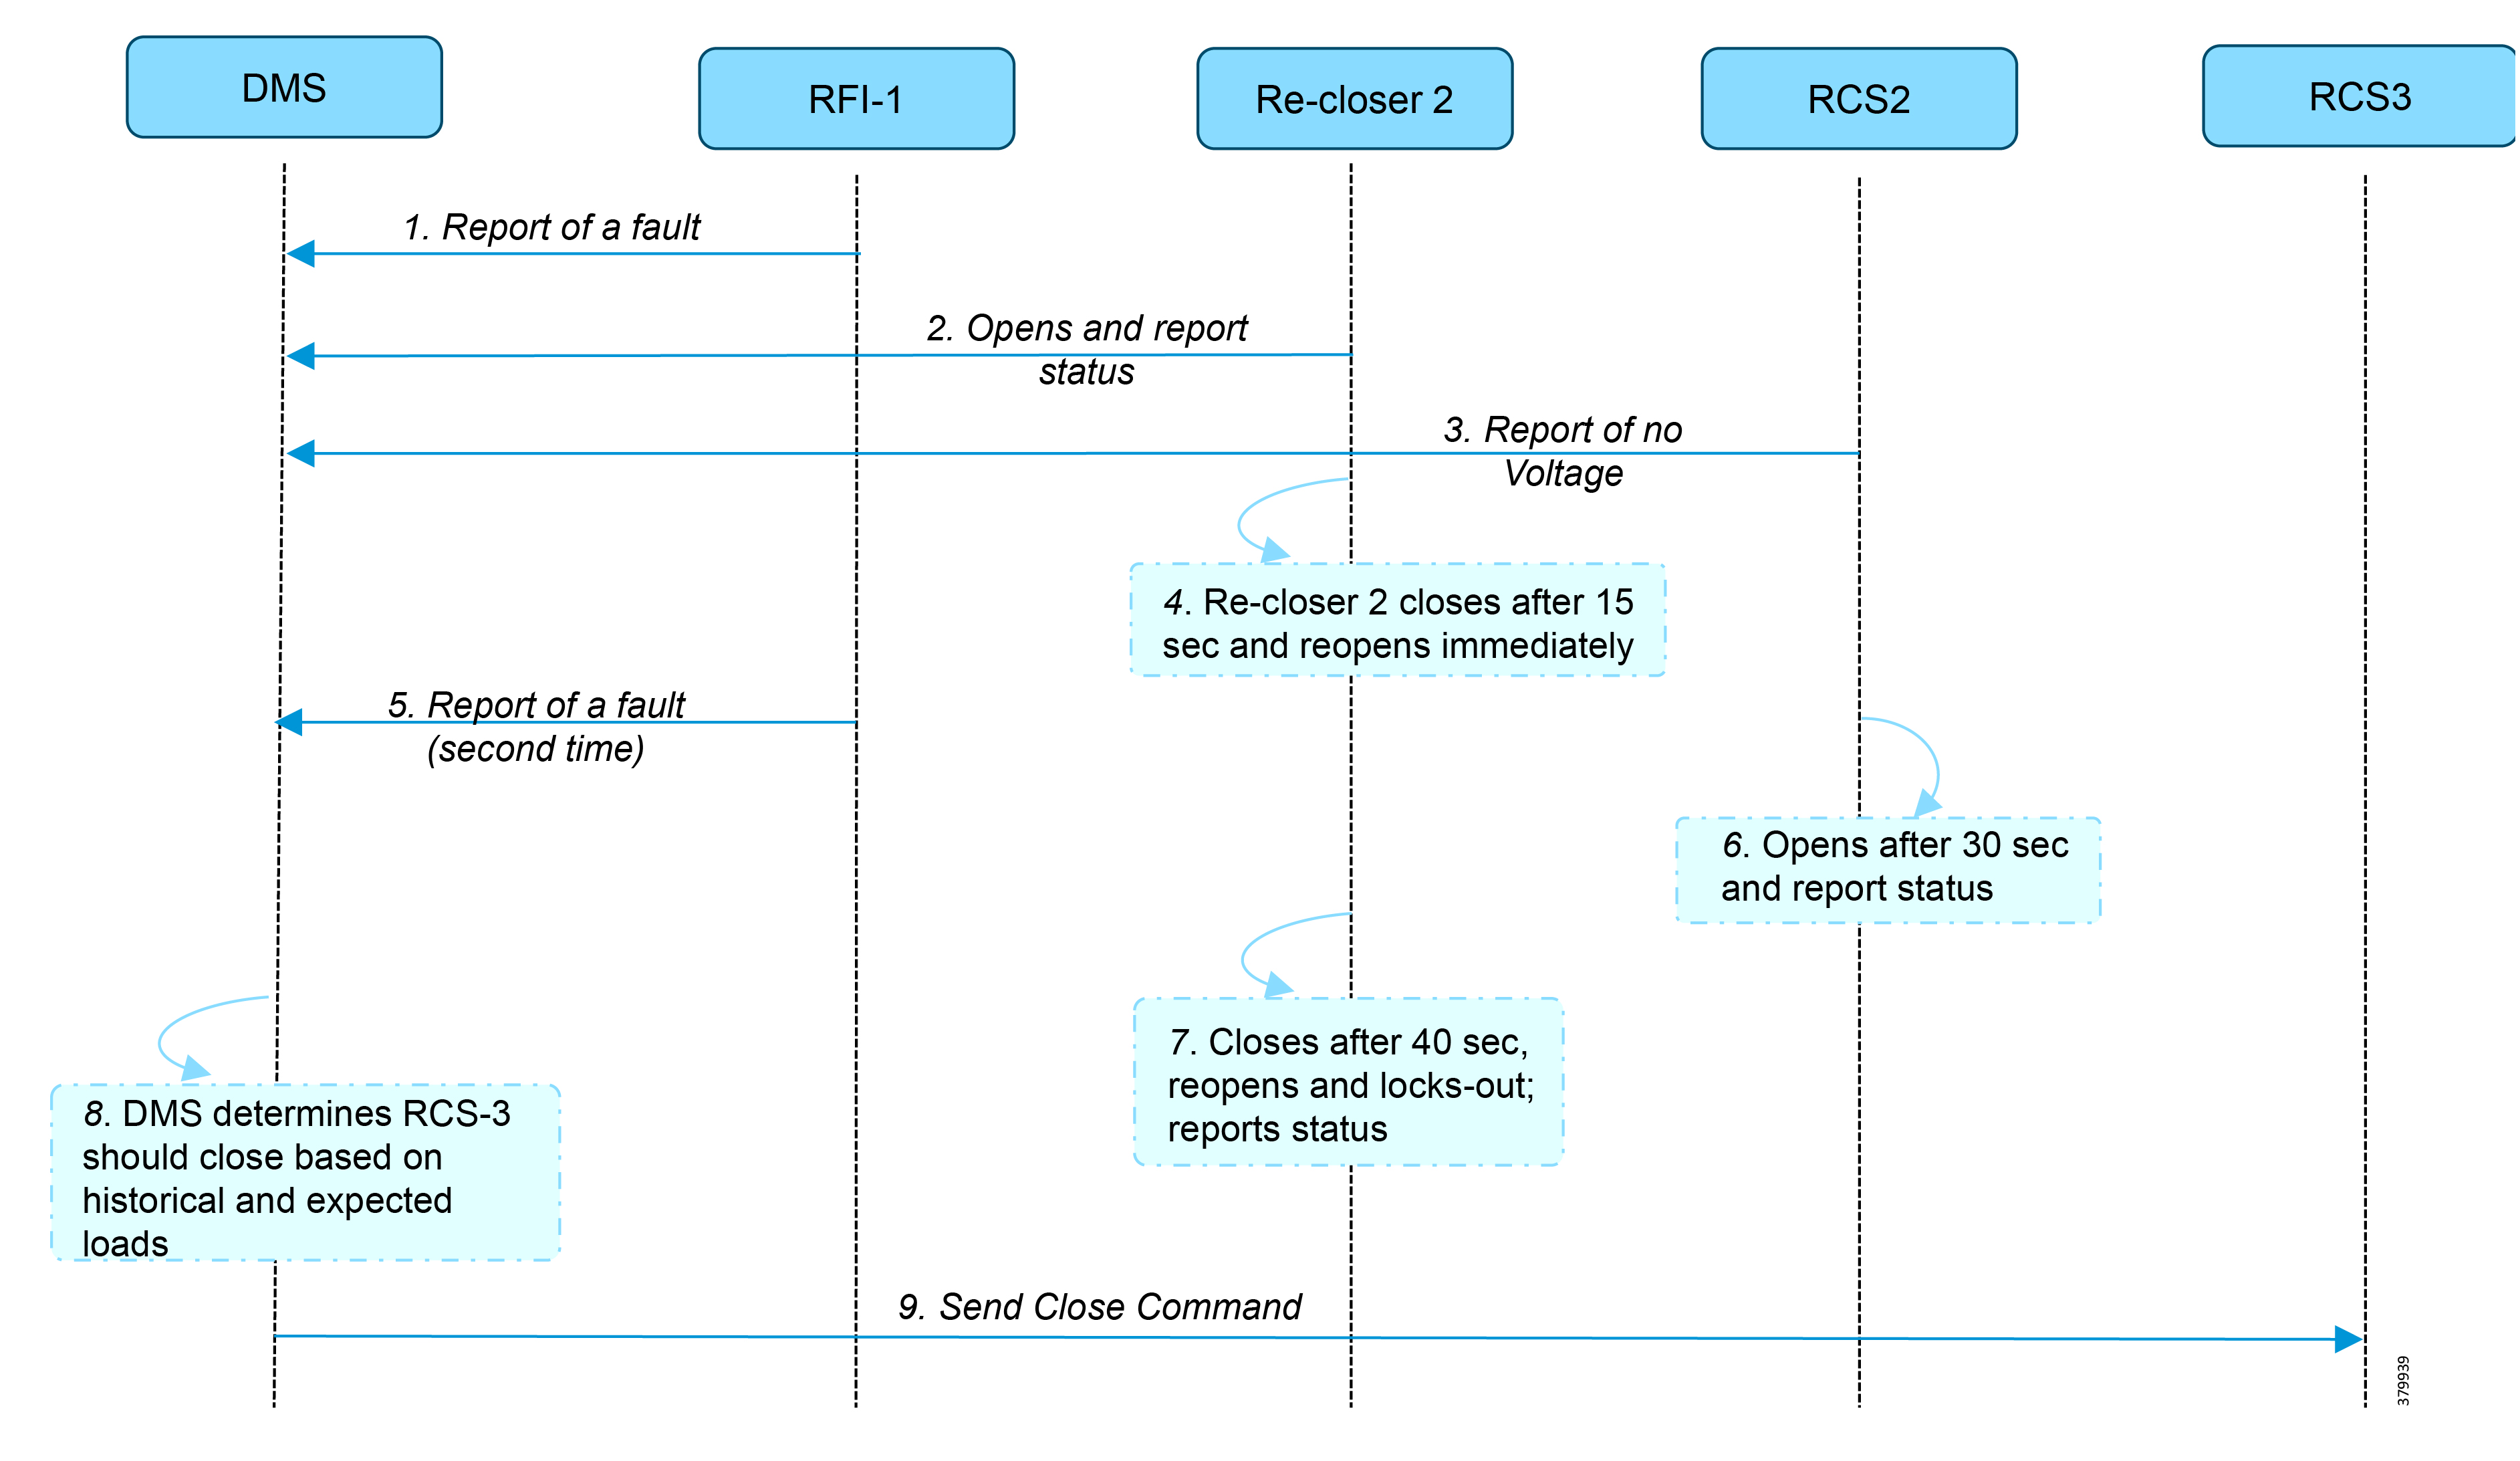
Use Case Steps
1.![]() Remote Fault Indicator (RFI) 1 reports to Distribution Management System (DMS) whenever it encounters a fault.
Remote Fault Indicator (RFI) 1 reports to Distribution Management System (DMS) whenever it encounters a fault.
2.![]() Re-closer 2 opens and send a report to DMS when it encounters a temporary fault.
Re-closer 2 opens and send a report to DMS when it encounters a temporary fault.
3.![]() Remote Control Switch (RCS) 2 reports no voltage status to DMS.
Remote Control Switch (RCS) 2 reports no voltage status to DMS.
4.![]() RCS 2 closes after 15 seconds and re-opens immediately.
RCS 2 closes after 15 seconds and re-opens immediately.
5.![]() RFI 1 reports fault for the second time.
RFI 1 reports fault for the second time.
6.![]() RCS 2 opens after 40 seconds and reports status.
RCS 2 opens after 40 seconds and reports status.
7.![]() Re-closer 2, closes after 40 seconds, reopens and locks out permanently, and reports status to DMS.
Re-closer 2, closes after 40 seconds, reopens and locks out permanently, and reports status to DMS.
FLISR Use Case Simulation
1.![]() Load the FLISR workspace by importing into DTM. The FLISR workspace can be found in Appendix E: End-to-End Application Use Case Scenarios.
Load the FLISR workspace by importing into DTM. The FLISR workspace can be found in Appendix E: End-to-End Application Use Case Scenarios.
2.![]() Start all the host machines.
Start all the host machines.
Figure 153 DTM FLISR Start All Hosts
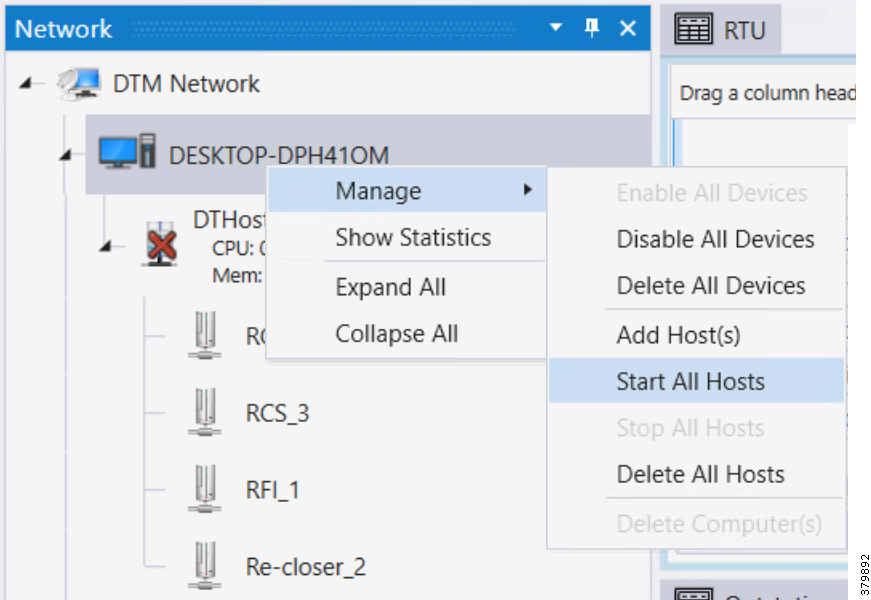
3.![]() Start the FLISR DTM Simulation script.
Start the FLISR DTM Simulation script.
4.![]() Simulate the fault by changing the RFI1 data once.
Simulate the fault by changing the RFI1 data once.
Figure 154 DTM FLISR Execute the RFI Script Once
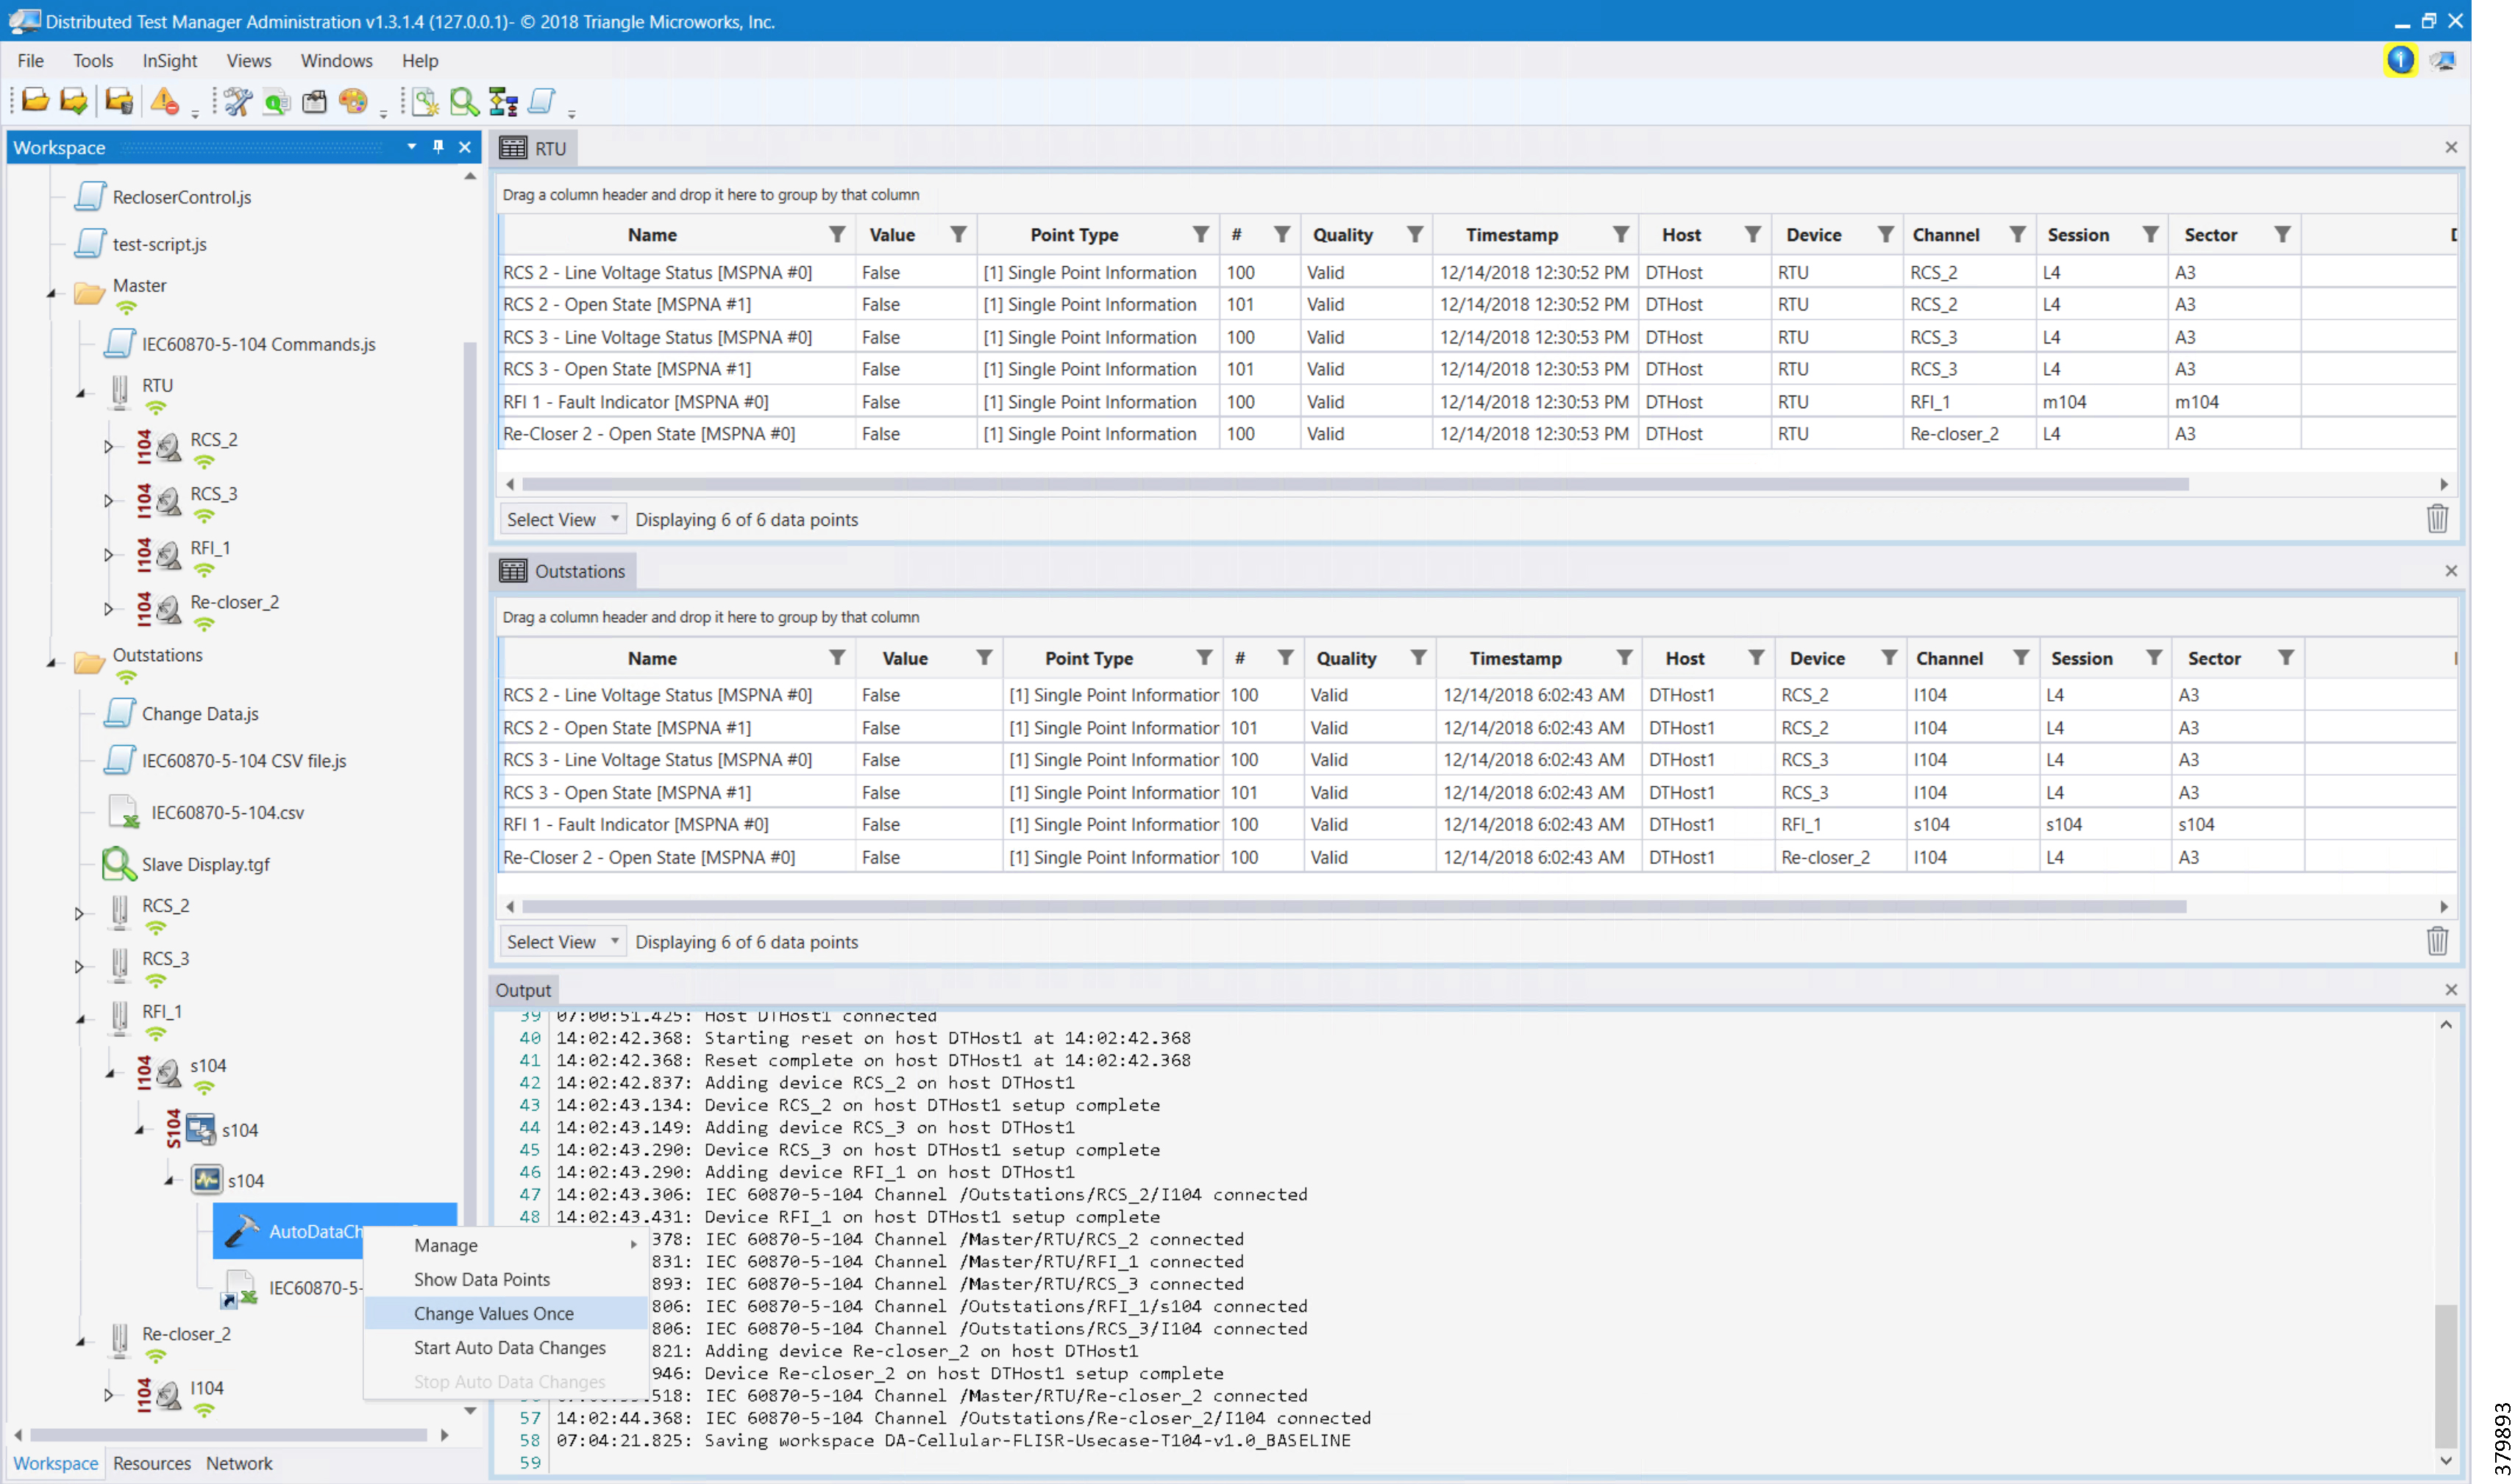
Note: The FLISR use case steps 1 to 9 are fully automated by the scripts
Figure 155 DTM FLISR Simulation Completed
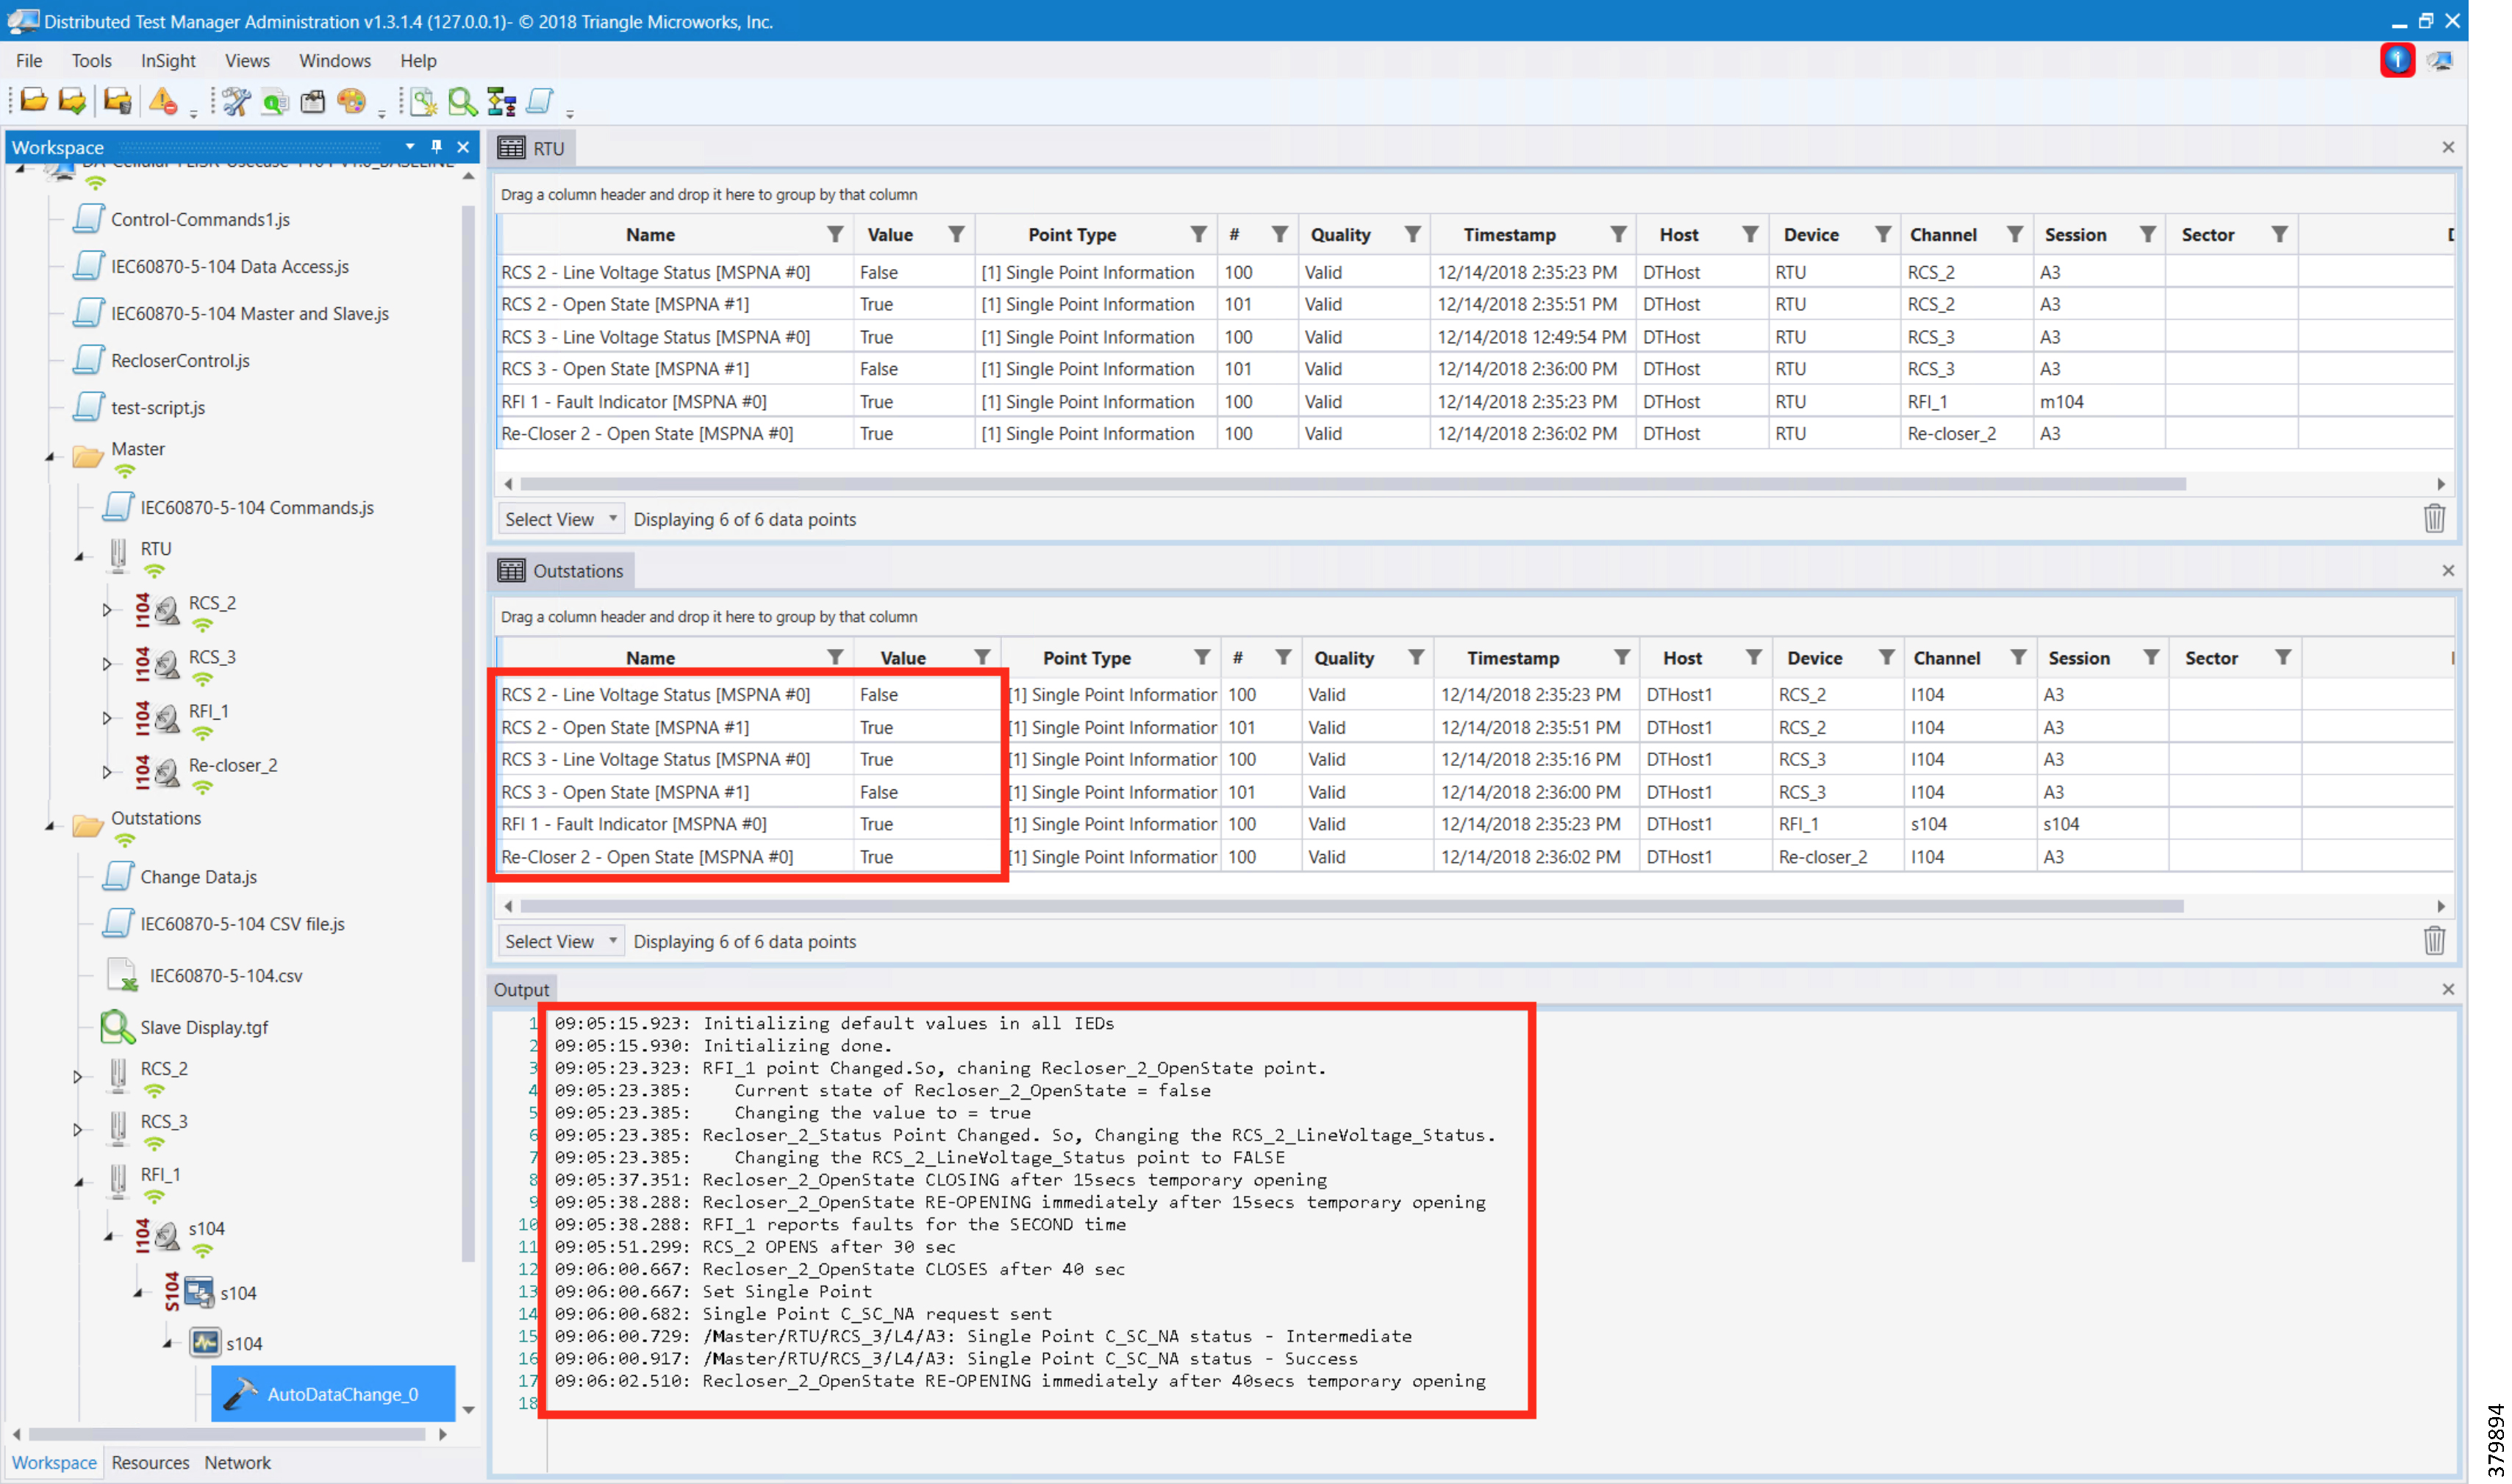
High Availability at Various Layers
High Availability has been implemented at the following layers:
■![]() Headend Router Level Redundancy
Headend Router Level Redundancy
■![]() IoT Gateway WAN Backhaul Redundancy over Cellular/Ethernet
IoT Gateway WAN Backhaul Redundancy over Cellular/Ethernet
■![]() IoT Gateway WAN Backhaul Redundancy over Cellular/Cellular
IoT Gateway WAN Backhaul Redundancy over Cellular/Cellular
Note: Throughout this chapter, configurations captured for IoT Gateway (also referred to as FAR) are for reference purposes only. They need not be configured manually. When the Bootstrapped IoT Gateway is deployed at the desired deployment location, configurations are pushed by FND as part of Zero Touch. Please refer to Appendix B: FND Zero Touch Deployment Profiles.
Headend Router Level Redundancy
As covered in the Design Guide, the IKEv2 Load Balancer feature is used to simulate HER redundancy within a single control center. The IKEv2 connection requests coming in from the remote FARs (acting as FlexVPN clients) are distributed among the HER present within a control center (acting as FlexVPN gateways).
HSRP and IKEv2 CLB mechanism is configured specifically on the FlexVPN server side, whereas IKEv2 redirect mechanism is configured on both the server and the client.
This section covers the configuration details used to implement the IKEv2 Load balancer feature using IPv4 backhaul in this solution.
Figure 156 HER Redundancy within a Control Center
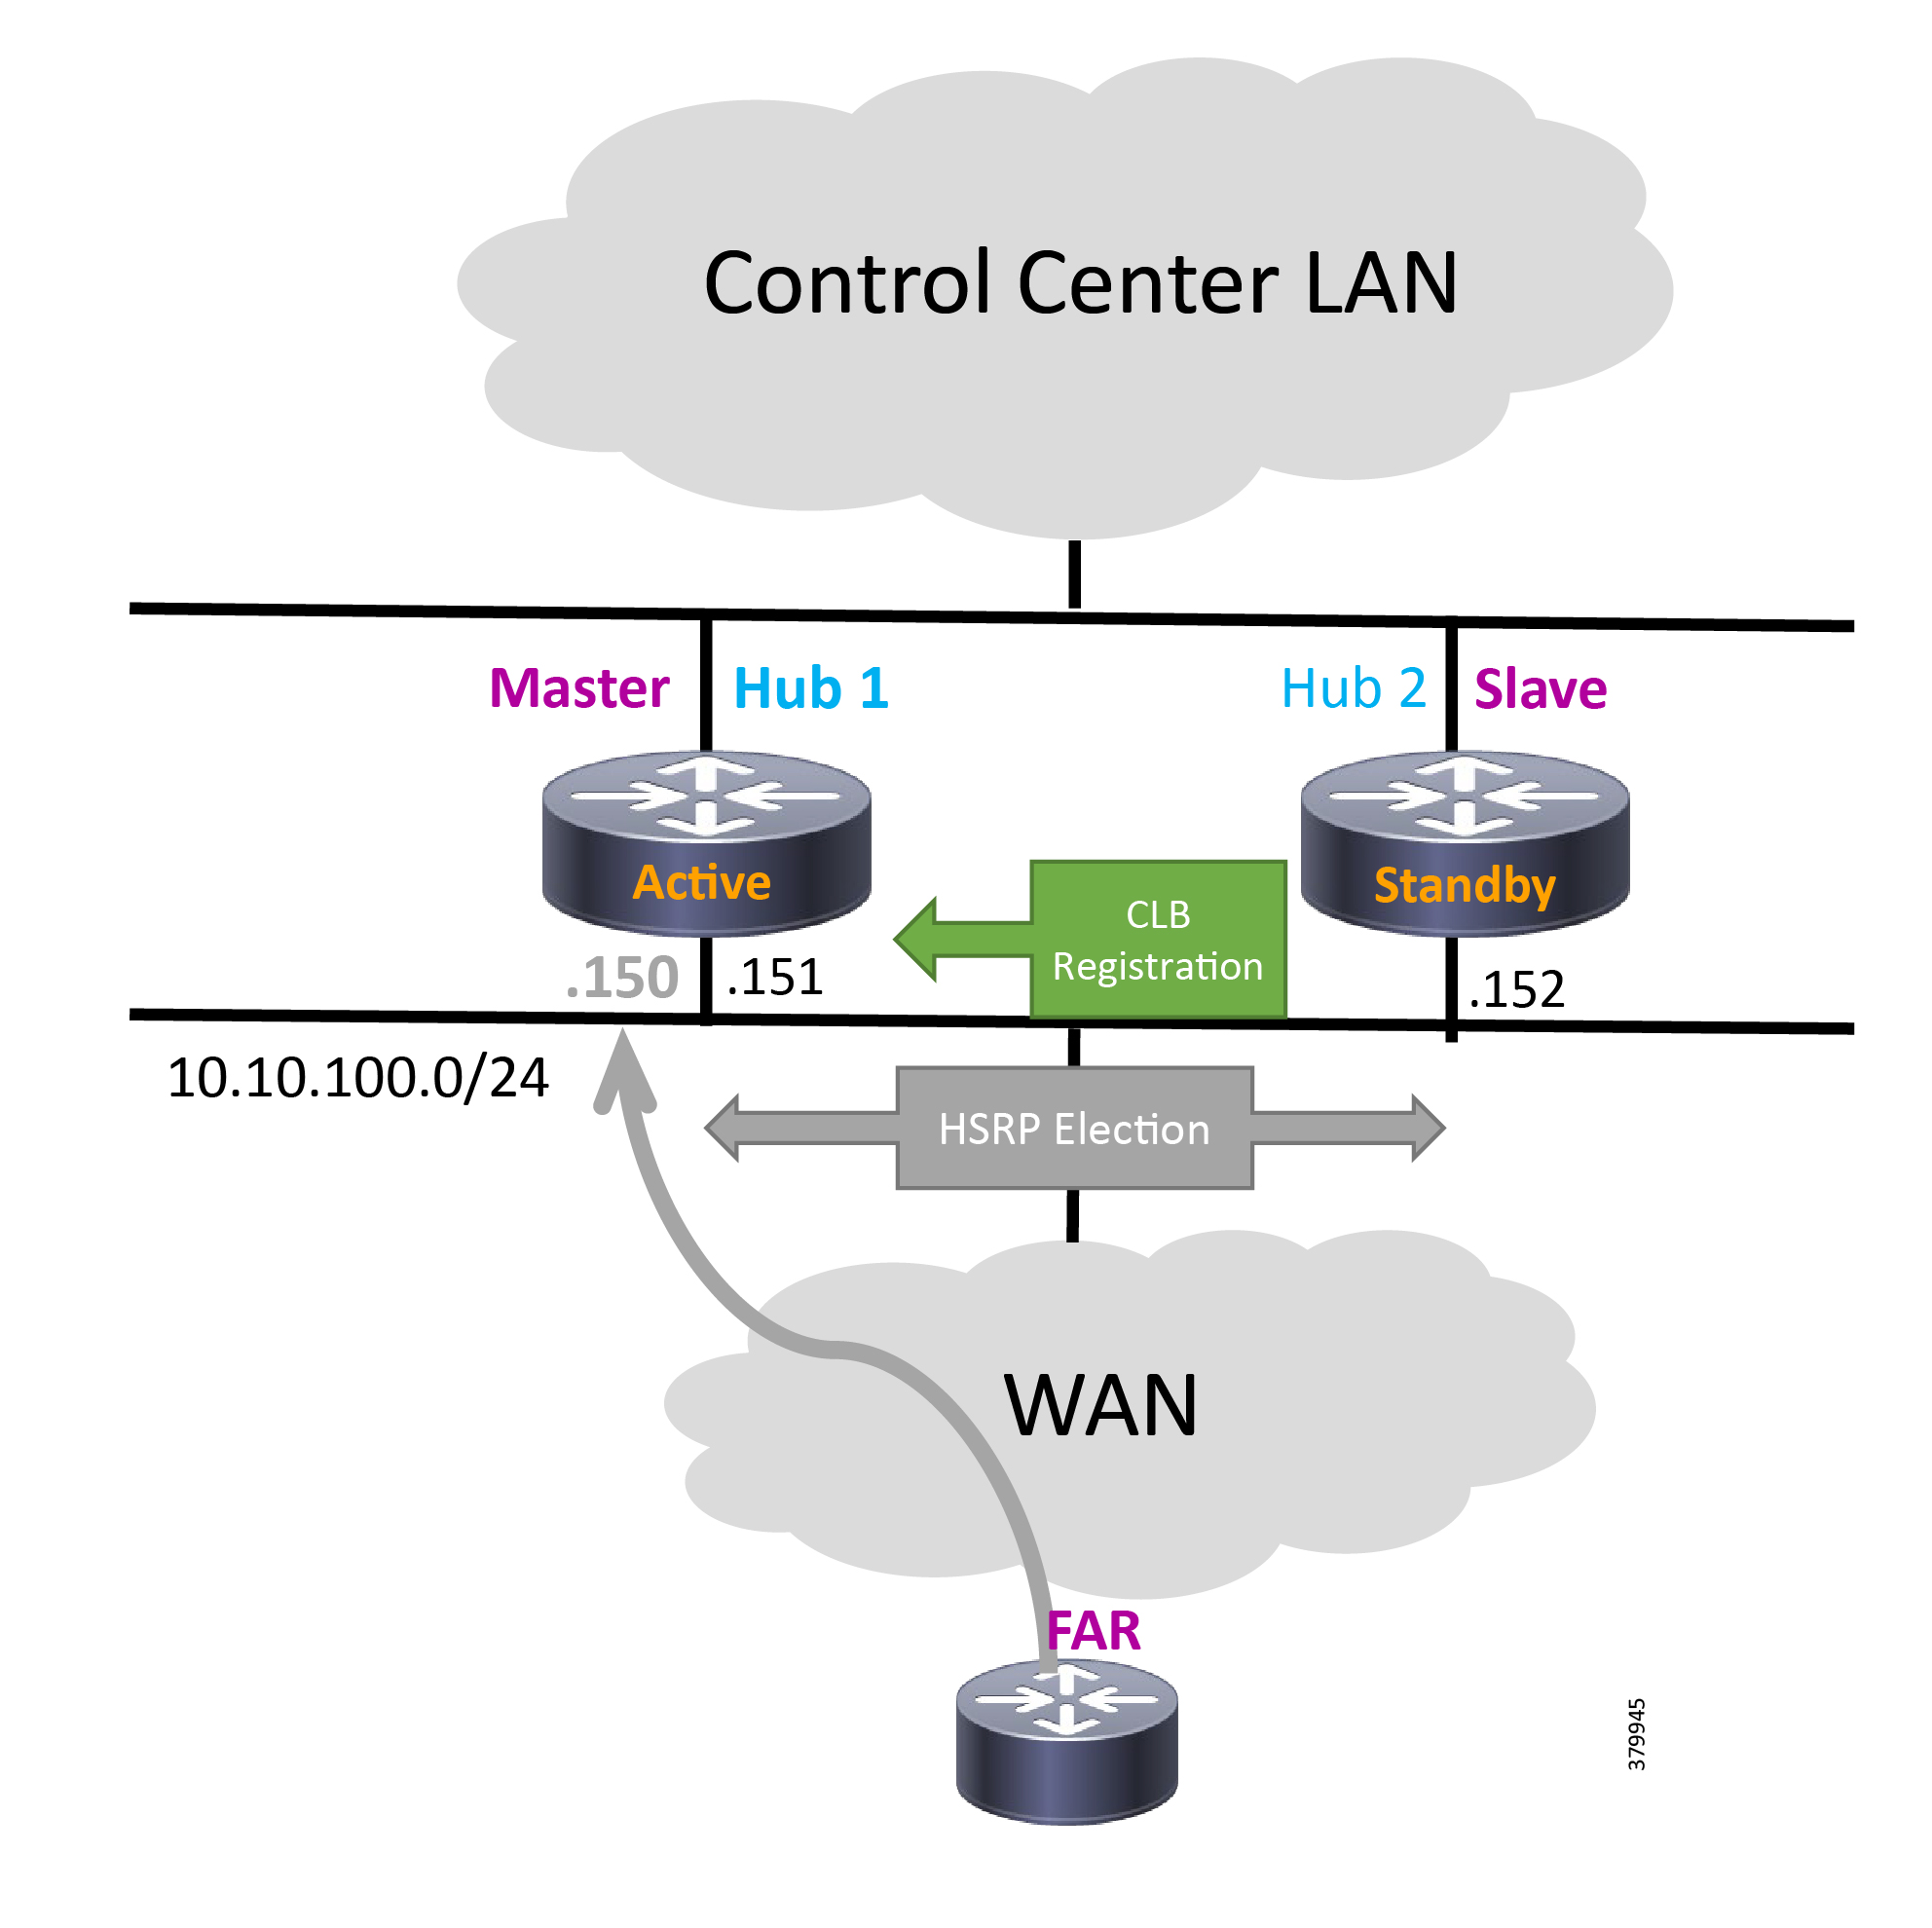
Headend Router
On the server side, a single HSRP group is configured comprising the cluster elements (aka Headend Routers or HERs) for load balancing. The HSRP master that is the active router also plays the role of the CLB master to receive the connection requests from remote clients (aka FARs) and redirects those requests to the least loaded CLB slave.
1.![]() Log in to each HER in the cluster and configure the following commands on the WAN interface to configure an HSRP group. Ensure that the priority is set differently for each cluster member since the active router with higher priority will become the CLB master.
Log in to each HER in the cluster and configure the following commands on the WAN interface to configure an HSRP group. Ensure that the priority is set differently for each cluster member since the active router with higher priority will become the CLB master.
2.![]() Configure the load management mechanism on each cluster element as shown below:
Configure the load management mechanism on each cluster element as shown below:
3.![]() Activate the IKEv2 redirect mechanism on each cluster member using the following command globally:
Activate the IKEv2 redirect mechanism on each cluster member using the following command globally:
Field Area Router
On the client side, configuration is minimal since FlexVPN clients only need to know the Virtual IP (VIP) address of the HSRP cluster.
1.![]() Activate the IKEv2 redirect mechanism on each remote FlexVPN client using the following command:
Activate the IKEv2 redirect mechanism on each remote FlexVPN client using the following command:
2.![]() Point each client to the cluster VIP to connect to under the FlexVPN client configuration section as shown below:
Point each client to the cluster VIP to connect to under the FlexVPN client configuration section as shown below:
Note: For the complete set of working configurations on HER and FAR, please refer to Appendix C: FlexVPN Configurations.
Dual Control Center
As covered in the Design Guide, to simulate control center redundancy from the FAR perspective, two independent clusters of FlexVPN gateways are enabled where each HER cluster represents one control center thereby providing a dual control center topology as shown below.
Figure 157 Dual Control Center Topology

The remote FAR will form two active VPN tunnels, one with each control center. Within each control center though, IKEv2 CLB over IPv4 backhaul will still be used to simulate HER redundancy.
The following configuration shows the specific steps needed on the FAR to achieve this:
IPv6 Backhaul
This section provides the sample FlexVPN config needed on the CGR and HER to bring up the tunnel over the IPv6 backhaul. It includes a virtual template configuration on the hub that allows multiple spoke sessions to be established.
The configuration contains all of the standard building blocks commonly seen within IPv4 backhaul-based FlexVPN with a notable difference being the tunnel mode that uses GRE IPv6 for IPv6 transport address. The tunnel source contains the interface name that has the IPv6 address configured while the tunnel destination directly references the peer IPv6 address on the spoke. For the communication between the hub and the spoke to be successful, the encryption algorithm, hashing algorithm, and Diffie-Hellman group should match between the hub and the spoke. This guide uses X.509 certificate-based authentication.
Note: The IKEv2 Load Balancer feature is currently supported only with IPv4 addressing. An enhancement DDTS filed CSCvc92001 exists to add support to this feature for IPv6 addressing.
Field Area Router
Note: The listed configuration is for reference purposes only because they are pushed by FND as part of PnP bootstrapping, followed by ZTD.
Headend Router
Note: HER configuration is a one-time manual configuration.
IoT Gateway WAN Backhaul Redundancy over Cellular/Ethernet
The Secondary Substation Router or DA Gateways can also be commonly referred to as the IoT Gateway or as FAR.
Secure tunnels are established between the IoT Gateway and the HERs. On the IoT Gateway, the tunnel could be established over a cellular or Ethernet interface, with the tunnel terminating on the same HER. The primary tunnel is established over a cellular interface. The secondary (or backup) tunnel is established over an Ethernet interface. The primary/backup tunnels would operate in active/standby, which means:
■![]() Failover—If the primary tunnel fails, the secondary tunnel would be activated.
Failover—If the primary tunnel fails, the secondary tunnel would be activated.
■![]() Recovery—If the primary tunnel is up, the secondary tunnel would be de-activated.
Recovery—If the primary tunnel is up, the secondary tunnel would be de-activated.
■![]() This automatic failover/recovery is handled with the help of EEM script.
This automatic failover/recovery is handled with the help of EEM script.
The following sections are enumerated in detail:
Head End Router Configuration
The following lines are the necessary configurations required on the HER to establish a tunnel with the FAR.
Note: HER configuration is a one-time manual configuration.
IoT Gateway Configuration
The configuration on the FAR is pushed from the FND:
■![]() Tunnel 0 is the primary tunnel and it is established over cellular.
Tunnel 0 is the primary tunnel and it is established over cellular.
■![]() Tunnel 1 is the secondary tunnel and it is established over Ethernet.
Tunnel 1 is the secondary tunnel and it is established over Ethernet.
Both tunnels use the same IPSec tunnel protection mode, with both the tunnels connecting to the same public IP address configured on HER. The configurations that follow are the configurations required to establish the FlexVPN tunnels, the tunnel configurations, and the interface configurations.
The following configuration, which uses the interface names that are applicable to IR1101, is applicable to other platforms using the appropriate interface naming convention applicable to the platform on which the configuration is applied.
Note: The listed configuration is for reference purpose only since FND pushes it as part of ZTD.
■![]() Tunnel0 is established over cellular interface
Tunnel0 is established over cellular interface
■![]() Tunnel1 is established over Ethernet interface
Tunnel1 is established over Ethernet interface
■![]() Both the tunnels are protected with the same IPSec Profile
Both the tunnels are protected with the same IPSec Profile
Note: The listed configuration is for reference purpose only since the FND pushes it as part of ZTD. The cellular interface is tracked for line-protocol status. If the cellular interface goes down, then tunnel 1 comes up over Ethernet. This redundancy configuration on the IoT Gateway helps minimize the traffic loss and maintain connectivity to the control center.
EEM Script—Automatic Failover/Recovery
In a normal operational mode, FAR connects to HER securely over Tunnel0. Therefore, Tunnel 0 becomes the primary mode of communication between the FAR and the HER. When connectivity over cellular interface fails, the communication between the FAR and the HER must be restored and secured. This restoration of connectivity between the FAR and the HER over a different medium (Ethernet) must be operational and this failover operation of the network helps minimize packet loss and enables secure connectivity over Tunnel 1. This activation of Tunnel1 to carry the load in the event of Tunnel0 failure is referred as Failover.
When connectivity over cellular is restored, the FAR and the HER can communicate securely using Tunnel 0. This switchover from tunnel 1 to tunnel 0 is known as Recovery.
For the switchover to be automatic, EEM script is configured on the FAR. The EEM script tracks the line-protocol of the cellular interface. The following configuration is applied on the FAR.
Note: The listed configuration is for reference purpose only since the FND pushes it as part of ZTD.
Note: The above configuration is applicable to other secondary substation router platforms and DA Gateways as well, with only difference being the change in the interface names across platforms.
IoT Gateway WAN Backhaul Redundancy over Cellular/Cellular
The Secondary Substation Router or DA Gateways can also be commonly referred to as the IoT Gateway or the FAR.
Secure tunnels are established between the IoT Gateway and the HERs. On the IoT Gateway, the tunnel is established over a cellular interface with the tunnel terminating on the same HER. The tunnel is established over the primary cellular interface. A secondary cellular interface provides a redundant feature for the tunnel terminating on the same HER. The tunnel terminating on the HER can be established over the primary or the secondary cellular interface. The primary/backup cellular interfaces would operate in active/standby, which means:
■![]() Failover-If the tunnel over primary cellular interface fails, the tunnel would be activated on the secondary cellular interface.
Failover-If the tunnel over primary cellular interface fails, the tunnel would be activated on the secondary cellular interface.
■![]() Recovery-If the tunnel over primary cellular interface is up, the secondary cellular interface would be de-activated.
Recovery-If the tunnel over primary cellular interface is up, the secondary cellular interface would be de-activated.
■![]() This automatic failover/recovery is handled with the help of EEM script.
This automatic failover/recovery is handled with the help of EEM script.
Please refer to the Design Guide, which articulates the various scenarios discussed in this guide, for more information.
The following sections are enumerated in detail:
Head End Router Configuration
The following lines are the necessary configurations required on the HER to establish a tunnel with the FAR.
Note: The HER configuration is a one-time manual configuration.
The HER configurations are the same as listed in Head End Router Configuration. The following lines needed to be added in order to enable inter HER routing.
IoT Gateway Configuration
This section discusses the implementation of the redundant scenarios covered in the Design Guide.
For Active/Standby, the configuration on the FAR is pushed from the FND:
■![]() Tunnel 0 is the FlexVPN tunnel and it is established over the primary cellular interface.
Tunnel 0 is the FlexVPN tunnel and it is established over the primary cellular interface.
■![]() If there is a failure to connect over primary cellular interface, connectivity is established over the secondary cellular interface.
If there is a failure to connect over primary cellular interface, connectivity is established over the secondary cellular interface.
The tunnel connects to the same public IP address configured on HER. The configurations that follow are the configurations required to establish the FlexVPN tunnels, the tunnel configurations, and the interface configurations.
The following configuration, which uses the interface names that are applicable to IR1101, is applicable to other platforms using the appropriate interface naming convention applicable to the platform on which the configuration is applied. The below configuration is applicable to both Active/Standby and Active/Active scenarios as illustrated in the Design Guide.
Note: The listed configuration is for reference purpose only since FND pushes it as part of ZTD.
Active/Standby-Shut Scenario
In this case, the secondary cellular interface is in down state. In a normal operational mode, FAR connects to HER securely over Tunnel0 over the primary cellular interface (Cellular 0/1/0). This is shown in Figure 158:
Figure 158 Dual-LTE (Active/Standby): Operational State—Traffic over Primary Radio

Therefore, Tunnel 0 over Cellular0/1/0 becomes the primary mode of communication between the FAR and the HER. When connectivity over the primary cellular interface fails, the communication between the FAR and the HER must be restored and secured. This restoration of connectivity between the FAR and the HER over the secondary cellular interface (Cellular 0/3/0) must be operational and this failover operation of the network helps minimize packet loss. This activation of Cellular 0/3/0 to carry the load in the event of Cellular 0/1/0 failure is referred as Failover. The switching of traffic from Primary to Secondary is shown in Figure 159:
Figure 159 Dual-LTE (Active/Standby): Failover State—Traffic over Secondary Radio

When connectivity over Cellular 0/1/0 is restored, the FAR and the HER can communicate securely using Tunnel 0 over Cellular 0/1/0. This switchover of tunnel source from Cellular 0/3/0 to Cellular 0/1/0 is known as Recovery. This is shown in Figure 160:
Figure 160 Dual-LTE (Active/Standby): Recovery State—Switching back to Primary Radio

For the switchover to be automatic, EEM script is configured on the FAR. The sequence of states from Failover to Recovery is shown in the state diagram in Figure 161. The configuration below the diagram implements the state transitions.
Figure 161 Active/Standby-Shut Scenario: Resiliency Life Cycle (EEM Script State Diagram)

Note: The listed configuration is for reference purpose only since the FND pushes it as part of ZTD.
1.![]() The tunnel traffic is over Primary Radio.
The tunnel traffic is over Primary Radio.
2.![]() Failure of the primary cellular interface is detected from the following configuration:
Failure of the primary cellular interface is detected from the following configuration:
3.![]() As soon as a failure is detected on the primary radio, the following lines are executed to activate the Secondary Radio:
As soon as a failure is detected on the primary radio, the following lines are executed to activate the Secondary Radio:
4.![]() Once the secondary LTE is activated, the tunnel traffic now flows through Secondary Radio.
Once the secondary LTE is activated, the tunnel traffic now flows through Secondary Radio.
5.![]() Radio A is continuously monitored using the same commands configured in Step 2 above. The WAN monitoring feature can also used to bring up Radio A from any glitch.
Radio A is continuously monitored using the same commands configured in Step 2 above. The WAN monitoring feature can also used to bring up Radio A from any glitch.
6.![]() If Radio A comes up, we wait for 120s until the tunnel traffic can be switched to Radio A. This is to ensure that the primary radio (Radio A) is stable. This configuration is also covered in Step 2 above by the command “delay up 120.”
If Radio A comes up, we wait for 120s until the tunnel traffic can be switched to Radio A. This is to ensure that the primary radio (Radio A) is stable. This configuration is also covered in Step 2 above by the command “delay up 120.”
7.![]() Once the stability of Radio A is ensured, the following lines are executed to switch the tunnel traffic back to Radio A and the secondary radio (Radio B) is shut.
Once the stability of Radio A is ensured, the following lines are executed to switch the tunnel traffic back to Radio A and the secondary radio (Radio B) is shut.
Active/Standby-UP Scenario
In this case, the secondary cellular interface is in UP state.
In a normal operational mode, FAR connects to HER securely over Tunnel0 over the primary cellular interface (Cellular 0/1/0). Therefore, the Tunnel 0 over Cellular0/1/0 becomes the primary mode of communication between the FAR and the HER. As shown in Figure 162, Tunnel traffic flows through the primary radio.
Figure 162 Dual-LTE (Active/Standby): Operational State—Traffic over Primary Radio

When connectivity over the primary cellular interface fails, the communication between the FAR and the HER must be restored and secured. This restoration of connectivity between the FAR and the HER over the secondary cellular interface (Cellular 0/3/0) must be operational and this failover operation of the network helps minimize packet loss. The change in tunnel source to Cellular 0/3/0 to carry the load in the event of Cellular 0/1/0 failure is referred as Failover. This is shown in Figure 163:
Figure 163 Dual-LTE (Active/Standby): Failover State—Traffic over Secondary Radio

When connectivity over Cellular 0/1/0 is restored, the FAR and the HER can communicate securely using Tunnel 0 over Cellular 0/1/0. This switchover of tunnel source from Cellular 0/3/0 to Cellular 0/1/0 is known as Recovery.
Figure 164 Dual-LTE (Active/Standby): Recovery State—Switching back to Primary Radio

For the switchover to be automatic, EEM script is configured on the FAR. The sequence of states from Failover to Recovery is shown in the state diagram in Figure 165. The configuration following the diagram implements the state transitions.
Figure 165 Active/Standby-UP Scenario: Recovering back to Preferred Radio Case

Note: The listed configuration is for reference purpose only since the FND pushes it as part of ZTD.
1.![]() The tunnel traffic is over the Primary Radio.
The tunnel traffic is over the Primary Radio.
2.![]() Failure of the primary cellular interface is detected from the following configuration:
Failure of the primary cellular interface is detected from the following configuration:
3.![]() As soon as a failure is detected on the Primary Radio, the following lines are executed to switch the tunnel traffic to utilize Secondary Radio (Radio B):
As soon as a failure is detected on the Primary Radio, the following lines are executed to switch the tunnel traffic to utilize Secondary Radio (Radio B):
4.![]() Once the tunnel source is switched, the tunnel traffic now flows through the Secondary Radio.
Once the tunnel source is switched, the tunnel traffic now flows through the Secondary Radio.
5.![]() Radio A is continuously monitored using the same commands configured in Step 2. WAN monitoring feature can also used to bring up Radio A from any glitch.
Radio A is continuously monitored using the same commands configured in Step 2. WAN monitoring feature can also used to bring up Radio A from any glitch.
6.![]() If Radio A comes up, we wait for 120s until the tunnel traffic can be switched to Radio A. This is to ensure that the Primary Radio (Radio A) is stable. This configuration is also covered in Step 2 above by the command “delay up 120.”
If Radio A comes up, we wait for 120s until the tunnel traffic can be switched to Radio A. This is to ensure that the Primary Radio (Radio A) is stable. This configuration is also covered in Step 2 above by the command “delay up 120.”
7.![]() Once the stability of Radio A is ensured, the following lines are executed to switch the tunnel traffic back to Radio A:
Once the stability of Radio A is ensured, the following lines are executed to switch the tunnel traffic back to Radio A:
Active/Active Load Sharing
The FAR configuration is pushed from FND and a sample has been provided on page 164.
In this operational mode, FAR connects to HER1 securely over Tunnel0 over the primary cellular interface (Cellular 0/1/0) and FAR connects to HER2 securely over Tunnel1 over the secondary cellular interface (Cellular 0/3/0). This is shown in Figure 166:
Figure 166 Active/Active Scenario

When connectivity over tunnel0 fails, tunnel1 would be up, which allows the traffic to be routed through the second tunnel. If Active/Standby is implemented, then tunnel 1 has to be shutdown. If Active/Active is implemented, both tunnel 0 and tunnel 1 should be in the up state. The traffic flow, recovery, and failover is shown as a state diagram in Figure 167:
Figure 167 Dual-LTE (Active/Active): Traffic Flow Resiliency Cycle

Both the LTEs and the respective tunnel interfaces are up. The traffic can take any path to the control center. This approach provides more redundancy and bandwidth and ensures that the data loss is minimized to the maximum extent.
1.![]() The Tunnel0 traffic flows through Radio A and the Tunnel1 traffic flows through Radio B.
The Tunnel0 traffic flows through Radio A and the Tunnel1 traffic flows through Radio B.
2.![]() Load Balancing of traffic happens as there exists two paths to the destination.
Load Balancing of traffic happens as there exists two paths to the destination.
3.![]() Failure of one Radio does not affect the flow traffic, as the traffic flows over the other active tunnel.
Failure of one Radio does not affect the flow traffic, as the traffic flows over the other active tunnel.
4.![]() QoS policies are configured to ensure that critical traffic is given priority. This is discussed in the subsequent sections.
QoS policies are configured to ensure that critical traffic is given priority. This is discussed in the subsequent sections.
5.![]() WAN monitoring can be used to recover the radio.
WAN monitoring can be used to recover the radio.
6.![]() If the failed Radio is recovered, load balancing of the traffic continues and the process repeats.
If the failed Radio is recovered, load balancing of the traffic continues and the process repeats.
WAN Monitoring
In the previous sections, we talked about EEM scripts that have been used to switch from one radio to another. Sometimes due to a glitch in the hardware, the possibility exists that one of the radio may fail. In such cases, a simple manual 'shut'/'no shut' CLI execution on the device may trigger the radio to come up. However, if the FARs are located in a remote place where a console connection is unlikely, then a manual 'shut'/'no shut' operation is not possible. However, a substitute to this manual operation is the WAN monitoring feature available in the latest software for the FAR. Using this feature, the glitch in the hardware can be overcome to recover the failed radio. This feature can be implemented in both Active/Standby and Active/Active scenarios. Following is an example configuration, which can be extended to recover both interfaces.
For design and conceptual understanding, please refer to the “WAN Backhaul Redundancy” section in the Design Guide.
IP Services
This chapter includes the following major topics:
Quality of Service
Quality of Service (QoS) refers to the ability of the network to provide priority service to selected network traffic. Improved and more predictable network service can be offered by:
■![]() Supporting dedicated bandwidth—that is, cellular links have different upload/download bandwidth/throughput
Supporting dedicated bandwidth—that is, cellular links have different upload/download bandwidth/throughput
■![]() Reducing loss characteristics—DA real-time traffic prioritization
Reducing loss characteristics—DA real-time traffic prioritization
■![]() Avoiding and managing network congestion—multi-services traffic
Avoiding and managing network congestion—multi-services traffic
■![]() Setting traffic priorities across the network—multi-services capabilities
Setting traffic priorities across the network—multi-services capabilities
QoS is a key feature when designing the multi-services Distribution Automation solution since traffic from AMI, DA, Remote Workforce, and network management use cases must be differentiated and prioritized. Estimated transport losses, delay, and jitter introduced by networking devices must be understood when forwarding sensitive data, particularly when a WAN backhaul link offers a limited amount of bandwidth.
In the case of dual-WAN interfaces with different bandwidth capabilities (that is, cellular), QoS policies must be applied to prioritize the traffic allowed to flow over these limited bandwidth links, to determine which traffic can be dropped, etc.
On a multi-services DA solution, QoS DiffServ and CoS (IEEE 802.1p) can apply to traffic categorized as:
■![]() IPv4 Traffic—Distribution Automation (FLISR), protocol translation (RTU monitoring), and network management
IPv4 Traffic—Distribution Automation (FLISR), protocol translation (RTU monitoring), and network management
■![]() IPv6 Traffic—IPV6 IED AMI and network management
IPv6 Traffic—IPV6 IED AMI and network management
■![]() Layer 2 Traffic—Distribution Automation such as IEC 61850 GOOSE/SV traffic switches between Ethernet interfaces and IEC 61850 traffic bridged over WAN links between substations
Layer 2 Traffic—Distribution Automation such as IEC 61850 GOOSE/SV traffic switches between Ethernet interfaces and IEC 61850 traffic bridged over WAN links between substations
Figure 168 lists the different priorities among Distribution Automation traffic:
Figure 168 DA Traffic Priority Chart
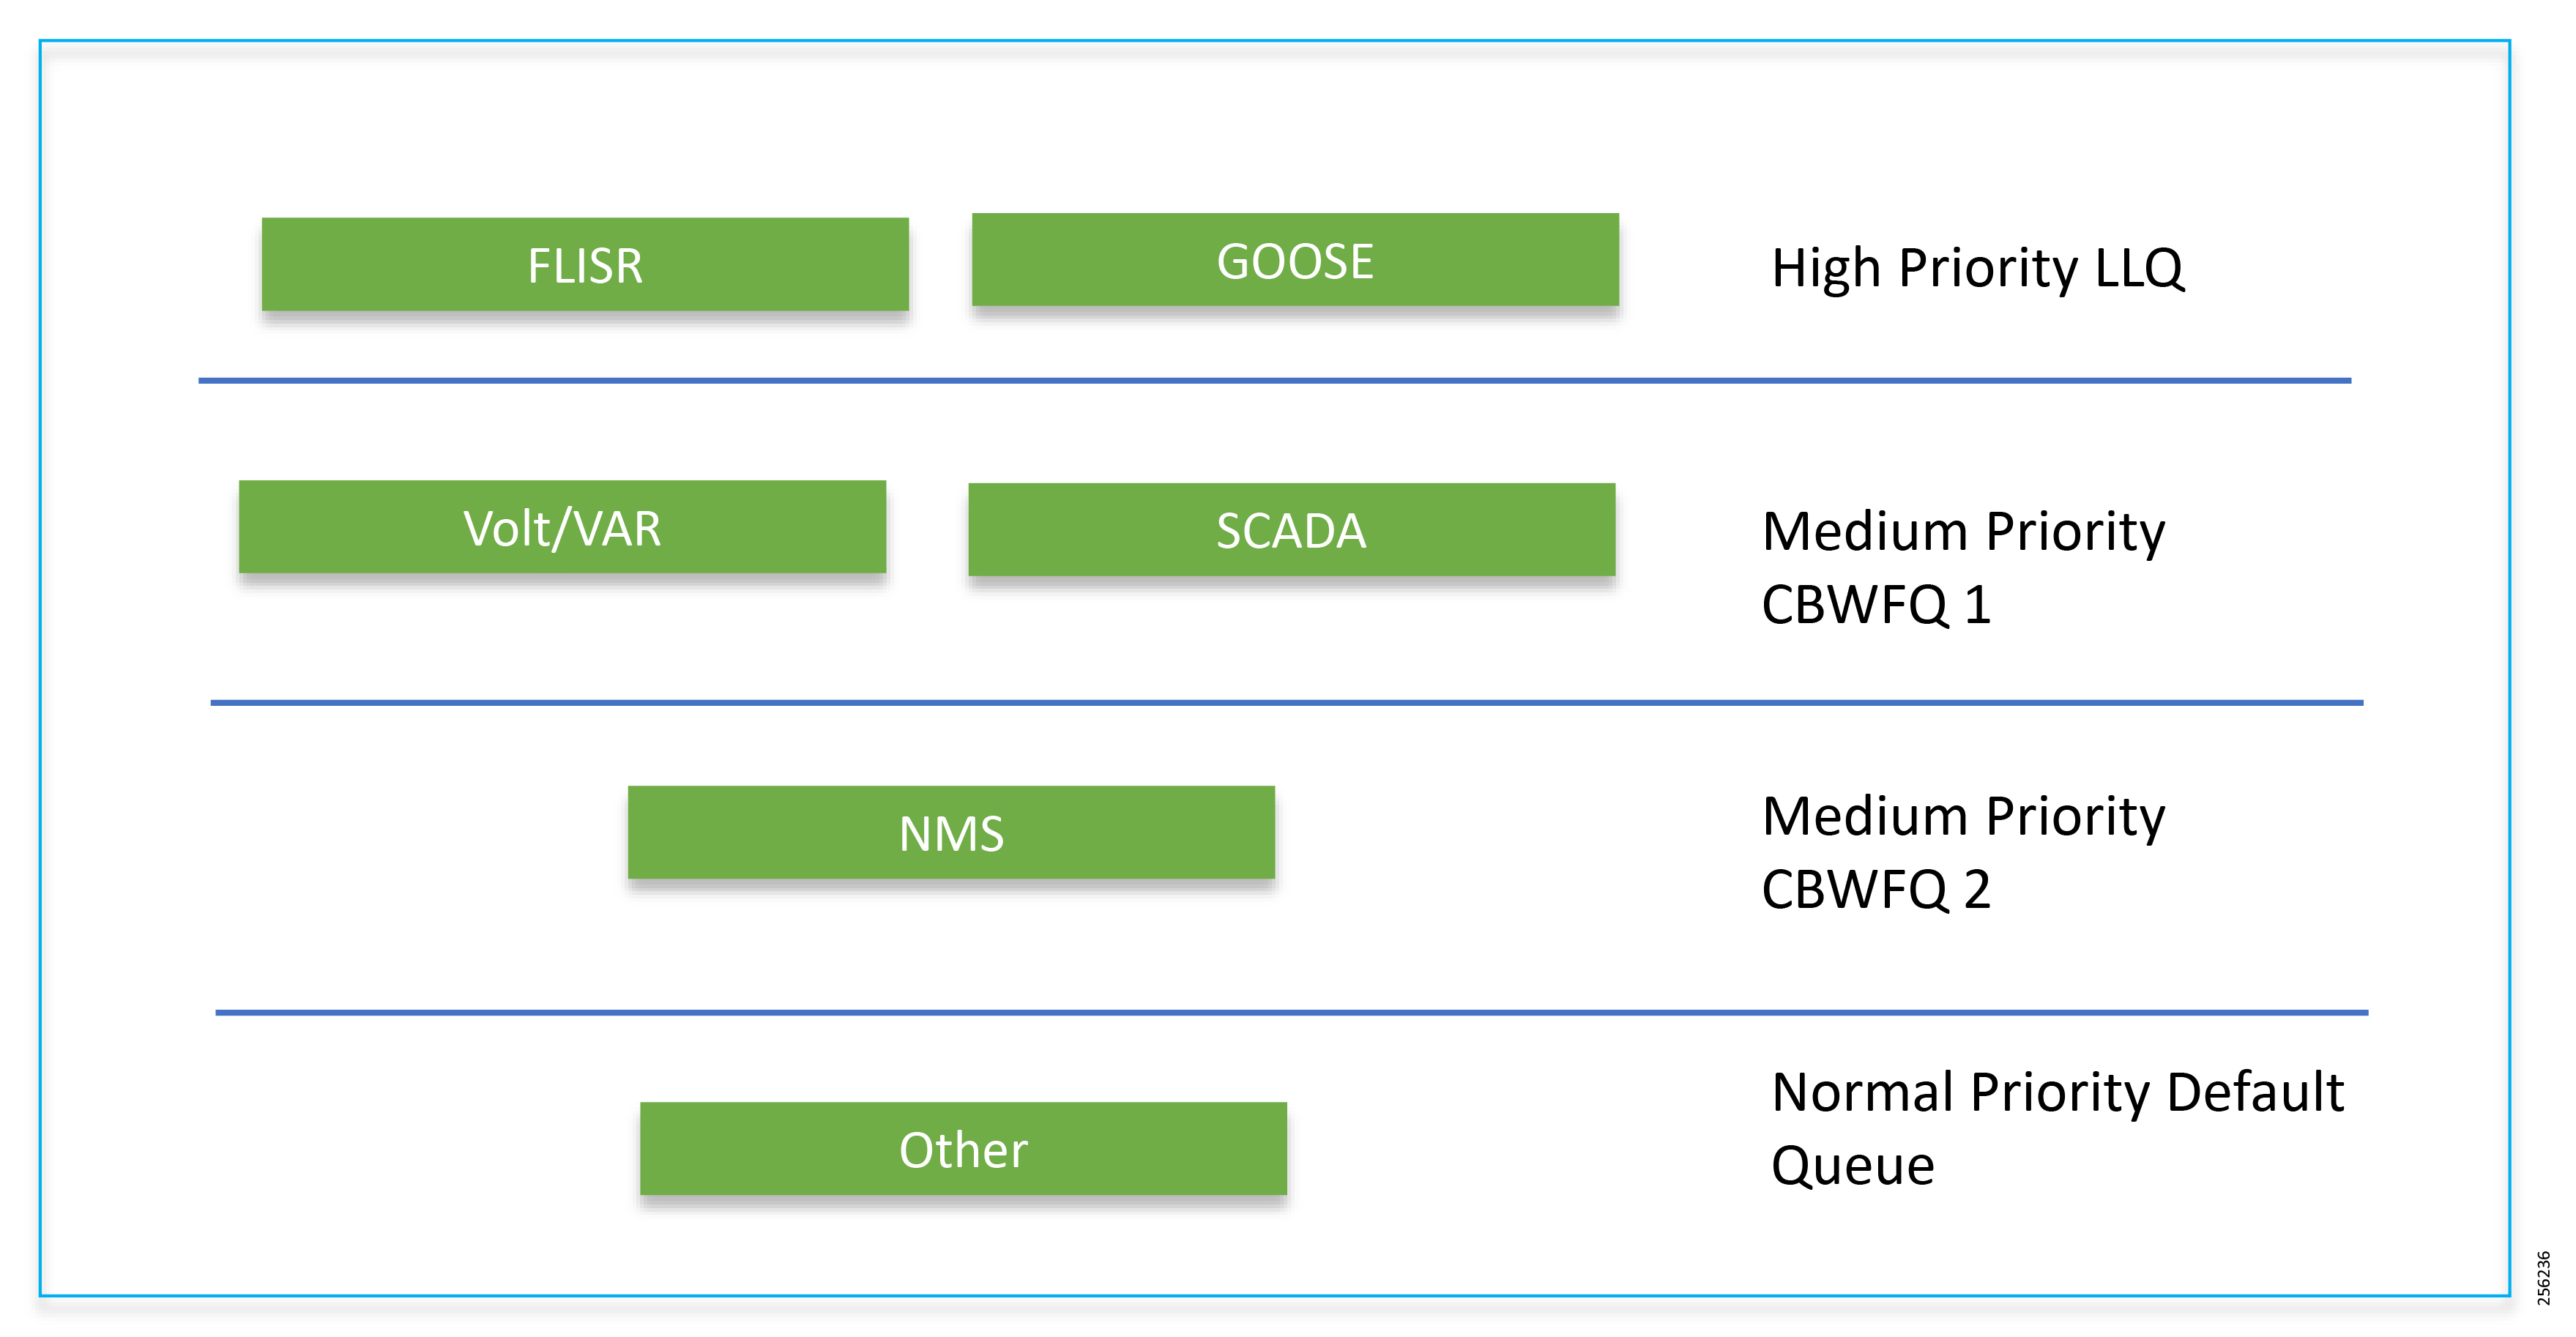
Following the IETF Differentiated Service model, the DA Solution will deliver a service type that is based on the QoS specified by each packet. This specification can occur in different ways, for example using the IP Precedence bit settings in IP packets or source and destination addresses. The QoS specification can be used to classify, mark, shape, and police traffic, and to perform intelligent queuing.
The SSR or DA Gateway performs QoS actions on Layer 3 (cellular, Ethernet) interfaces. The sequencing of QoS actions on egress traffic is as follows:
Upstream QoS—From DA IED to SCADA
The DA IEDs perform the marking functionality. If the IED does not have capability to mark the IP packets, the DA Gateway or SSR can perform the marking functionality. On egress WAN interface, queuing will be performed. High priority FLISR and GOOSE traffic will be assigned in Low Latency Queue. Medium priority traffic like Volt-Var and MMS will be assigned in Class-Based Weighted Fair Queue 1 and IOT FND Network management traffic will be assigned in Class-Based Weighted Fair Queue2. The rest of the traffic will be treated with normal priority and will be assigned to a default queue. All QoS is done based on DSCP marking.
Note: It is recommended to define queuing bandwidth as a remaining percentage instead of values so that the same policy can be applied across Cellular or Ethernet backhaul interfaces
Headend Router: ASR 1000, which supports a rich QoS feature set from Cisco IOS, provides DoS protection for applications like the FND and SCADA. For complete details, refer to the latest documentation link:
■![]() https://www.cisco.com/c/en/us/products/collateral/routers/asr-1002- router/solution_overview_c22-449961.html
https://www.cisco.com/c/en/us/products/collateral/routers/asr-1002- router/solution_overview_c22-449961.html
Figure 169 Upstream QoS IED to SCADA
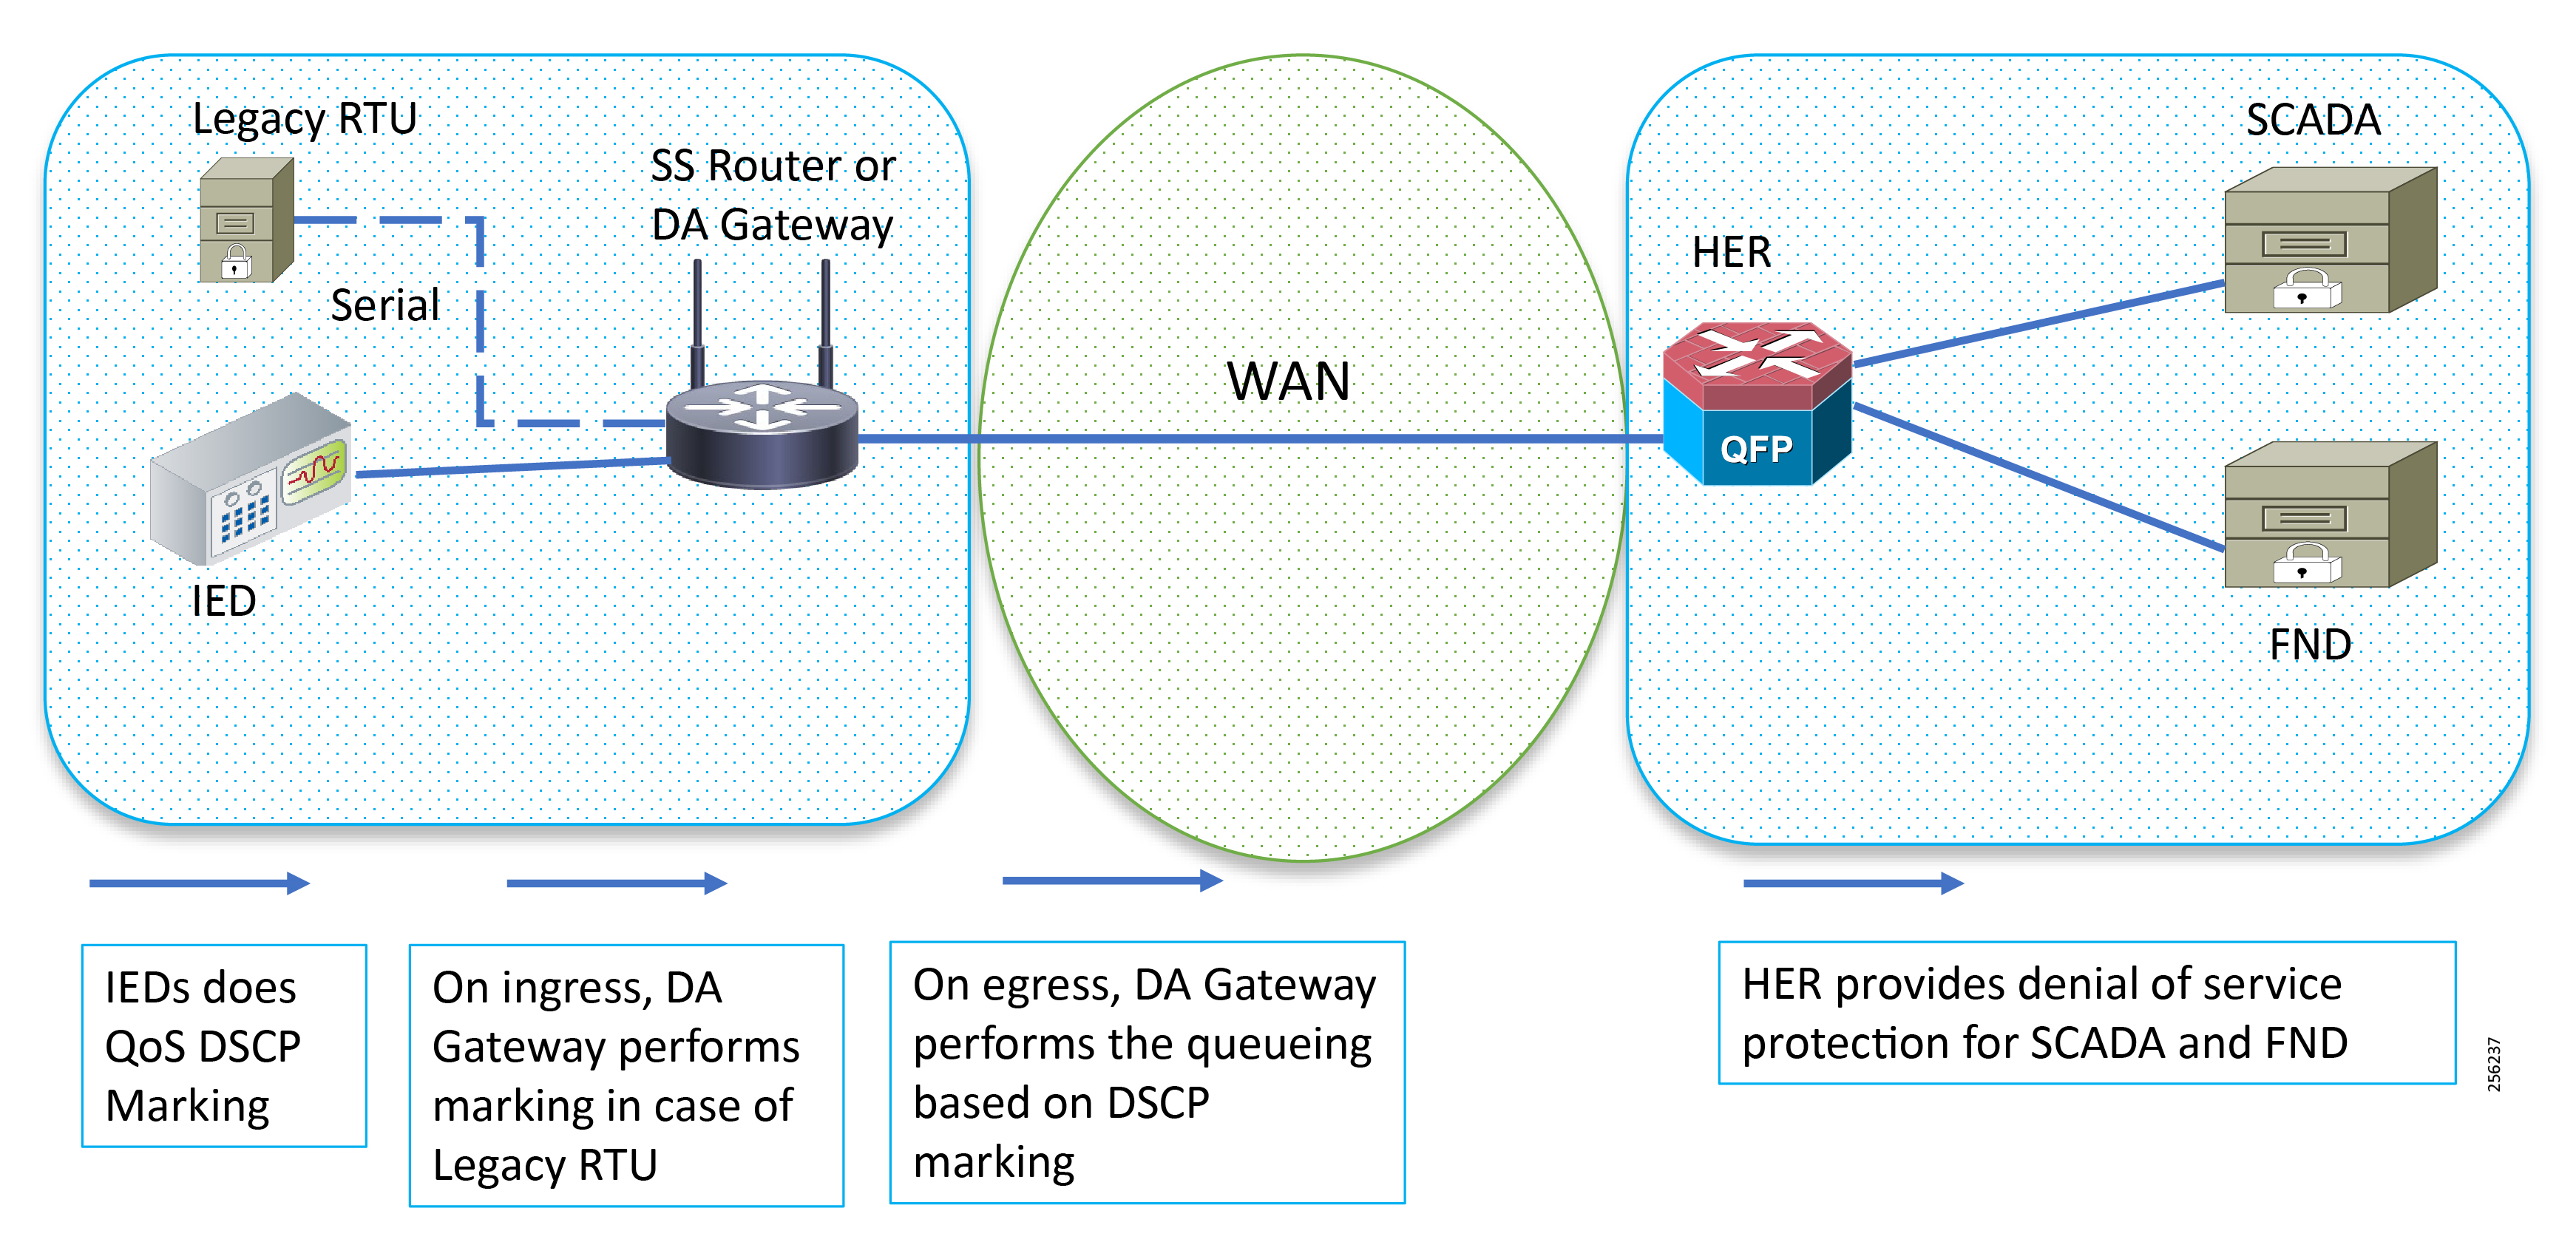
Raw Socket QoS Marking
If RTU is connected to DA Gateway via the R232 async serial interface and if the raw socket feature is enabled, marking will be enabled on serial line.
Class-based policy is not supported on serial interfaces. The packets received on the serial interface should be marked on the corresponding line of the serial interface. The following configurations should be applied on the line interface:
After marking the packets from the serial interface, these marked packets can be prioritized at the WAN interface using the following class-map and policy-map. Since the SCADA traffic is encapsulated before it is sent out via the tunnel interface on the WAN interface, the QoS pre-classify command should be applied on the corresponding tunnel interface.
Queuing on DA Gateway WAN Port
Network Address Translation
This section corresponds to the “Network Address Translation” section of the Design Guide, which can be referred to for more details. The IoT Gateway is capable of supporting both NAT and non-NAT scenarios described in the Design Guide. The NAT scenario has been implemented in this Implementation Guide.
Note: This configuration is pushed as part of ZTD (during device registration phase). The FND leverages the SCADA ICT Enablement profiles discussed in Appendix D: SCADA ICT Enablement Profiles.
Note: The Loopback address is assigned to the IoT Gateway during the Tunnel provisioning phase of ZTD, and it uniquely represents the IoT Gateway in the solution.
In Figure 170, the SCADA Master communicates with the IP address of the IoT Gateway (represented by its loopback address—for example, 192.168.150.21) on port number 2404.
Figure 170 Network Address Translation
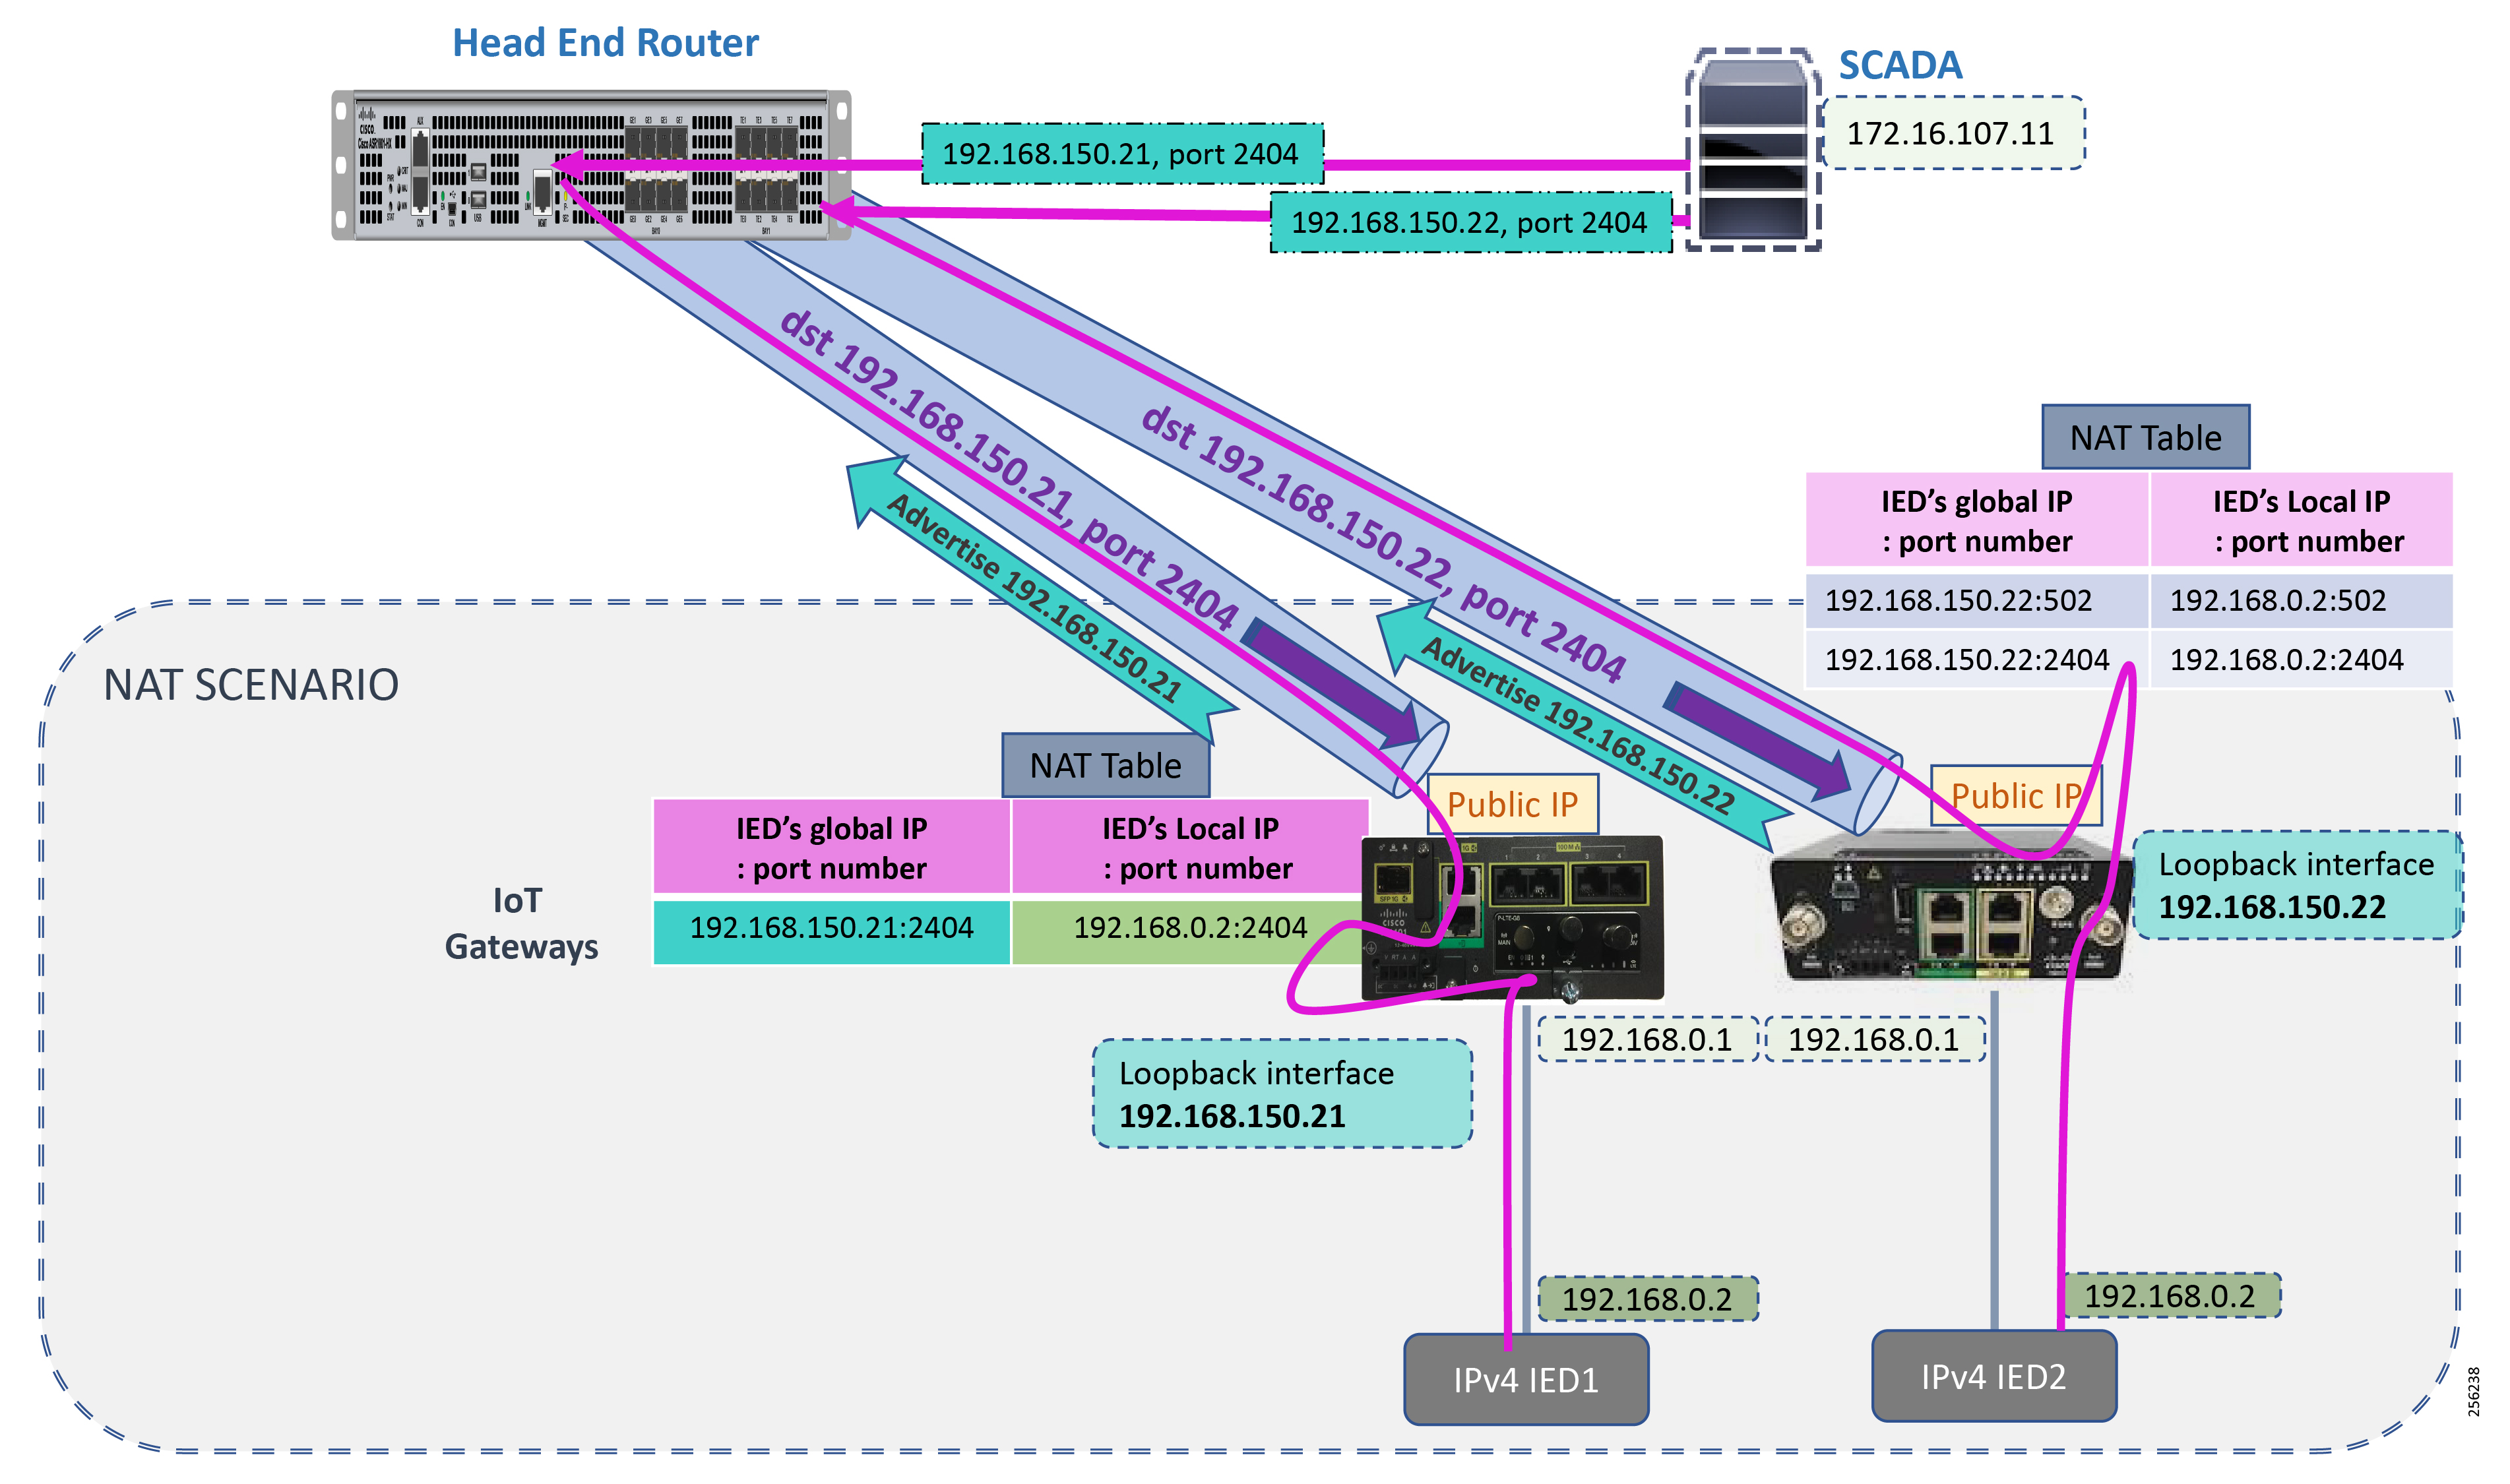
Once the communication reaches the IoT Gateway, the NAT table is referenced for the IoT Gateway IP (for example, 192.168.150.21) and port 2404, and the IP address and port number of the IED is derived.
Communication is then forwarded to IED IP (192.168.0.2) on port 2404. In summary:
■![]() The SCADA communication on 192.168.150.21 on port 2404 is sent to IED1:2404
The SCADA communication on 192.168.150.21 on port 2404 is sent to IED1:2404
■![]() The SCADA communication on 192.168.150.22 on port 2404 is sent to IED2:2404
The SCADA communication on 192.168.150.22 on port 2404 is sent to IED2:2404
NAT on IR1101
The Layer 3 port connected to the IED is VLAN1, which should be enabled as a NAT inside interface. The Layer 3 port providing connectivity to the control center is the FlexVPN IPSec Tunnel interface, which should be enabled as a NAT outside interface.
Note: The Fast Ethernet ports of IR1101 are Layer 2. The Layer 3 IP address is configured on the VLAN interface:
NAT on IR807
The Layer 3 port connected to the IED is FastEthernet1, which should be enabled as a NAT inside interface. The Layer 3 port providing connectivity to the control center is the FlexVPN IPSec Tunnel interface, which should be enabled as a NAT outside interface.
Note: The Fast Ethernet ports of the IR807 are Layer 3:
NAT configurations on other IoT Gateway platforms (like CGR1000 and IR8xx platforms) would be similar to the ones captured above.
Appendix A: PnP Profiles
This appendix includes the following major topics:
■![]() Bootstrapping Template for IPv4 Network
Bootstrapping Template for IPv4 Network
■![]() Bootstrapping Template for IPv6 Network
Bootstrapping Template for IPv6 Network
■![]() Bootstrapping Template for Provisioning and ZTD at the Deployed Location
Bootstrapping Template for Provisioning and ZTD at the Deployed Location
Bootstrapping Template for IPv4 Network
Bootstrapping of the IoT Gateways that would NOT be deployed behind the NAT
These substitutions need to be performed in the following bootstrapping template:
■![]() fingerprint 'CFA2613029B11E461430A2DC5F624147CCEE6469' must be replaced by the fingerprint of the RSA CA server that issues the certificate to the FND, TPS and FAR.
fingerprint 'CFA2613029B11E461430A2DC5F624147CCEE6469' must be replaced by the fingerprint of the RSA CA server that issues the certificate to the FND, TPS and FAR.
Bootstrap Profile Name: IPv4-BOOTSTRAP
Bootstrapping of IoT Gateways that Would be Deployed behind NAT
These substitutions need to be performed in the following bootstrapping template:
■![]() fingerprint 'CFA2613029B11E461430A2DC5F624147CCEE6469' must be replaced by the fingerprint of the RSA CA server that issues the certificate to the FND, TPS and FAR.
fingerprint 'CFA2613029B11E461430A2DC5F624147CCEE6469' must be replaced by the fingerprint of the RSA CA server that issues the certificate to the FND, TPS and FAR.
Bootstrap Profile Name: IPv4-BOOTSTRAP-NAT
Bootstrapping Template for IPv6 Network
Bootstrapping of the IoT Gateways that Would NOT be Deployed Behind the NAT
These substitutions need to be performed in the following bootstrapping template:
■![]() fingerprint 'CFA2613029B11E461430A2DC5F624147CCEE6469' must be replaced by the fingerprint of the RSA CA server that issues the certificate to the FND, TPS and FAR.
fingerprint 'CFA2613029B11E461430A2DC5F624147CCEE6469' must be replaced by the fingerprint of the RSA CA server that issues the certificate to the FND, TPS and FAR.
Bootstrap Profile Name: IPv6-BOOTSTRAP
Bootstrapping Template for Provisioning and ZTD at the Deployed Location
Bootstrapping of the IoT Gateways
These templates are used when the bootstrapping location and deployment location are the same. No manual intervention is need. Once the device is powered with a SIM card inserted, bootstrapping should begin and push the configuration from FND. The following template is an example of the template validated for IR1101. The template can be used for other platforms with minor changes such as the cellular interface.
Appendix B: FND Zero Touch Deployment Profiles
This appendix includes the following major topics:
■![]() Device Configuration Profiles
Device Configuration Profiles
Tunnel Provisioning Profiles
The Tunnel Provisioning Profile could also be referred as the “Tunnel Group.” For steps to create a new Tunnel group, please refer to the “Creating Tunnel Groups” section of the Cisco IoT FND guide.
Once the Tunnel group is created, move the IoT Gateways under the appropriate “Tunnel Group.” For steps, please refer to the “Moving FARs to Another Group” section of the Cisco IoT FND Guide.
Tunnel Group for IPv4 Network
Tunnel Group Name: IPv4_primary_tunnel_provision Sample csv file to import in FND
IoT Gateways need to be added into FND for the purpose of management. They could be added to FND by importing a csv file. A sample csv file is shown in Figure 171:
Figure 171 IoT-Gateway-deployment-over-IPv4-Backhaul-csvfile

For more details about various other csv parameters to be used during csv import at FND, please refer to Prepare.csv (Comma-Separated Value) Files to Import New Devices on FND at the following URL:
■![]() https://www.cisco.com/c/en/us/support/docs/cloud-systems-management/iot-field-network-director/210446-Prepare-csv-Comma-Separated-Value-fil.html
https://www.cisco.com/c/en/us/support/docs/cloud-systems-management/iot-field-network-director/210446-Prepare-csv-Comma-Separated-Value-fil.html
Note: To have the IoT Gateway operate in Dual Control Center scenarios, populate the fields for tunnelSrcInterface2 and IPSecTunnelDestAddr2. Leave them empty for Single Control Center scenarios.
Note: Substitute the IP address with your FND IP address for fnd.ipg.cisco.com in the following template:
For FARs running IOS, configure a FlexVPN client in order to establish secure communications to the HER. This template expects that the HER has been appropriately pre-configured as a FlexVPN server:
If the loopback interface ipv4 address property has been set on the CGR, configure the interface with that address. Otherwise, obtain an address for the interface now using DHCP:
Obtain an ipv4 address that can be used to for this FAR's Loopback interface. The template API provides methods for requesting a lease from a DHCP server. The ipv4 address method requires a DHCP client ID and a link address to send in the DHCP request. The third parameter is optional and defaults to “IoT-FND.” This value is sent in the DHCP user class option.
The API also provides the method “dhcpClientId,” which takes a DHCPv6 Identity association identifier (IAID) and a DHCP Unique IDentifier (DUID) and generates a DHCPv4 client identifier as specified in RFC 4361. This provides some consistency in how network elements are identified by the DHCP server.
If the loopback interface ipv6 address property has been set on the CGR, configure the interface with that address. Otherwise, obtain an address for the interface now using DHCP.
Obtain an ipv6 address that can be used to for this FAR's loopback interface. The method is similar to the one used for ipv4, except clients in DHCPv6 are directly identified by their DUID and IAID. IAIDs used for ipv4 are separate from IAIDs used for ipv6, so we can use zero for both requests:
Default to using FlexVPN for the tunnel configuration of FARs running IOS.
FlexVPN certificate map that matches if the peer (HER) presents a certificate whose issuer common name contains the string given in the FAR property certIssuerCommonName:
ipv4 ACL that specifies the route(s) FlexVPN will push to the HER. We want the HER to know the route to the CGR's loopback interface:
ipv6 ACL that specifies the route(s) FlexVPN will push to the HER. We want the HER to know the route to the CGR's loopback interface. If a mesh has been configured on this CGR, we want the HER to know the route to the mesh:
FlexVPN authorization policy that configures FlexVPN to push the CGR LANs specified in the ACLs to the HER during the FlexVPN handshake:
If the headend router is an ASR, use a different configuration for the transform set since some ASR models are unable to support the set that we would prefer to use:
Tunnel Group for IPv6 Network
Tunnel Group Name: IPv6_primary_tunnel_provision Sample csv file to import in FND
IoT Gateways need to be added into FND for the purpose of management. They could be added to FND by importing a csv file. A sample csv file is shown in Figure 172:
Figure 172 IoT-Gateway-deployment-over-IPv6-backhaul-csvfile

For more details about csv file parameters, please refer to Prepare.csv (Comma-Separated Value) Files to Import New Devices on FND at the following URL:
■![]() https://www.cisco.com/c/en/us/support/docs/cloud-systems-management/iot-field-network-director/210446-Prepare-csv-Comma-Separated-Value-fil.html
https://www.cisco.com/c/en/us/support/docs/cloud-systems-management/iot-field-network-director/210446-Prepare-csv-Comma-Separated-Value-fil.html
Note: Substitute the IP address for fnd.ipg.cisco.com with your FND IP address in the following template. Both the IPv4 and IPv6 address of the FND would be reachable from the IoT Gateway once the Tunnel is established. This template uses the IPv4 address of the FND for the IoT Gateway registration with the FND:
For FARs running IOS, configure a FlexVPN client in order to establish secure communications to the HER. This template expects that the HER has been appropriately pre-configured as a FlexVPN server:
If the loopback interface ipv4 address property has been set on the CGR, configure the interface with that address. Otherwise, obtain an address for the interface now using DHCP:
Obtain an ipv4 address that can be used to for this FAR's Loopback interface. The template API provides methods for requesting a lease from a DHCP server. The IPv4 address method requires a DHCP client ID and a link address to send in the DHCP request. The third parameter is optional and defaults to “IoT-FND.” This value is sent in the DHCP user class option.
The API also provides the method “dhcpClientId.” This method takes a DHCPv6 Identity Association Identifier (IAID) and a DHCP Unique IDentifier (DUID) and generates a DHCPv4 client identifier as specified in RFC 4361. This provides some consistency in how network elements are identified by the DHCP server:
If the loopback interface ipv6 address property has been set on the CGR, then configure the interface with that address. Otherwise obtain an address for the interface now using DHCP:
Obtain an ipv6 address that can be used to for this FAR's loopback interface. The method is similar to the one used for ipv4, except clients in DHCPv6 are directly identified by their DUID and IAID. IAIDs used for ipv4 are separate from IAIDs used for ipv6, so we can use zero for both requests:
FlexVPN certificate map that matches if the peer (HER) presents a certificate whose issuer’s common name contains the string given in the FAR property:
IPv4 ACL that specifies the route(s) FlexVPN will push to the HER. We want the HER to know the route to the CGR's loopback interface:
ipv6 ACL that specifies the route(s) FlexVPN will push to the HER. We want the HER to know the route to the CGR's loopback interface. If a mesh has been configured on this CGR, we want the HER to know the route to the mesh:
FlexVPN authorization policy that configures FlexVPN to push the CGR LAN's specified in the ACLs to the HER during the FlexVPN handshake:
If the headend router is an ASR, use a different configuration for the transform set since some ASR models are unable to support the set we'd prefer to use:
Configure the tunnel using DMVPN:
DMVPN certificate map that matches if the peer (HER) presents a certificate whose issuer’s common name contains the string given in the FAR property:
If the headend router is an ASR, then use a different configuration for the transform set since some ASR models are unable to support the set we'd prefer to use:
Device Configuration Profiles
The device configuration profile could also be referred to as the “Configuration Group.” For steps to create a new configuration group and move necessary IoT Gateways under it, please refer to the “Configuring Device Group Settings” section of the Cisco IoT FND Guide at the following URL:
■![]() https://www.cisco.com/c/en/us/td/docs/routers/connectedgrid/iot_fnd/guide/4_2/iot_fnd_ug4_2/device_mgmt.html#16666
https://www.cisco.com/c/en/us/td/docs/routers/connectedgrid/iot_fnd/guide/4_2/iot_fnd_ug4_2/device_mgmt.html#16666
To enable “Ready to Go” SCADA traffic post ZTD, configuration profiles mentioned in Appendix D: SCADA ICT Enablement Profiles could be used.
Appendix C: FlexVPN Configurations
This appendix provides the complete running configuration taken from the CGR and the HER, which includes the IKEv2 CLB bringing up the FlexVPN tunnel over IPv4 backhaul. It includes the following major topics:
IoT Gateway Configuration
Note: The IoT Gateway configuration is for reference only since it is configured by ZTD.
Headend Router Configuration
Appendix D: SCADA ICT Enablement Profiles
This appendix includes the following major topics:
■![]() IR1101 Platform: Single Control Center Profiles
IR1101 Platform: Single Control Center Profiles
■![]() IR1101 Platform: Dual Control Center Profiles
IR1101 Platform: Dual Control Center Profiles
■![]() IR807 Platform: Single Control Center Profiles
IR807 Platform: Single Control Center Profiles
■![]() IR807 Platform: Dual Control Center Profiles
IR807 Platform: Dual Control Center Profiles
IR1101 Platform: Single Control Center Profiles
ICT Enablement for IP-based IED using IR1101
The following scenarios were validated using this profile:
■![]() IP-based IED is configured with 192.168.0.2.
IP-based IED is configured with 192.168.0.2.
■![]() Default gateway for IED is 192.168.0.1, which is the IP address of IR1101.
Default gateway for IED is 192.168.0.1, which is the IP address of IR1101.
■![]() IED is connected to FastEthernet0/0/1 and listening on port 2404.
IED is connected to FastEthernet0/0/1 and listening on port 2404.
■![]() SCADA Master IP address is 172.16.107.11.
SCADA Master IP address is 172.16.107.11.
■![]() SCADA Master reaches the IP IED on the IoT Gateway IP on port 2404.
SCADA Master reaches the IP IED on the IoT Gateway IP on port 2404.
Configuration Group Name: IR1101_SINGLE_CC_IP_Only
ICT Enablement for Serial and/or IP-based IED using IR1101
The following scenarios were validated using this profile:
■![]() IP-based IED is configured with 192.168.0.2.
IP-based IED is configured with 192.168.0.2.
■![]() Default gateway for IED is 192.168.0.1, which is the IP address of IR1101.
Default gateway for IED is 192.168.0.1, which is the IP address of IR1101.
■![]() IED is connected to FastEthernet0/0/1, and listening on port 2404.
IED is connected to FastEthernet0/0/1, and listening on port 2404.
■![]() SCADA Master IP address is 172.16.107.11.
SCADA Master IP address is 172.16.107.11.
■![]() Configuration of the serial interface validated is 9600-8N1.
Configuration of the serial interface validated is 9600-8N1.
■![]() Serial interface validated is Async0/2/0 (corresponds to line 0/2/0).
Serial interface validated is Async0/2/0 (corresponds to line 0/2/0).
■![]() SCADA Master reaches the IP IED on IoT Gateway IP on port 2404.
SCADA Master reaches the IP IED on IoT Gateway IP on port 2404.
■![]() SCADA Master reaches the Serial IED on IoT Gateway IP on port 25000.
SCADA Master reaches the Serial IED on IoT Gateway IP on port 25000.
Configuration Group Name: IR1101_SINGLE_CC_IP_and_RawSocket
Configuration Group Name: IR1101_SINGLE_CC_IP_and_ProtocolTranslation
IR1101 Platform: Dual Control Center Profiles
ICT Enablement for Serial and/or IP-based IED using IR1101
The following scenarios were validated using this profile:
■![]() IP-based IED is configured with 192.168.0.2.
IP-based IED is configured with 192.168.0.2.
■![]() Default gateway for IED is 192.168.0.1, which is the IP address of IR1101.
Default gateway for IED is 192.168.0.1, which is the IP address of IR1101.
■![]() IED is connected to FastEthernet0/0/1, and listening on port 2404.
IED is connected to FastEthernet0/0/1, and listening on port 2404.
■![]() SCADA Master1 IP address is 172.16.107.11.
SCADA Master1 IP address is 172.16.107.11.
■![]() SCADA Master2 IP address is 172.17.107.11.
SCADA Master2 IP address is 172.17.107.11.
■![]() Configuration of the serial interface validated is 9600-8N1.
Configuration of the serial interface validated is 9600-8N1.
■![]() Serial interface validated is Async0/2/0 (corresponds to line 0/2/0).
Serial interface validated is Async0/2/0 (corresponds to line 0/2/0).
■![]() SCADA Master reaches the IP IED on IoT Gateway IP on port 2404.
SCADA Master reaches the IP IED on IoT Gateway IP on port 2404.
■![]() SCADA Master1 reaches the Serial IED on IoT Gateway IP on port 25000.
SCADA Master1 reaches the Serial IED on IoT Gateway IP on port 25000.
■![]() SCADA Master2 reaches the Serial IED on IoT Gateway IP on port 25001.
SCADA Master2 reaches the Serial IED on IoT Gateway IP on port 25001.
Configuration Group Name: IR1101_DUAL_CC_IP_and_RawSocket
Configuration Group Name: IR1101_DUAL_CC_IP_and_ProtocolTranslation
IR807 Platform: Single Control Center Profiles
ICT Enablement for IP-based IED using IR807
The following scenarios were validated using this profile:
■![]() IP-based IED is configured with 192.168.0.2.
IP-based IED is configured with 192.168.0.2.
■![]() Default gateway for IED is 192.168.0.1, which is the IP address of IR807.
Default gateway for IED is 192.168.0.1, which is the IP address of IR807.
■![]() IED is connected to FastEthernet1 and listening on port 2404.
IED is connected to FastEthernet1 and listening on port 2404.
■![]() SCADA Master IP address is 172.16.107.11.
SCADA Master IP address is 172.16.107.11.
■![]() SCADA Master reaches the IP IED on IoT Gateway IP on port 2404.
SCADA Master reaches the IP IED on IoT Gateway IP on port 2404.
Configuration Group Name: IR807_SINGLE_CC_IP_Only
ICT Enablement for Serial and/or IP-based IED using IR807
The following scenarios were validated using this profile:
■![]() IP-based IED is configured with 192.168.0.2.
IP-based IED is configured with 192.168.0.2.
■![]() Default gateway for IED is 192.168.0.1, which is the IP address of IR807.
Default gateway for IED is 192.168.0.1, which is the IP address of IR807.
■![]() IED is connected to FastEthernet1, and listening on port 2404.
IED is connected to FastEthernet1, and listening on port 2404.
■![]() SCADA Master IP address is 172.16.107.11.
SCADA Master IP address is 172.16.107.11.
■![]() Configuration of the serial interface validated is 9600-8N1.
Configuration of the serial interface validated is 9600-8N1.
■![]() Serial interface validated is Async1 (corresponding to line 4).
Serial interface validated is Async1 (corresponding to line 4).
■![]() SCADA Master reaches the IP IED on IoT Gateway IP on port 2404.
SCADA Master reaches the IP IED on IoT Gateway IP on port 2404.
■![]() SCADA Master reaches the Serial IED on IoT Gateway IP on port 25000.
SCADA Master reaches the Serial IED on IoT Gateway IP on port 25000.
Configuration Group Name: IR807_SINGLE_CC_IP_and_RawSocket
Configuration Group Name: IR807_SINGLE_CC_IP_and_ProtocolTranslation
IR807 Platform: Dual Control Center Profiles
The following scenarios were validated using this profile:
■![]() IP-based IED is configured with 192.168.0.2
IP-based IED is configured with 192.168.0.2
■![]() Default gateway for IED is 192.168.0.1, which is the IP address of IR807.
Default gateway for IED is 192.168.0.1, which is the IP address of IR807.
■![]() IED is connected to FastEthernet1, and listening on port 2404.
IED is connected to FastEthernet1, and listening on port 2404.
■![]() SCADA Master1 IP address is 172.16.107.11.
SCADA Master1 IP address is 172.16.107.11.
■![]() SCADA Master2 IP address is 172.17.107.11.
SCADA Master2 IP address is 172.17.107.11.
■![]() Configuration of the serial interface validated is 9600-8N1.
Configuration of the serial interface validated is 9600-8N1.
■![]() Serial interface validated is Async1 (corresponding to line 4).
Serial interface validated is Async1 (corresponding to line 4).
■![]() SCADA Master reaches the IP IED on IoT Gateway IP on port 2404.
SCADA Master reaches the IP IED on IoT Gateway IP on port 2404.
■![]() SCADA Master1 reaches the Serial IED on IoT Gateway IP on port 25000.
SCADA Master1 reaches the Serial IED on IoT Gateway IP on port 25000.
■![]() SCADA Master2 reaches the Serial IED on IoT Gateway IP on port 25001.
SCADA Master2 reaches the Serial IED on IoT Gateway IP on port 25001.
 Feedback