Congestion Avoidance

Congestion Avoidance

Table 1. Feature History Table

Feature Name

Release Information

Feature Description

Queueing for Congestion Avoidance

Release 24.3.1

Introduced in this release on: Modular Systems (8800 [LC ASIC: P100]) (select variants only*), Fixed Systems (8200) (select variants only*), Fixed Systems (8700 (P100, K100)) (select variants only*)

You can shape traffic to control the traffic flow from queues and also configure queues to ensure certain traffic classes get a guaranteed amount of bandwidth.

*This feature is supported on:

  • 88-LC1-12TH24EH-E

  • 88-LC1-52Y8H-EM

  • 8212-48FH-M

  • 8711-32FH-M

Queueing for Congestion Avoidance

Release 24.2.1

Introduced in this release on: Modular Systems (8800 [LC ASIC: P100])(select variants only*)

By placing packets in different queues based on priority, queueing helps prevent traffic congestion and ensures that high-priority traffic is transmitted with minimal delay. You can shape traffic to control the traffic flow from queues and also configure queues to ensure certain traffic classes get a guaranteed amount of bandwidth. Queueing provides buffers to temporarily store packets during bursts of traffic and also supports strategies that enable dropping lower-priority packets when congestion builds up.

*This feature is supported on 88-LC1-36EH.

Queuing provides a way to temporarily store data when the received rate of data is larger than what can be sent. Managing the queues and buffers is the primary goal of congestion avoidance. As a queue starts to fill up with data, it is important to try to make sure that the available memory in the ASIC/NPU does not fill up completely. If this happens, subsequent packets coming into the port are dropped, irrespective of the priority that they received. This could have a detrimental effect on the performance of critical applications. For this reason, congestion avoidance techniques are used to reduce the risk of a queue from filling up the memory completely and starving non-congested queues for memory. Queue thresholds are used to trigger a drop when certain levels of occupancy are exceeded.

Scheduling is the QoS mechanism that is used to empty the queues of data and send the data onward to its destination.

Shaping is the act of buffering traffic within a port or queue until it is able to be scheduled. Shaping smoothens traffic, making traffic flows much more predictable. It helps ensure that each transmit queue is limited to a maximum rate of traffic.

Queuing Modes

Two network queuing modes are supported for network interface queuing: the default mode of 8xVOQ (virtual output queuing) and 4xVOQ. To change the mode from one to another, configure the hw-module profile qos voq-mode command and reload all line cards in the system.

In the 8xVOQ mode, eight VoQs and their associated resources are allocated for each interface. These queues are allocated regardless of the exact policy configuration on that interface. This mode supports a separate VOQ for each of the eight internal traffic classes.

In the 4xVOQ mode, four VoQs and their associated resources are allocated to each interface, and these queues are allocated regardless of the exact policy applied. In this mode the system supports twice the number of logical interfaces, but the eight traffic classes must be mapped down by configuration to four VoQs, not eight VoQs.


Note


From Cisco IOS XR Release 7.2.12 onwards, all the queuing features that are supported on Layer 3 interfaces are also supported on Layer 2 interfaces. However, these features apply only to the main interface (physical and bundle interfaces), and not on the sub-interfaces.


Main Interface Queuing Policy

The main interface default queues are created as part of the main interface creation.

When you apply a queuing policy to the main interface, it will override the default queuing and scheduling parameters for the traffic classes you have configured.

In the 8xVOQ mode, a P1+P2+6PN hierarchy is used for the main interface queues (default queuing and scheduling). The default queues are used for all traffic to the main interface and traffic to any sub-interface without a queuing policy applied. The control/protocol traffic uses traffic class 7 (TC7), priority 1 (P1) to avoid drops during congestion.

Subinterface Queueing Policy

Table 2. Feature History Table

Feature Name

Release Information

Feature Description

Subinterface Queueing Policy

Release 24.3.1

Introduced in this release on: Modular Systems (8800 [LC ASIC: P100]) (select variants only*), Fixed Systems (8200) (select variants only*), Fixed Systems (8700 (P100, K100)) (select variants only*)

You can manage traffic flows with fine granularity by configuring QoS policies at the subinterface level.

*This feature is supported on:

  • 88-LC1-12TH24EH-E

  • 88-LC1-52Y8H-EM

  • 8212-48FH-M

  • 8711-32FH-M

Subinterface Queueing Policy

Release 24.2.1

Introduced in this release on: Modular Systems (8800 [LC ASIC: P100])(select variants only*)

To manage traffic flows with fine granularity, you can configure QoS policies at the subinterface level. Also, with QoS support on mixed Layer 2 and Layer 3 subinterfaces under the same main interface, you can ensure that multiple traffic types with varying QoS requirements coexist on a single main physical interface.

*This feature is supported on 88-LC1-36EH.

Each subinterface supports up to three policies: an ingress policy, an egress marking policy, and an egress queuing policy. To create and configure a separate set of VoQs for a subinterface, apply a queuing policy on that subinterface. When you remove the subinterface queuing policy, the associated VoQs are freed and the subinterface traffic reverts to using the main interface VoQs.

Congestion Avoidance in VOQ

Table 3. Feature History Table

Feature Name

Release Information

Feature Description

View VOQs Evicted to HBM

Release 24.2.11

The newly introduced command displays the virtual output queues (VOQs) that are evicted to the High Bandwidth Memory (HBM) and the VOQs’ HBM buffer usage details. You can use this information whilst monitoring and debugging congestion scenarios.

This feature introduces the show controllers npu voq in-extended-memory instance command.

This feature modifies the Cisco-IOS-XR-8000-platforms-npu-evict-voq-buff-oper.yang (see GitHub, YANG Data Models Navigator) data model.

Congestion avoidance within a VOQ block is done by applying a congestion management profile to a VOQ. This profile defines the admission criteria and checks performed at the enqueue time. Under normal traffic conditions the packet is enqueued into the Shared Memory System (SMS) buffers. (The shared memory system is the primary packet storage area.) If the SMS VOQ is congested beyond a set threshold, the VOQ is moved to the external High Band Memory (HBM) block. When the HBM queue drains, it is returned to the on-chip SMS. The queue size in HBM is adaptive and decreases when the total HBM usage is high.


Note


Random Early Detect (RED) is available only for VOQs in HBM. The hardware does not support Weighted Random Early Detect (WRED).


View VOQs Evicted to HBM

Important Caveat

Do not use the show controllers npu voq in-extended-memory instance command in an automation script.

Guidelines and Limitations to View VOQs Evicted to HBM

  • If the PFC buffer-extended mode is enabled on a device, the associated VOQs are evicted to the HBM on priority. The remaining VOQs are retained in the Shared Memory Switch (SMS).
  • If PFC buffer-internal mode is enabled on a device, the associated VOQs are retained in the SMS. The remaining VOQs are evicted to the HBM.
  • If PFC isn’t enabled on a device, VOQs are evicted to the HBM based on the VOQs’ age and buffer usage.
  • With this feature, you can view up to 4000 records for these interfaces:
    • 400G and 100G (PFC buffer-internal and PFC buffer-extended modes)
    • 40G (PFC buffer-internal mode)

Verification

Output pointers:

  • Egress Interface–The egress interface of the virtual output queue.
  • VOQ_Base–Base VOQ ID
  • TC–Traffic Class number
  • Slice–Source slice number
  • Buff_Usage and In_Bytes–Buffer usage in blocks and in bytes

Example 1: The following output displays VOQs that are evicted to the HBM for node 0/6/cpu0 and all instances. In this case, VOQs from device instance Device 1 are evicted to the HBM.

Router# show controllers npu voq in-extended-memory instance all location 0/6/CPU0 
        
* Use this CLI with caution.
* This should not be integrated with any automation scripts.
       
Total Entries  0  | Slot 6   | Device  0  | Percent in Evict Voq Buff(s) 0.000000             
---------------------------------------------------------------------------------
Egress Interface  | VOQ_Base  | TC  | Slice  |  Buff_Usage |  In_Bytes     |

Total Entries  2  | Slot 6   | Device  1  | Percent in Evict Voq Buff(s) 0.004883             
---------------------------------------------------------------------------------
Egress Interface  | VOQ_Base  | TC  | Slice  |  Buff_Usage  |  In_Bytes  |
---------------------------------------------------------------------------------
    FH0/6/0/0           28672       2     0         14722          87837459 
    FH0/6/0/3           28728       2     0         1049           6335369 

Total Entries  0  | Slot 6   | Device  2  | Percent in Evict Voq Buff(s) 0.000000             
---------------------------------------------------------------------------------
   Egress Interface  | VOQ_Base  | TC  | Slice  |  Buff_Usage  |  In_Bytes  |        

Example 2: The following output displays VOQs that are evicted to the HBM for node 0/6/cpu0 and all instances. In this case, the virtual output queue from device instance Device 0 is evicted to the HBM. 

Router# show controllers npu voq in-extended-memory instance all location 0/6/CPU0  
        
* Use this CLI with caution.
* This should not be integrated with any automation scripts.
       
Total Entries  1  | Slot 6   | Device  0  | Percent in Evict Voq Buff(s) 0.002441             
---------------------------------------------------------------------------------
Egress Interface  | VOQ_Base  | TC  | Slice  |  Buff_Usage |  In_Bytes     |
---------------------------------------------------------------------------------
    FH0/6/0/22          28776       6     1         7140          46969050

Total Entries  0  | Slot 6   | Device  1  | Percent in Evict Voq Buff(s) 0.000000             
---------------------------------------------------------------------------------
Egress Interface  | VOQ_Base  | TC  | Slice  |  Buff_Usage  |  In_Bytes  |

Total Entries  0  | Slot 6   | Device  2  | Percent in Evict Voq Buff(s) 0.000000             
---------------------------------------------------------------------------------
   Egress Interface  | VOQ_Base  | TC  | Slice  |  Buff_Usage  |  In_Bytes  | 

Sharing of VOQ Statistics Counters

Every network processor on the router has multiple slices (or pipelines), and every slice has a set of VOQs associated with every interface on the router. To maintain counters at high packet rates, two sets of counters are associated with each interface on each network slice. As an example, consider a device with six slices (12 interfaces), each with 24,000 VOQs, where you want both transmitted and dropped events counted. In this scenario, you would require 12 x 24, 000 x 2 = 5, 76,000 counters, which alone exceeds the counter capacity of the device.

It is to mitigate such a scenario that the router supports configurable sharing of VOQ counters. You can configure the sharing such that a counter is shared by {1,2,4,8} VOQs.

Each set of VoQs sharing counters has two counters that measure:

  • Enqueued packets count in packets and bytes units.

  • Dropped packets count in packets and bytes units.

For the feature to take effect:

  • Delete egress queuing policy-map configuration from all interfaces.

  • Run the command # reload location all to reload all the nodes on your router.

Configuring Sharing of VOQ Statistics Counters

To configure VOQs sharing counters, use the #hw-module profile stats voqs-sharing-counters and specify the number of VOQ counters for each queue.

RP/0/RP0/CPU0:ios(config)#hw-module profile stats ?
  voqs-sharing-counters  Configure number of voqs (1, 2, 4) sharing counters
RP/0/RP0/CPU0:ios(config)#hw-module profile stats voqs-sharing-counters ?
  1  Counter for each queue
  2  2 Queues share counters
  4  4 Queues share counters
RP/0/RP0/CPU0:ios(config)#hw-module profile stats voqs-sharing-counters 1
RP/0/RP0/CPU0:ios(config)#hw-module profile stats voqs-sharing-counters 2
RP/0/RP0/CPU0:ios(config)#commit
RP/0/RP0/CPU0:ios#reload location all
Running Configuration
RP/0/RP0/CPU0:ios#show run | in hw-mod
Mon Feb 10 13:57:35.296 UTC
Building configuration...
hw-module profile stats voqs-sharing-counters 2
RP/0/RP0/CPU0:ios#
Verification
RP/0/RP0/CPU0:ios#show controllers npu stats voq ingress interface hundredGigE 0/0/0/16 instance all location 0/RP0/CPU0 
Mon Feb 10 13:58:26.661 UTC

Interface Name    =   Hu0/0/0/16
Interface Handle  =      f0001b0
Location          =   0/RP0/CPU0
Asic Instance     =            0
VOQ Base          =        10288
Port Speed(kbps)  =    100000000
Local Port        =        local
VOQ Mode          =            8
Shared Counter Mode =          2
       ReceivedPkts    ReceivedBytes   DroppedPkts     DroppedBytes
-------------------------------------------------------------------
TC_{0,1} = 114023724       39908275541     113945980       39881093000     
TC_{2,3} = 194969733       68239406550     196612981       68814543350     
TC_{4,5} = 139949276       69388697075     139811376       67907466750     
TC_{6,7} = 194988538       68242491778     196612926       68814524100     

Dual Queue Limit

The dual queue limit option is added to queue-limit command on the CLI of your router and displays as discard-class. What the discard-class option does is give you the flexibility to configure two queue limits on a single policy map—one for high-priority traffic and the other for low-priority traffic. This option ensures that the high priority traffic flow continues unaffected (up to the derived threshold from the discard-class 0 queue-limit) while the low-priority traffic continues up to the lower threshold (per discard-class 1 queue-limit).

Tell Me More

You can configure the two queue limits per these details:

  • One for flow that you mark as discard-class 0 (higher priority) on ingress via ingress-policy.

  • second, for flow that you mark as discard-class 1 (lower priority) on ingress via ingress policy.

The discard-class 1 flow (for low-priority traffic) begins to drop when the queue length hits the size limit that you configured for discard-class 1. Conversely, the flow for discard-class 1 stops dropping when queue-length falls below its configured value.

As an example, consider this configuration:

policy-map egress_pol_dql
class tc7
  queue-limit discard-class 0 100 mbytes
  queue-limit discard-class 1 50 mbytes
  priority level 1
 !
 class class-default
  bandwidth remaining ratio 1
!
end-policy-map
!
Also consider the verification:
RP/0/RP0/CPU0:ios#
RP/0/RP0/CPU0:ios#show qos interface hundredGigE 0/0/0/30 output
NOTE:- Configured values are displayed within parentheses
Interface HundredGigE0/0/0/30 ifh 0xf000210  -- output policy
NPU Id:                        0
Total number of classes:       2
Interface Bandwidth:           100000000 kbps
Policy Name:                   egress_pol_dql
VOQ Base:                      464
Accounting Type:               Layer1 (Include Layer 1 encapsulation and above)
VOQ Mode:                      8
Shared Counter Mode:           1
------------------------------------------------------------------------------
Level1 Class (HP1)                       =   tc7
Egressq Queue ID                         =   471 (HP1 queue)
Queue Max. BW.                           =   no max (default)
Discard Class 1 Threshold                =   25165824 bytes / 2 ms (50 mbytes)
Discard Class 0 Threshold                =   75497472 bytes / 5 ms (100 mbytes)
WRED not configured for this class
 
Level1 Class                             =   class-default
Egressq Queue ID                         =   464 (Default LP queue)
Queue Max. BW.                           =   no max (default)
Inverse Weight / Weight                  =   1 / (1)
TailDrop Threshold                       =   749568 bytes / 6 ms (default)
WRED not configured for this class

In the preceding example, there are two traffic flows that are marked as discard-class 0 (higher priority) and discard-class 1 (lower priority).

As long as the queue length of the two flows remains below 25165824 bytes (the threshold for discard-class 1), packets from both flows continue without any drops. When the queue length reaches 25165824 bytes, discard-class 1 packets are not enqueued, ensuring all remaining bandwidth is used for the higher priority flow (discard-class 0).

The higher priority flow drops only when the queue length reaches 75497472 bytes.


Note


  • This option protects the high-priority traffic from loss due to congestion, but not necessarily from latency due to congestion.

  • These thresholds are derived from hardware-specific queue regions.


Restrictions

Ensure that you read these restrictions about the dual queue limit option.

  • Both the queue-limits must use the same unit of measurement.

  • The queue limit for discard-class 0 must always be greater than that for discard-class 1.

  • When the discard-class option is not used to configure the queue-limit, packets marked with discard-class 0 and discard-class 1 have the same queue-limit; in other words, they receive identical treatment.

  • A queue-limit that is configured with only discard-class 0 or discard-class 1 is rejected.

Virtual Output Queue Watchdog

Table 4. Feature History Table

Feature Name

Release Information

Feature Description

Virtual Output Queue Watchdog

Release 24.2.11

We ensure the continuous movement of traffic queues, which is crucial for enforcing QoS policies, even when hardware issues disrupt the Virtual Output Queue (VOQ) and impede the flow of traffic. With this feature, if the router detects a stuck queue on a line card, it shuts down the line card, and if it detects a stuck queue on a fabric card, the router triggers a hard reset on the NPU. A queue is considered stuck only when there is no transmission for one minute.

The feature is disabled by default and can be enabled using the command hw-module voq-watchdog feature enable .

The feature is supported only on Cisco 8000 Series Routers (Modular) with Cisco Silicon One Q100 or Q200 ASICs.

The feature introduces these changes:

CLI:

Virtual Output Queue (VOQ) is a mechanism to manage a situation where a packet at the front of the queue is unable to move forward due to a busy destination, causing a delay for all packets behind it, even those with available output ports. VOQ prevents packet delay or loss by providing each output port with a dedicated queue for every input port. This mechanism ensures that packets are transmitted in the correct order and maintains quality of service (QoS) by managing congestion.

A VOQ can become stuck when it fails to transmit traffic for a certain period despite the non-empty queue. There are a few scenarios in which this can happen. For example, when a port or traffic class (Output Queue, OQ) is PFC-paused (Priority Flow Control) by the peer, all the VOQs sending traffic to this OQ are also paused. Another scenario is when a port's higher priority traffic class (TC) consumes all the port bandwidth, causing lower priority TCs to run out of credits and their corresponding VOQs to become stuck. This can cause VOQs to stop functioning, potentially leading to traffic loss.

VOQ watchdog actively identifies and resolves issues in VOQs that have not sent packets for one minute. It detects stuck VOQs in both line cards (LCs) and fabric cards (FCs). The feature is disabled by default and can be enabled using the command hw-module voq-watchdog feature enable .

VOQ Watchdog Behavior on Line Cards

By default, the VOQ watchdog feature is disabled on the line cards; as a result, stuck VOQs are not detected, and there are no interrupts or syslog notifications.

However, after you enable this feature using the hw-module voq-watchdog feature enable command, the router regularly checks the line cards for packets stuck in VOQs. If the router detects any such packets, it will raise a notification and shut down the line card.

The router displays the following messages when it detects a stuck VOQ.

Syslog Notification - Stuck VOQ; Action: Line card Shutdown


LC/0/0/CPU0:Feb 22 09:16:56.090 UTC: npu_drvr[203]: %FABRIC-NPU_DRVR-3-VOQ_HARDWARE_WATCHDOG : 
[7127] : npu[1]: hardware_watchdog.voq_error: VOQ slc:2 voqnum:19955 isinhbm:1 smscntxtnum:3 hbmcntxtnum:14 
isstuck:1 nochangesec:64 rdptr:1728 wrptr:1735 avblcrdts:-16668 is_fabric:0

Stuck VOQ; Action: Line card Shutdown


LC/0/0/CPU0:Jan 30 15:10:57.299 UTC: npu_drvr[241]: %PKT_INFRA-FM-2-FAULT_CRITICAL : 
ALARM_CRITICAL :VOQ WATCHDOG Alarm :DECLARE :: Shutdown card due to voq watchdog error on ASIC 1.

Line cards automatically shut down if stuck VOQs are detected, making it impossible to identify the root cause of the problem. However, you can prevent the line cards from shutting down by using the hw-module voq-watchdog cardshut disable command to disable the shutdown function. This way, the router will send syslog notifications when it detects stuck VOQs without shutting down the line card.

After disabling the shutdown action on the line card, the router displays the following messages when it detects a stuck VOQ.

Syslog Notification - Stuck VOQ; Action: None

LC/0/0/CPU0:Feb 22 09:16:56.090 UTC: npu_drvr[203]: %FABRIC-NPU_DRVR-3-VOQ_HARDWARE_WATCHDOG : 
[7127] : npu[1]: hardware_watchdog.voq_error: VOQ slc:2 voqnum:19955 isinhbm:1 smscntxtnum:3 hbmcntxtnum:14 
isstuck:1 nochangesec:64 rdptr:1728 wrptr:1735 avblcrdts:-16668 is_fabric:0 

Stuck VOQ; Action: None

LC/0/0/CPU0:Feb 22 09:16:56.090 UTC: npu_drvr[203]: %FABRIC-NPU_DRVR-3-VOQ_HARDWARE_WATCHDOG : 
[7127] : npu[1]: hardware_watchdog.voq_error: VOQ Watchdog Action Handling Skipped Due to User Configuration

VOQ Watchdog Behavior on Fabric Cards

By default, the VOQ watchdog feature is disabled on the fabric cards; as a result, stuck VOQs are not detected, and there are no interrupts or syslog notifications.

After you enable the feature using the hw-module voq-watchdog feature enable command, the router regularly checks the fabric cards for any packets stuck in VOQs. If such packets are detected, the router raises a syslog notification and hard resets the fabric element (FE) device. After five hard resets, the fabric card undergoes a graceful reload.

The router logs the following syslog notification upon detecting a stuck VOQ on an FC.

Syslog: RP/0/RP0/CPU0:Feb 22 09:16:47.721 UTC: npu_drvr[335]: %FABRIC-NPU_DRVR-3-ASIC_ERROR_ACTION : 
[7912] : npu[6]: HARD_RESET needed for hardware_watchdog.voq_error

Guidelines and Restrictions for Virtual Output Queue Watchdog

  • You can enable or disable the feature on both line and fabric cards. But, you can't enable or disable the feature on just one card, either line or fabric card.

  • Disabling the shutdown action for line cards has no effect on fabric cards.

  • You can’t disable the shutdown action on fabric cards (FCs).

  • The feature is supported only in Cisco 8000 Series Routers with Cisco Silicon One Q200 ASICs.

Configure Virtual Output Queue Watchdog

This section describes how to configure VOQ Watchdog.

Configuration Example

To enable the feature on your router:

Router# config
Router(config)# hw-module voq-watchdog feature enable
Router(config)# commit

To disable the shutdown action on the line cards:

Router# config
Router(config)# hw-module voq-watchdog cardshut disable
Router(config)# commit

Running Configuration

Router# show running-config
…
hw-module voq-watchdog feature enable
hw-module voq-watchdog cardshut disable
end

Verification

After the feature is enabled, the following syslog message is logged on detecting a stuck VOQ on the line card:

LC/0/0/CPU0:Feb 22 09:16:56.090 UTC: npu_drvr[203]:
%FABRIC-NPU_DRVR-3-VOQ_HARDWARE_WATCHDOG : [7127] : npu[1]: hardware_watchdog.voq_error: VOQ slc:2 voqnum:19955 isinhbm:1 smscntxtnum:3 hbmcntxtnum:14 isstuck:1 nochangesec:64 rdptr:1728 wrptr:1735 avblcrdts:-16668 is_fabric:0

On disabling the shutdown action of line cards, the following syslog message is logged on detecting a stuck VOQ on a line card:

LC/0/0/CPU0:Feb 22 09:16:56.090 UTC: npu_drvr[203]:
%FABRIC-NPU_DRVR-3-VOQ_HARDWARE_WATCHDOG : [7127] : npu[1]:
hardware_watchdog.voq_error: VOQ Watchdog Action Handling Skipped Due to User Configuration

After the feature is enabled, the following syslog message is logged on detecting a stuck VOQ on the fabric card:

Syslog: RP/0/RP0/CPU0:Feb 22 09:16:47.721 UTC: npu_drvr[335]: %FABRIC-NPU_DRVR-3-ASIC_ERROR_ACTION : 
[7912] : npu[6]: HARD_RESET needed for hardware_watchdog.voq_error

Equitable Traffic Flow Using Fair VOQ

Table 5. Feature History Table

Feature Name

Release Information

Feature Description

Equitable Traffic Flow Using Fair VOQ

Release 7.3.3

Configuring this feature ensures that ingress traffic from various source ports on every network slice of an NPU is assigned a unique virtual output queue (VOQ) for every source port and destination port pair. This action ensures that the bandwidth available at the destination port for a given traffic class is distributed equally to all source ports requesting bandwidth.

In earlier releases, the traffic wasn’t distributed equitably because each slice wasn’t given its fair share of the output queue bandwidth.

This feature introduces the fair-4 and fair-8 keywords in the hw-module profile qos voq-mode command.

Equitable Traffic Flow Using Fair VOQ on Cisco 8201-32FH Routers

Release 7.5.2

You can now ensure that the bandwidth available at the destination port for a given traffic class is distributed equally to all source ports requesting bandwidth on Cisco 8201-32FH routers.

Fair VOQ: Why

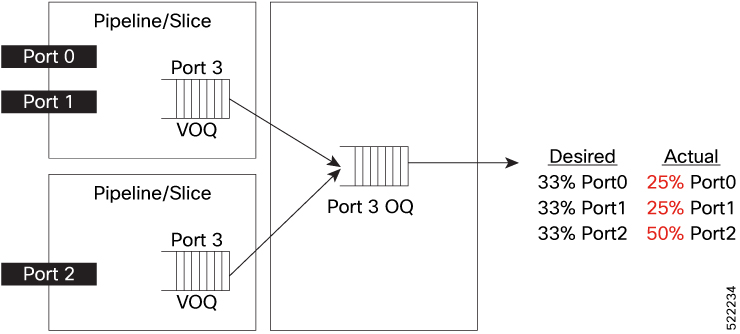
Per default behavior, every network slice of an NPU is assigned a set of 4 or 8 Virtual Output Queues (VOQ) per destination port. With such an assignment, it’s challenging to ensure that the right amount of buffering is available via VOQs. With this configuration, the ingress traffic from various source ports on a slice (or pipeline) on an NPU destined to a destination port is assigned to a VOQ per slice. In other words, multiple source ports sending traffic to the same destination port use the same VOQ. However, when sending traffic to different destination ports, traffic is enqueued to different VOQs. This means that the traffic isn’t distributed equitably because each slice doesn’t get its fair share of the output queue bandwidth. In a scenario where one slice has two ports and another slice has only one port, the bandwidth drops for the ports sharing a slice, even though the two ports handle more traffic than the single port.

Consider the following example where two 100G ports—port-0 and port-1—that belong to the same slice (slice-0) are sending traffic to port-3 on the output queue (OQ). You have a 100G port on another slice (slice-1) on the same NPU that is also scheduled to send traffic to port-3. The ingress VOQ is shared between the two ports in slice-0, whereas the ingress VOQ in slice-1 is available exclusively for port-3. This arrangement results in port-0 and port-1 getting 25% of the buffer traffic, while port-3 receives 50% of the buffer traffic.

Figure 1. Existing behavior : Source ports on slice share one VOQ per destination port

The fair VOQ feature solves this disparity in traffic distribution.

Fair VOQ: How

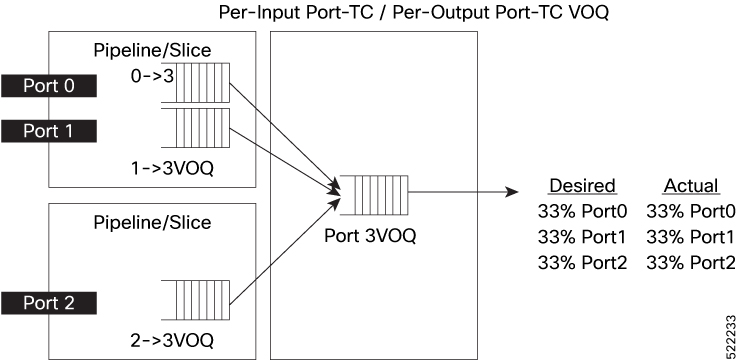
The fair VOQ feature tackles the default behavior that treats source ports on each NPU slice equally, regardless of the number of active source ports. It does so by redesigning the way bandwidth is allocated from the output queue. Rather than distributing bandwidth at a slice level, fair VOQ distributes bandwidth directly to the source ports. When you configure the command hw-module profile qos voq-mode and reload your router, the functionality creates a dedicated VOQ for every source port and destination port pair. This arrangement ensures that bandwidth available at the destination port for a given traffic class is distributed equally to all source ports requesting bandwidth.

Extending the preceding example to understand the fair VOQ functionality, there are now dedicated VOQs for each ingress port that connect to the port on the output queue. Thus, port-0 and port-1 now don’t share a VOQ, and port-3 has its VOQ as before, as shown in the following figure. This fair VOQ arrangement results in traffic queued on dedicated queues, thus improving the traffic performance.

Figure 2. Fair VOQ behavior: each source port on slice has one dedicated VOQ per destination port

Fair VOQ Modes and Sharing of Counters

You can configure fair VOQ for 8xVOQ mode (fair-8) and 4xVOQ mode (fair-4) using the following options in the hw-module profile qos voq-mode command:

  • hw-module profile qos voq-mode fair-8

  • hw-module profile qos voq-mode fair-4

You can also share VOQ statistics counters in both fair VOQ modes, as shown in the following table. (For details on why sharing counters is essential and how to configure counters sharing, see Sharing of VOQ Statistics Counters.)

Table 6. Fair VOQ Modes and Sharing Counters

Fair VOQ Mode

Sharing Counters Mode

Important Notes

fair-8

2, 4

  • Eight VOQs configured per source port and destination pair

  • Counters are shared by {2, 4} VOQs.

  • fair-8 mode doesn't support dedicated counter mode (counter mode1, where there's a counter for every queue)

fair-4

1, 2, 4

  • Four VOQs configured per source port and destination pair

  • Counters are shared by {1, 2, 4} VOQs.

Fair VOQs and Slice (or Normal) VOQs: Key Differences

The following table is a snapshot to outline the key differences between fair VOQs and slice or regular VOQs.

Table 7. Fair VOQs and Normal VOQs

Fair VOQ

Normal VOQ

fair-8 mode: eight VOQs configured per source port and destination pair

8 :
  • Eight VOQs per destination port per slice

  • These VOQs are shared by all source ports within an NPU slice.

fair-4 mode: four VOQs configured per source port and destination pair

4 :
  • Four VOQs per destination port per slice

  • These VOQs are shared by all source ports within an NPU slice.

Guidelines and Limitations

  • The fair VOQ feature is supported on the Cisco 8202 router (12 QSFP56-DD 400G and 60 QSFP28 100G ports) and Cisco 8201-32FH router (32 QSFP-DD 400G ports).

  • The following table details the maximum interfaces (with basic IPv4 configurations and no other scale configuration such as QoS policy, ACL, and subinterface configuration) allowed based on VOQ mode and sharing counter mode.

    Table 8. Maximum Interfaces Based on Fair VOQ Mode and Sharing Counter Mode

    VOQ Mode

    Sharing Counter Mode

    Maximum Interfaces for Cisco 8202

    Maximum Interfaces for Cisco 8201-32FH

    fair-8

    1

    The router doesn't support this combination.

    The router doesn't support this combination.

    fair-8

    2

    96 = 60 (100G) + 8x4 + 4 (400G) ==> you can configure only eight 400G interfaces in 4x10G or 4x25G breakout mode.

    128 = 32x4 (4x10G or 4x25G - breakout on all 32 ports - 400G)

    fair-8

    4

    108 = 60 + 12 x 4 (breakout on all 12 ports - 400G)

    fair-4

    1

    96 = 60(100G) + 8x4 + 4 (400G) ==> you can configure only eight 400 G interfaces in 4x10G or 4x25G breakout mode.

    fair-4

    2

    108 = 60 + 12 x4 (breakout on all 12 ports - 400G)

    fair-4

    4

    108 = 60 + 12 x4 (breakout on all 12 ports - 400G)


    Note


    We recommend using sharing counter mode 4 in breakout modes and sharing counter mode 2 for nonbreakout modes.

    If the counter usage of applications is high, sharing counter mode 2 is not supported.


    Note


    Breakout mode isn’t supported on 100G interfaces.


  • Ensure that you reload the router for the configuration to take effect.

  • Layer 2 traffic isn’t supported in fair-voq mode (fair-4 and fair-8 ).

  • Subinterface queueing isn’t supported. (This applies to bundle sub-interfaces as well). This means that you can’t attach egress service-policies that require dedicated VOQs. However, egress marking is supported for subinterfaces.

  • ERSPAN mirroring traffic is not supported in fair-voq mode.

  • hw-module profile stats voqs-sharing-counters 1 isn’t supported in fair-8 mode. Ensure that you configure hw-module profile voq sharing-counters 2 or hw-module profile voq sharing-counters 4 along with hw-module profile qos voq-mode fair-4 or hw-module profile qos voq-mode fair-8 before reloading the router.

  • Breakout is supported only on 400G interfaces in fair-voq mode (both fair-4 and fair-8 ) on the Cisco 8202 router.

  • src-interface and src-slice keywords in show controller npu stats are visible only when you configure the VOQ mode to either fair-8 or fair-4 .

Configure Fair VOQ

To configure fair VOQ:

  1. Configure sharing of VOQ statistics counters. This example configures 2 counters.


    Note


    Configuring fair-8 mode without counter sharing may cause configuration failure or other unexpected behavior.


  2. Configure fair VOQ mode. This example shows how to configure fair-8 mode.

  3. Restart the router for the configuration to take effect.

  4. You have successfully enabled the fair VOQ feature to ensure equitable traffic distribution between every source port and destination port pair.

/*Configure sharing of VOQ statistics counters; we're configuring 2 counters per queue*/
Router(config)#hw-module profile stats ?
  voqs-sharing-counters  Configure number of voqs (1, 2, 4) sharing counters
Router(config)#hw-module profile stats voqs-sharing-counters ?
  1  Counter for each queue
  2  2 Queues share counters
  4  4 Queues share counters
Router(config)#hw-module profile stats voqs-sharing-counters 2

/*Configure fair-voq mode; we're configuring fair-8 VOQ mode here*/
Router#config
Router(config)#hw-module profile qos voq-mode fair-8
Router(config)#commit
Router#reload location all

Running Configuration

hw-module profile stats voqs-sharing-counters 2
!
hw-module profile qos voq-mode fair-8
!

Verification

Run the show controller npu stats voq ingress interface <> instance <> location <> command to verify the fair VOQ configuration.

Router#show controllers npu stats voq ingress interface hundredGigE 0/0/0/20 instance 0 location 0/RP0/CPU0

 
Interface Name        =   Hu0/0/0/20
Interface Handle      =      f000118
Location              =   0/RP0/CPU0
Asic Instance         =            0
Port Speed(kbps)      =    100000000
Local Port            =        local
Src Interface Name    =          ALL
VOQ Mode              =       Fair-8
Shared Counter Mode   =            2
       ReceivedPkts    ReceivedBytes   DroppedPkts     DroppedBytes
-------------------------------------------------------------------
TC_{0,1} = 11110           1422080         0               0              
TC_{2,3} = 0               0               0               0              
TC_{4,5} = 0               0               0               0              
TC_{6,7} = 0               0               0               0              
RP/0/RP0/CPU0:ios#

Associated Commands

hw-module profile qos voq-mode

Modular QoS Congestion Avoidance

Congestion avoidance techniques monitor traffic flow in an effort to anticipate and avoid congestion at common network bottlenecks. Avoidance techniques are implemented before congestion occurs as compared with congestion management techniques that control congestion after it has occurred.

Congestion avoidance is achieved through packet dropping. The router supports these QoS congestion avoidance techniques:

Tail Drop and the FIFO Queue

Tail drop is a congestion avoidance technique that drops packets when an output queue is full until congestion is eliminated. Tail drop treats all traffic flow equally and does not differentiate between classes of service. It manages the packets placed into a first-in, first-out (FIFO) queue, and forwarded at a rate determined by the available underlying link bandwidth.

Configure Tail Drop

Packets satisfying the match criteria for a class accumulate in the queue reserved for the class until they are serviced. The queue-limit command is used to define the maximum threshold for a class. When the maximum threshold is reached, the enqueued packets to the class queue result in tail drop (packet drop).

Restrictions

  • When configuring the queue-limit command, you must configure one of the following commands: priority , shape average , or bandwidth remaining , except for the default class.

Configuration Example

You have to accomplish the following to complete the tail drop configuration:

  1. Creating (or modifying) a policy map that can be attached to one or more interfaces to specify a service policy

  2. Associating the traffic class with the traffic policy

  3. Specifying the maximum limit the queue can hold for a class policy configured in a policy map.

  4. Specifying priority to a class of traffic belonging to a policy map.

  5. (Optional) Specifying the bandwidth allocated for a class belonging to a policy map or specifying how to allocate leftover bandwidth to various classes.

  6. Attaching a policy map to an output interface to be used as the service policy for that interface.


Router# configure
Router(config)# policy-map test-qlimit-1
Router(config-pmap)# class qos-1
Router(config-pmap-c)# queue-limit 100 us
Router(config-pmap-c)# priority level 7
Router(config-pmap-c)# exit
Router(config-pmap)# exit

Router(config)# interface HundredGigE 0/6/0/18
Router(config-if)# service-policy output test-qlimit-1
Router(config-if)# commit

Running Configuration


policy-map test-qlimit-1
 class qos-1
  queue-limit 100 us
  priority level 7
 !
 class class-default
 !
 end-policy-map
!

Verification


Router# show qos int hundredGigE 0/6/0/18 output

NOTE:- Configured values are displayed within parentheses
Interface HundredGigE0/6/0/18 ifh 0x3000220  -- output policy
NPU Id:                        3
Total number of classes:       2
Interface Bandwidth:           100000000 kbps
VOQ Base:                      11176
VOQ Stats Handle:              0x88550ea0
Accounting Type:               Layer1 (Include Layer 1 encapsulation and above)
------------------------------------------------------------------------------
Level1 Class (HP7)                       =   qos-1
Egressq Queue ID                         =   11177 (HP7 queue)
TailDrop Threshold                       =   1253376 bytes / 100 us (100 us)
WRED not configured for this class

Level1 Class                             =   class-default
Egressq Queue ID                         =   11176 (Default LP queue)
Queue Max. BW.                           =   101803495 kbps (default)
Queue Min. BW.                           =   0 kbps (default)
Inverse Weight / Weight                  =   1 (BWR not configured)
TailDrop Threshold                       =   1253376 bytes / 10 ms (default)
WRED not configured for this class
 

Related Topics

Random Early Detection and TCP

The Random Early Detection (RED) congestion avoidance technique takes advantage of the congestion control mechanism of TCP. By randomly dropping packets prior to periods of high congestion, RED tells the packet source to decrease its transmission rate. Assuming the packet source is using TCP, it decreases its transmission rate until all packets reach their destination, indicating that the congestion is cleared. You can use RED as a way to cause TCP to slow transmission of packets. TCP not only pauses, but it also restarts quickly and adapts its transmission rate to the rate that the network can support.

RED distributes losses in time and maintains normally low queue depth while absorbing traffic bursts. It achieves this by taking action on the average queue size, and not the instantaneous queue size. When enabled on an interface, RED begins dropping packets when congestion occurs at a rate you select during configuration.

Configure Random Early Detection

The random-detect command with the minimum threshold and maximum threshold keywords must be used to enable random early detection (RED).

Guidelines

  • If you configure the random-detect <min threshold> <max threshold> command on any class including class-default, configure one of the following commands: shape average or bandwidth remaining .

  • If you configure a queue-limit that is lesser than the minimum supported value, the configured value automatically adjusts to the supported minimum value.

    While configuring random-detect , if you set the <min threshold> and <max-threshold> values lesser than the minimum supported threshold value:

    • The <min threshold> value automatically adjusts to the minimum supported value.

    • The <max-threshold> value doesn’t autoadjust to a value above the minimum supported threshold value. This results in a failed random-detect configuration. To prevent this error, configure the <max-threshold> value such that it exceeds the <min threshold> value that your system supports.

Configuration Example

Accomplish the following to complete the random early detection configuration:

  1. Creating (or modifying) a policy map that can be attached to one or more interfaces to specify a service policy

  2. Associating the traffic class with the traffic policy

  3. Enabling RED with minimum and maximum thresholds.

  4. Configure one of the following:

    • Specifying how to allocate leftover bandwidth to various classes. OR

    • Shaping traffic to the specified bit rate or a percentage of the available bandwidth.

  5. Attaching a policy map to an output interface to be used as the service policy for that interface.


Router# configure
Router(config)# policy-map red-abs-policy
Router(config-pmap)# class qos-1
Router(config-pmap-c)# random-detect <min threshold> <max threshold>
Router(config-pmap-c)# shape average percent 10
Router(config-pmap-c)# end-policy-map
Router(config)# commit
Router(config)# interface HundredGigE0/0/0/12
Router(config-if)# service-policy output red-abs-policy
Router(config-if)# commit

Running Configuration


policy-map red-abs-policy
class tc7
  priority level 1
  queue-limit 75 mbytes
 !
 class tc6
  priority level 2
  queue-limit 75 mbytes
 !
 class tc5
  shape average 10 gbps
  queue-limit 75 mbytes
 !
 class tc4
  shape average 10 gbps
  queue-limit 75 mbytes
 !
 class tc3
  shape average 10 gbps
  queue-limit 75 mbytes
 !
 class tc2
  shape average 10 gbps
  queue-limit 75 mbytes
 !
 class tc1
  shape average 10 gbps
  random-detect ecn
  random-detect 100 mbytes 200 mbytes
 !
 class class-default
  shape average 10 gbps
  random-detect 100 mbytes 200 mbytes
 !
 end-policy-map
!
 
interface HundredGigE0/0/0/12
service-policy output red-abs-policy
shutdown
!

Verification


Router# show qos int hundredGigE 0/6/0/18 output

NOTE:- Configured values are displayed within parentheses
Interface HundredGigE0/0/0/12 ifh 0x3000220  -- output policy
NPU Id:                        3
Total number of classes:       2
Interface Bandwidth:           100000000 kbps
VOQ Base:                      11176
VOQ Stats Handle:              0x88550ea0
Accounting Type:               Layer1 (Include Layer 1 encapsulation and above)
------------------------------------------------------------------------------
Level1 Class                             =   qos-1
Egressq Queue ID                         =   11177 (LP queue)
Queue Max. BW.                           =   10082461 kbps (10 %)
Queue Min. BW.                           =   0 kbps (default)
Inverse Weight / Weight                  =   1 (BWR not configured)
Guaranteed service rate                  =   10000000 kbps
TailDrop Threshold                       =   12517376 bytes / 10 ms (default)

Default RED profile
RED Min. Threshold                      =   12517376 bytes (10 ms)
RED Max. Threshold                      =   12517376 bytes (10 ms)

Level1 Class                             =   class-default
Egressq Queue ID                         =   11176 (Default LP queue)
Queue Max. BW.                           =   101803495 kbps (default)
Queue Min. BW.                           =   0 kbps (default)
Inverse Weight / Weight                  =   1 (BWR not configured)
Guaranteed service rate                  =   50000000 kbps
TailDrop Threshold                       =   62652416 bytes / 10 ms (default)
WRED not configured for this class

Related Topics

Explicit Congestion Notification

Random Early Detection (RED) is implemented at the core routers of a network. Edge routers assign IP precedences to packets, as the packets enter the network. With RED, core routers then use these precedences to determine how to treat different types of traffic. RED provides a single threshold and weights per traffic class or queue for different IP precedences.

ECN is an extension to RED. ECN marks packets instead of dropping them when the average queue length exceeds a specific threshold value. When configured, ECN helps routers and end hosts to understand that the network is congested and slow down sending packets. However, if the queue length is above the maximum threshold for the extended memory, packets are dropped. This is the identical treatment that a packet receives when RED is enabled without ECN configured on the router.

RFC 3168, The Addition of Explicit Congestion Notification (ECN) to IP, states that with the addition of active queue management (for example, RED) to the Internet infrastructure, routers are no longer limited to packet loss as an indication of congestion.


Note


You cannot use this feature when you have set qos-group or mpls experimental along with a traffic class in the ingress policy.

Implementing ECN

Implementing ECN requires an ECN-specific field that has two bits—the ECN-capable Transport (ECT) bit and the CE (Congestion Experienced) bit—in the IP header. The ECT bit and the CE bit can be used to make four code points of 00 to 11. The first number is the ECT bit and the second number is the CE bit.

Table 9. ECN Bit Setting

ECT Bit

CE Bit

Combination Indicates

0

0

Not-ECN-capable.

0

1

Endpoints of the transport protocol are ECN-capable.

1

0

Endpoints of the transport protocol are ECN-capable.

1

1

Congestion experienced.

The ECN field combination 00 indicates that a packet is not using ECN. The code points 01 and 10—Called ECT(1) and ECT(0), respectively—are set by the data sender to indicate that the endpoints of the transport protocol are ECN-capable. Routers treat these two code points identically. Data senders can use either one or both of these two combinations. The ECN field combination 11 indicates congestion to the endpoints. Packets arriving a full queue of a router will be dropped.

Packet Handling When ECN Is Enabled

When ECN is enabled, all packets between <min_threshold> and <max tail drop threshold> are marked with ECN. Three different scenarios arise if the queue length is between the minimum threshold and the maximum threshold:

  • If the ECN field on the packet indicates that the endpoints are ECN-capable (that is, the ECT bit is set to 1 and the CE bit is set to 0, or the ECT bit is set to 0 and the CE bit is set to 1)—and the RED algorithm determines that the packet should have been dropped based on the drop probability—the ECT and CE bits for the packet are changed to 1, and the packet is transmitted. This happens because ECN is enabled and the packet gets marked instead of dropped.

  • If the ECN field on the packet indicates that neither endpoint is ECN-capable (that is, the ECT bit is set to 0 and the CE bit is set to 0), the packet is transmitted. If, however, the max tail drop threshold is exceeded, the packet is dropped. This is the identical treatment that a packet receives when RED is enabled without ECN configured on the router.

  • If the ECN field on the packet indicates that the network is experiencing congestion (that is, both the ECT bit and the CE bit are set to 1), the packet is transmitted. No further marking is required.

Configuration Example

Router# configure
Router(config)# policy-map policy1
Router(config-pmap)# class class1
Router(config-pmap-c)# bandwidth percent 50 
Router(config-pmap-c)# random-detect 1000 packets 2000 packets
Router(config-pmap-c)# random-detect ecn 
Router(config-pmap-c)# exit
Router(config-pmap)# exit
Router(config)# commit

Verification

Use the show policy-map interface to verify the configuration.


Router# show policy-map int hu 0/0/0/35 output 
TenGigE0/0/0/6 output: pm-out-queue

HundredGigE0/0/0/35 output: egress_qosgrp_ecn
 
Class tc7
  Classification statistics          (packets/bytes)     (rate - kbps)
    Matched             :           195987503/200691203072         0
    Transmitted         :           188830570/193362503680         0
    Total Dropped       :             7156933/7328699392           0
  Queueing statistics
    Queue ID                             : 18183
    Taildropped(packets/bytes)           : 7156933/7328699392
 
    WRED profile for
    RED Transmitted (packets/bytes)            : N/A
    RED random drops(packets/bytes)            : N/A
    RED maxthreshold drops(packets/bytes)      : N/A
    RED ecn marked & transmitted(packets/bytes): 188696802/193225525248
Class tc6
  Classification statistics          (packets/bytes)     (rate - kbps)
    Matched             :           666803815/133360763000         0
    Transmitted         :           642172362/128434472400         0
    Total Dropped       :            24631453/4926290600           0
  Queueing statistics
    Queue ID                             : 18182
    Taildropped(packets/bytes)           : 24631453/4926290600
 
    WRED profile for
    RED Transmitted (packets/bytes)            : N/A
    RED random drops(packets/bytes)            : N/A
    RED maxthreshold drops(packets/bytes)      : N/A
    RED ecn marked & transmitted(packets/bytes): 641807908/128361581600
Class tc5
  Classification statistics          (packets/bytes)     (rate - kbps)
    Matched             :           413636363/82727272600          6138
    Transmitted         :           398742312/79748462400          5903
    Total Dropped       :            14894051/2978810200           235
  Queueing statistics
    Queue ID                             : 18181
    Taildropped(packets/bytes)           : 14894051/2978810200
 
    WRED profile for
    RED Transmitted (packets/bytes)            : N/A
    RED random drops(packets/bytes)            : N/A
    RED maxthreshold drops(packets/bytes)      : N/A
    RED ecn marked & transmitted(packets/bytes): 398377929/79675585800

Note


The RED ecn marked & transmitted(packets/bytes) row displays the statistics for ECN marked packets. To begin with, it displays 0/0.

Traffic Class Queue High Water Marks Monitoring

Table 10. Feature History Table

Feature Name

Release Information

Feature Description

Traffic Class Queue High Water Marks Monitoring

Release 24.2.11

Introduced in this release on Cisco 8000 Series Routers with Cisco Silicon One Q200 network processors. The Cisco 8608 router is not currently supported.

This feature monitors egress interface traffic class queues and records the queue occupancy and queue delay high water marks information for each traffic class. This information includes the virtual output queue that experienced the high water mark and a timestamp indicating when the high water mark was recorded.

You can use this data to identify network bottlenecks and prevent traffic congestion.

This feature introduces these changes:

Configuration CLI:

EXEC commands:

YANG Data Models:

  • cisco-IOS-XR-ofa-npu-qos-oper.yang
  • cisco-IOS-XR-ofa-npu-qos-act.yang
  • cisco-IOS-XR-um-8000-hw-module-profile-cfg.yang
  • cisco-IOS-XR-npu-hw-profile-cfg.yang

Queue occupancy and queue delay are used to measure the amount of congestion experienced by an egress interface's traffic class queue. The high water mark values for a traffic class's queue occupancy and delay can be monitored to help identify potential network bottlenecks.

You can view the following high water marks data for each traffic class on an egress interface after enabling the feature:

Queue Occupancy High Water Marks

  • Maximum queue occupancy observed on the traffic class, in kilobytes and as a percentage of the queue size
  • Queue delay at the time the occupancy high water mark was detected, in nanoseconds
  • Information indicating the virtual output queue that experienced the occupancy high water mark
  • Timestamp indicating when the queue occupancy high water mark was recorded

Queue Delay High Water Marks

  • Maximum queue delay observed on the traffic class, in nanoseconds
  • Queue occupancy at the time the delay high water mark was detected, in kilobytes and as a percentage of the queue size
  • Information indicating the virtual output queue that experienced the delay high water mark
  • Timestamp indicating when the queue delay high water mark was recorded

Limitations and Guidelines for Traffic Class Queue High Water Marks Monitoring

  • The Traffic Class Queue High Water Marks Monitoring and Priority Flow Control (PFC) features can co-exist. In cases where PFC buffer-internal mode is configured, the optional ecn and maximum-threshold parameters must be specified.

    Example:

    Router# hw-module profile priority-flow-control location 0/0/CPU0 
    Router(config-pfc-loc)# buffer-internal traffic-class 3 pause-threshold 1574400 bytes headroom 1651200 bytes ecn 629760 bytes max-threshold 1416960 bytes probability-percentage 50
    Router(config-pfc-loc)# commit
    
  • When a bundle interface is configured, high water marks are monitored on each bundle member interface rather than the bundle interface.
  • Packets that egress a sub-interface or bundle sub-interface contribute to the high water marks on the corresponding parent interface
  • Guidelines for a router that includes a mix of line cards with Cisco Silicon One Q200 network processors and other network processors:
    • Queue occupancy monitoring isn’t supported for packets with a source interface on a non-Q200 network processor. So, these packets do not contribute to the egress interface’s queue occupancy high water marks
    • Queue delay monitoring is supported for packets with a source interface on a non-Q200 network processor. So, these packets contribute to the egress interface’s queue delay high water marks
  • Several virtual output queues (VOQs) are mapped to each egress traffic class queue. The specific number of VOQs depends on the number of slices present on the router and the configured Virtual Output Queueing (VOQ) mode. The high water marks indicate the maximum queue occupancy and queue delay experienced on any of the VOQs mapped to the egress traffic class queue
  • Perform a manual reload of the chassis or all line cards after enabling or disabling this feature
  • The queue occupancy high water mark percentage is calculated based on the maximum supported queue-limit and does not consider any customized queue-limit configured by the end user

Configure Traffic Class Queue High Water Marks Monitoring

Router(config)# hw-module profile qos high-water-marks

A manual reload of the chassis or all line cards is required to enable/disable Traffic Class High Water Marks Monitoring

Router(config)# commit

Verification

Use the show controllers npu qos high-water-marks command after reloading to verify that the feature is enabled.

The command output will be displayed when the feature is enabled. A message similar to the following will be displayed if the feature is not enabled:

RP/0/RP0/CPU0:ios#show controllers npu qos high-water-marks interface all 
Mon Jun  3 06:02:50.138 UTC
Not supported or not enabled on location 0/0/CPU0
RP/0/RP0/CPU0:ios#

Field/Output Description

Table 11. Common fields
Field Description

Interval Start and End (periodic only)

The periodic collection interval number, and the start and end time of the interval.

TC_Number =

(Number range is 0-7)
Indicates the traffic class for the high water marks data displayed on that line. For periodic output, TC_ Number is only displayed for the traffic class's first periodic interval.
Table 12. Queue Occupancy fields
Field Description
Max Occupancy %

The maximum queue occupancy experienced by this traffic class as a percentage of the total queue size.

Due to limited queue quantization thresholds provided by the NPU, the max occupancy percentage and max occupancy kilobytes value below are an estimate of the actual maximum queue occupancy.

Max Occupancy kilobytes

The maximum queue occupancy experienced by this traffic class in kilobytes.

The kilobytes value is calculated with the assumption that all buffers are fully packed (i.e., all 384 bytes utilized in an SMS buffer). As a result, the displayed kilobytes value will be higher than the actual number of kilobytes queued in many cases.

Queue Delay ns

The delay in nanoseconds at the time the maximum queue occupancy high water mark occurred.

Src Sys Port

Slot/NPU/Slc/Gid

The Slot, NPU, Slice and GID identify the virtual output queue on which the queue occupancy high water mark occurred. The GID is the global identifier of the source system port whose packet was dequeued when the maximum queue occupancy high water mark occurred. 

In most cases, all ports on each slice share a virtual output queue.  Although the identified source system port sent the packet that was detected as the high water mark, other ports using the same virtual output queue may have also contributed to the burst of packets that caused the queue occupancy high water mark.

Note

 
When the fair-4 or fair-8 VOQ mode is configured, each source port has its own virtual output queue. When PFC buffer-internal mode is configured, each port shares a virtual output queue with other ports on the same slice interface group (IFG).  There are two IFGs per slice.

Use the show controllers npu voq-usage command to see which other ports share a virtual output queue with the identified source system port.

Timestamp (monotonic only)

The timestamp when the maximum queue occupancy high water mark was recorded. The timestamp corresponds to the time the high water mark information was read from the NPU, and not the timestamp when the high water mark was detected by the NPU.  

The NPU is queried for high water mark info every 30 seconds, so the timestamp indicates the end time of a 30-second timeframe that the high water mark occurred within.

For example, a timestamp of 16:56:44 indicates that the high water mark was observed sometime between 16:56:14 and 16:56:44.

Table 13. Queue Delay fields
Field Description
Max Queue Delay ns

The maximum delay experienced by this traffic class in nanoseconds.

Queue Occupancy %

The queue occupancy as a percentage of the total queue size at the time the maximum queue delay high water mark occurred.

Due to limited queue quantization thresholds provided by the NPU, the occupancy percentage and the occupancy kilobytes value below are an estimate of the actual maximum queue occupancy.

Queue Occupancy kilobytes

The queue occupancy in kilobytes at the time the maximum queue delay high water mark occurred.

The kilobytes value is calculated with the assumption that all buffers are fully packed (i.e., all 384 bytes utilized in an SMS buffer). As a result, the displayed kilobytes value will be higher than the actual number of kilobytes queued in many cases.

Src Sys Port

Slot/NPU/Slc/Gid

The Slot, NPU, Slice and GID identify the virtual output queue on which the queue delay high water mark occurred. The GID is the global identifier of the source system port whose packet was dequeued when the maximum delay high water mark occurred. 

In most cases, all ports on each slice share a virtual output queue.  Although the identified source system port sent the packet that was detected as the high water mark, other ports using the same virtual output queue may have also contributed to the burst of packets that caused the maximum delay high water mark. 

Note

 
When the fair-4 or fair-8 VOQ mode is configured, each source port has its own virtual output queue. When PFC buffer-internal mode is configured, each port shares a virtual output queue with other ports on the same slice interface group (IFG). There are two IFGs per slice.

Use the show controllers npu voq-usage command to see which other ports share a virtual output queue with the identified source system port.

Timestamp (monotonic only)

The timestamp when the maximum delay high water mark was recorded. The timestamp corresponds to the time the high water mark information was read from the NPU, and not the timestamp when the high water mark was detected by the NPU.  

The NPU is queried for high water mark info every 30 seconds, so the timestamp indicates the end time of a 30-second timeframe that the high water mark occurred within.

For example, a timestamp of 16:56:44 indicates that the high water mark was observed sometime between 16:56:14 and 16:56:44.

Example 1: Monotonic High Water Marks for All Traffic Classes

The following output displays monotonic high water marks data (since bootup or the last clear operation) for all traffic classes on interface fourHundredGigE 0/0/0/11:


Note


Monotonic high water marks are displayed if neither the monotonic or periodic keyword is used.
Router# show controllers npu qos high-water-marks interface fourHundredGigE 0/0/0/11

Interface Name        =   FH0/0/0/11
Interface Handle      =        0x1F8
System Port Gid       =           96
Asic Instance         =            0
        
       Queue Occupancy High Water Marks                                Queue Delay High Water Marks
        
       Max Occupancy    Queue     Src Sys Port                         Max Queue   Occupancy     Src Sys Port
       %    kilobytes   Delay ns  Slot/NPU/Slc/Gid Timestamp           Delay ns    %  kilobytes  Slot/NPU/Slc/Gid Timestamp
---------------------------------------------------------------------------------------------------------------------------------- 
TC_0 =   6.00 30965     73728     0/0/2/40         04/08/23 08:39:35   102400     3.00  15482   0/0/1/44       04/05/23 12:22:05  
TC_1 =   0.00 0         0         0/0/0/0          -                   0          0.00  0       0/0/0/0        -                   
TC_2 =  25.00 129024    1114112   0/0/0/48         04/07/23 01:10:23   1179648    15.00 77414   0/0/0/48       04/07/23 21:40:53
TC_3 =  70.00 361267    8912896   0/1/1/56         04/02/23 08:41:44   8912896    70.00 361267  0/1/1/58       04/02/23 08:41:44
TC_4 =  40.00 206438    2228224   3/0/2/4          04/09/23 06:38:35   2359296    25.00 129024  3/0/2/5        04/04/23 18:30:56
TC_5 =   0.00 0         0         0/0/0/0          -                   0          0.00  0       0/0/0/0        -                   
TC_6 =  78.00 599       6437184   3/1/0/24         04/10/23 16:35:00   8628192    64.00 492     7/0/2/76       04/10/23 16:35:00   
TC_7 =  25.00 129024    139264    3/0/0/14         04/06/23 08:39:41   155648     15.00 77414   0/2/2/66       04/08/23 08:39:41

[ -----------     Occupancy High Water Marks     ---------------    ]  [ --------------   Delay High Water Marks  -----------  ]


Example 2: Monotonic High Water Marks for a Single Traffic Class

The following output displays monotonically increasing high water marks data (since bootup or the last clear operation) for traffic class 5 on interface fourHundredGigE 0/0/0/2.

Router# show controllers npu qos high-water-marks monotonic interface fourHundredGigE 0/0/0/2 traffic-class 5  

Interface Name        =    FH0/0/0/2
Interface Handle      =    0xF000120
System Port Gid       =            6
Asic Instance         =            0
        
       Queue Occupancy High Water Marks                                 Queue Delay High Water Marks
        
       Max Occupancy    Queue     Src Sys Port                          Max Queue  Occupancy     Src Sys Port
       %     kilobytes  Delay ns  Slot/NPU/Slc/Gid Timestamp            Delay ns   %  kilobytes  Slot/NPU/Slc/Gid Timestamp
------------------------------------------------------------------------------------------------------------------------------ 
TC_5 = 40.00 206438     6815744   3/0/0/15         11/11/23 17:43:30   1811939328  25.00 129024  7/1/2/89         11/27/23 11:21:26     
[ -----------     Occupancy High Water Marks     ---------------    ]  [ --------------   Delay High Water Marks  ----------- ]  


Example 3: Periodic High Water Marks for a Single Traffic Class

The following output displays high water marks data for the last three periodic collection intervals for traffic class 7 on interface fourHundredGigE 0/0/0/5.

Router# show controllers npu qos high-water-marks periodic last 3 interface fourHundredGigE 0/0/0/5 traffic-class 7 

Interface Name       =    FH0/0/0/5
Interface Handle     =    0xF000138
System Port Gid      =            9
Asic Instance        =            0
        
                                             Queue Occupancy High Water Marks           Queue Delay High Water Marks 
        
                                             Max Occupancy   Queue    Src Sys Port      Max Queue  Occupancy       Src Sys Port 
       Interval Start      End               %     kilobytes Delay ns Slot/NPU/Slc/Gid  Delay ns   %     kilobytes Slot/NPU/Slc/Gid 
-----------------------------------------------------------------------------------------------------------------------------------
TC_7 = 1 12/01/23 17:46:30 12/01/23 17:46:59 50.00 258048    34680274 7/1/2/91          34680274   50.00 258048    7/1/2/91        
       2 12/01/23 17:45:58 12/01/23 17:46:30 60.00 309657    52296260 0/2/1/68          61348106   50.00 258048    7/1/2/91        
       3 12/01/23 17:45:30 12/01/23 17:45:58 40.00 206438    15290430 0/2/1/68          15290430   40.00 206438    0/2/1/68        

                                             [----- Occupancy High Water Marks ----- ]  [ ------- Delay High Water Marks ------  ]