Alert Record
Alert Management records all alerts that are generated in the Cisco Operations Hub cluster. The Alert Management dashboard display an alert summary and detailed information about those alerts.
The documentation set for this product strives to use bias-free language. For the purposes of this documentation set, bias-free is defined as language that does not imply discrimination based on age, disability, gender, racial identity, ethnic identity, sexual orientation, socioeconomic status, and intersectionality. Exceptions may be present in the documentation due to language that is hardcoded in the user interfaces of the product software, language used based on RFP documentation, or language that is used by a referenced third-party product. Learn more about how Cisco is using Inclusive Language.
All alerts are built based on the KPI metrics and divided into several alert groups. Each KPI metric generates one alert that belongs to a predefined alert group.
Alert Management records all alerts that are generated in the Cisco Operations Hub cluster. The Alert Management dashboard display an alert summary and detailed information about those alerts.
The Alerts Overview dashboard displays the alerts summary of total number of firing, pending, and warning alerts categorized based on severity. Cisco Operations Hub supports the following alert severity:
Critical
Major
Minor
Use this task to view a summary of alerts.
Click the main menu at the top-left of the home page, and select Dashboards to view the Dashboard Gallery page.
Navigate to the Operations Hub Dashboard area and click Alerts Overview under the KPI section to open the Alert Overview page. You can view a total number of firing, pending, and warning alerts at a glance and a detailed list of these alerts based on severity.
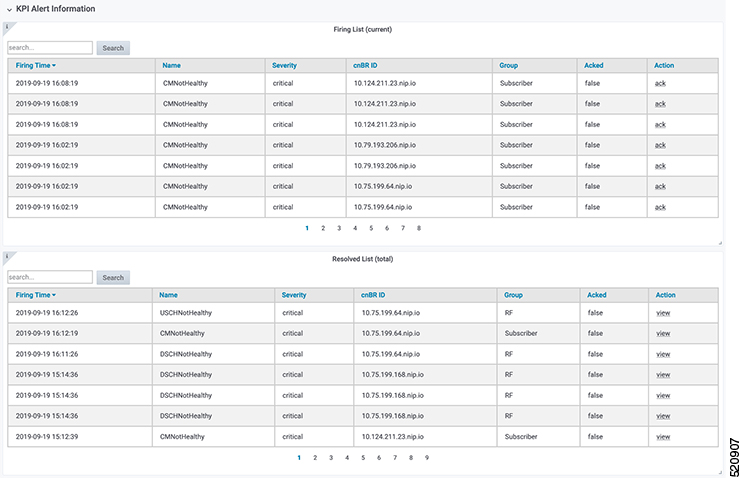
You can view a list of firing alerts that are currently open and a list of resolved alerts.
This procedure enables you to view the lists of firing or resolved alerts.
| Step 1 |
At the main menu, select Dashboards to view the Dashboard Gallery page. |
||||||||||||||||||||||||||||||
| Step 2 |
Navigate to the Operations Hub Dashboard area and click Alert Management under the KPI section to open the Alert Management page. |
||||||||||||||||||||||||||||||
| Step 3 |
In KPI Alert Information area, you can view the following lists:

|
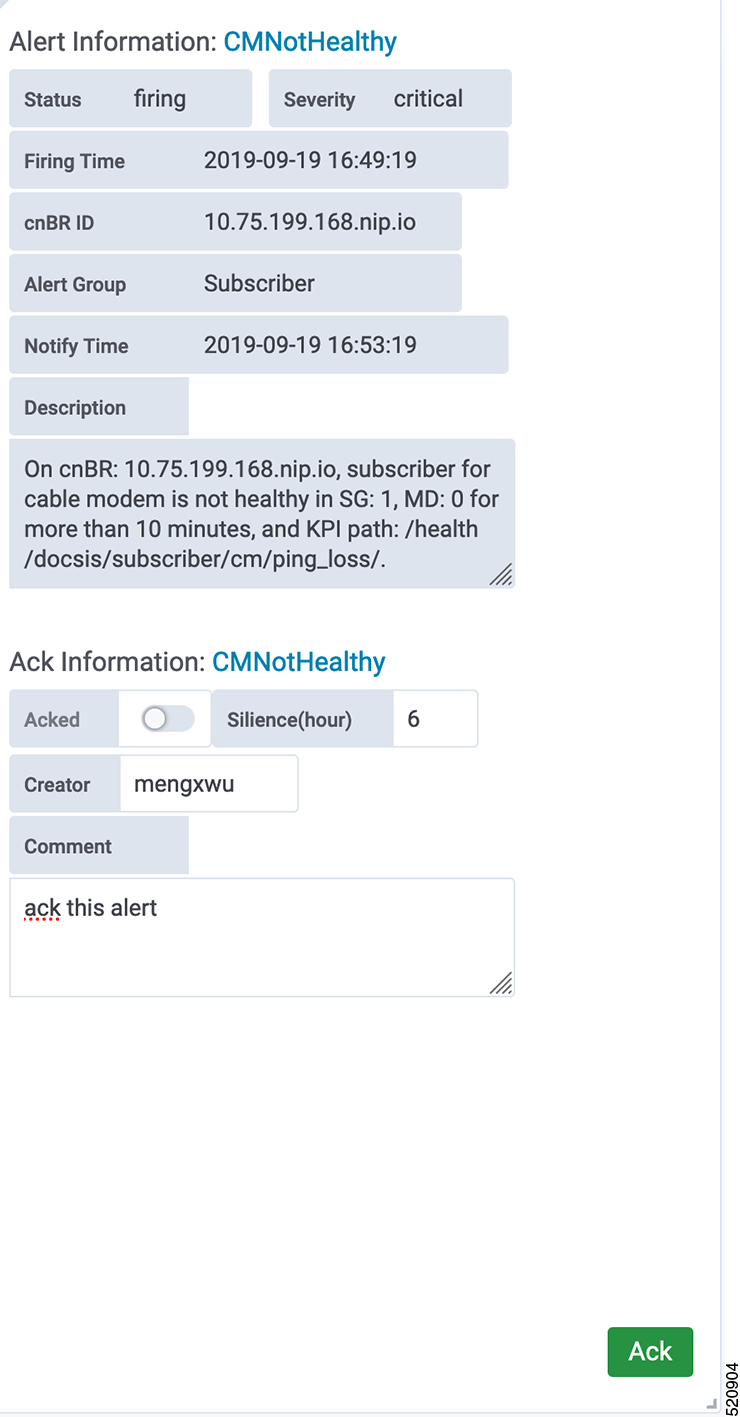
You can acknowledge the firing alerts. By default, every three hours, you are notified about the firing alerts by email. You can stop receiving the alert emails by setting the silence time, creator, and comments.

Key Performance Indicators (KPIs) provide insights into Operations Hub's overall system stability as well as components that are impacting system stability.
The Operations Hub supports the following KPI Alert Groups:
Cluster
OperationsHubInfra
DbUpgrade
InternalUserPasswordExpiry
This procedure configures alerts globally using Simple Mail Transfer Protocol (SMTP).
| Step 1 |
At the main menu, select to view the Dashboard Gallery page. |
||||||||||
| Step 2 |
Navigate to the Operations Hub Dashboard area and click Alert Management under the KPI section to open the Alert Management page. You can configure global alerts in this page. |
||||||||||
| Step 3 |
On the Global Configuration pane under the KPI Alert Configuration area, enter the SMTP General Configuration details.
|
||||||||||
| Step 4 |
Click Config. |
This procedure enables or disables an alert group and add or delete email addresses of receivers for each alert group.
| Step 1 |
At the main menu, select Dashboards to view the Dashboard Gallery page. |
| Step 2 |
Navigate to the Operations Hub Dashboard area and click Alert Management under the KPI section to open the Alert Management page. You can configure global alerts in this page. |
| Step 3 |
On the Group Configuration pane under the KPI Alert Configuration area, choose the alert group from the Alert Group drop-down list. |
| Step 4 |
Click the radio button next to Enabled to enable the alert group. |
| Step 5 |
Click + to add email addresses under the Send To List so the recipients receive notification when an alert is generated under that respective group. |
| Step 6 |
Click Config. 
|
| Feature Name | Release Information | Description |
|---|---|---|
| Cluster Health Monitoring | Cisco Operations Hub 22.2 | Using the alert management functionality, you can view and monitor the cluster health. An alert is raised when there is an issue, and you can take necessary action based on the alert severity. Use the Kubernetes Cluster Health dashboard dashboard to view the cluster health information. . |
Operations Hub enables you to view and monitor the cluster health using the alert management feature. For each cluster, you can map an alert-group to check the cluster health status and take required action. Each alert is categorized based on severity which helps you prioritize the action to be taken for that alert. If you do not specify any alert-group for the cluster, then all available alert-groups are added to the cluster.
Use the Operations Hub Infra Alert Management API to configure alert groups. You can access the Operations Hub Infra Alert Management API using the following steps:
Click the main menu at the top-left of the home page, and select API Explorer. The API Explorer page appears.
Click KPI Alert Management under OPERATIONS HUB API.
The Operations Hub Infra Authentication API page appears.
Choose GET /v1/cluster/health under Alert to access the cluster health API.
Choose GET /v1/alerts/groups under Alert Group to access and configure the alert-groups. There are four alert-groups:
Cluster
DbUpgrade
InternalUserPasswordExpiry
OperationsHubInfra
Health alerts for a cluster can have the following severity:
Critical—Indicates that the cluster has critical problems. Take immediate action before the service degrades further.
Minor—Indicates that a few nonessential pods are not running in the cluster. If you see this alert, then rectify the problem at the earliest.
Clear—Indicates that the cluster has no alerts and everything is working as expected.
Each alert-group is independent in nature, and therefore it is important to review all the alert-groups. Ensure that you take corrective actions that are based on the overall cluster health and not just for an individual alert-group.
For example, an essential pod such as timescaledb can have high CPU usage, which causes it to raise a Critical alert. This is part of the Cluster alert-group for which the cluster's health severity is Critical.
Similarly, if there are no critical alerts for the InternalUserPasswordExpiry alert-group, and all the pods are running in the cluster, then the cluster's health severity is Clear.
You can access the following dashboards to view the cluster health:
At the main menu, choose Dashboards. The Dashboard Gallery page appears.
Click Kubernetes Cluster Health.
The Kubernetes Cluster Health dashboard displays.
Click Alerts Overview.
The Alerts Overview dashboard displays.