Set and Collect UCCE Trace Logs
Available Languages
Contents
Introduction
This document describes how to set tracing in the Cisco Unified Contact Center Enterprise (UCCE) for clients, peripheral gateway (PG) services, the Cisco Customer Voice Portal (CVP), the Cisco UCCE Outbound Dialer, Cisco Unified Communications Manager (CallManager) (CUCM), and Cisco gateways.
Requirements
Cisco recommends that you have knowledge of these topics:
- Cisco Unified Contact Center Enterprise (UCCE)
- Cisco Agent Desktop (CAD)
- Cisco Computer Telephony Integration Object Server (CTIOS)
- Cisco Finesse
- Cisco Customer Voice Portal (CVP)
- Cisco Unified Communications Manager (CallManager) (CUCM)
- Cisco gateways
Trace Settings and Log Collection
Finesse
Log in to the Finesse server with the Secure Shell (SSH) and enter these commands in order to collect the logs you need. You are prompted to identify a SSH FTP (SFTP) server where the logs will be uploaded.
| Logs | Command |
|---|---|
| Install logs | file get install desktop-install.log |
| Desktop logs | file get activelog desktop recurs compress |
| Servm logs | file get activelog platform/log/servm*.\* compress |
| Platform Tomcat logs | file get activelog tomcat/logs recurs compress |
| Voice Operating System (VOS) install logs | file get install install.log |
Cisco Agent Desktop
This procedure describes how to create and collect debug files:
- On the agent computer, go to the C:\Program Files\Cisco\Desktop\Config directory and open the Agent.cfg file.
- Change the debug Threshold from OFF to DEBUG. TRACE can be used for deeper level.
[Debug Log]
Path=..\log\agent.dbg
Size=3000000
Threshold=DEBUG - Ensure Size=3000000 (six zeros).
- Save the configuration file.
- Stop the agent program.
- Delete all files in the C:\Program Files\Cisco\Desktop\log directory.
- Start the agent program, and recreate the problem.
- These debug files are created and placed in C:\Program Files\Cisco\Desktop\log:
- agent0001.dbg
- ctiosclientlog.xxx.log
Cisco Supervisor Desktop
This procedure describes how to create and collect debug files:
- On the agent computer, go to the the C:\Program Files\Cisco\Desktop\Config directory and open the supervisor.cfg file.
- Change the debug THRESHOLD from OFF to DEBUG. TRACE can be used for deeper level.
[Debug Log]
Path=..\log\supervisor.dbg
Size=3000000
THRESHOLD=DEBUG - Ensure Size=3000000 (six zeros).
- Save the configuration file.
- Stop the agent program.
- Delete all files in the C:\Program Files\Cisco\Desktop\log directory.
- Start the agent program, and recreate the problem. A debug file named supervisor0001.dbg is created and placed in C:\Program Files\Cisco\Desktop\log.
CTIOS Client Desktops
On the client PC where the CTIOS client is installed, use Regedt32 in order to turn up tracing. Change these settings:
| Release | Registry Location | Default Value | Change |
|---|---|---|---|
| Releases earlier than 7.x | HKEY_LOCAL_MACHINE\Software\Cisco Systems\Ctios\Logging\TraceMask | 0x07 | Increase value to 0xfff. |
| Release 7.x and later | HKEY_LOCAL_MACHINE\SOFTWARE\Cisco Systems, Inc.\CTIOS Tracing | 0x40000307 | Set value to 0xfff for troubleshooting. |
Default output is created and placed in a text file named CtiosClientLog in the c:\Program Files\Cisco Systems\CTIOS Client\CTIOS Desktop Phones\ install directory.
Client-Related Issues with Tracing and Logs on PG
Debug CAD Sync Service
These are the settings to debug the CAD Sync Service:
| Setting | Value |
|---|---|
| Configuration file Default location |
DirAccessSynSvr.cfg C:\Program Files\Cisco\Desktop\config |
| General issues | Threshold=DEBUG |
| Output files | DirAccessSynSvr.log |
Debug the CAD 6.0(X) RASCAL Server
These are the settings to debug the CAD 6.0(X) RASCAL server:
| Setting | Value |
|---|---|
| Configuration file Default location |
FCRasSvr.cfg C:\Program Files\Cisco\Desktop\config |
| General issues | Range = 1-4, 50, 3000-8000 |
| LDAP-related issues: | Range = 4000-4999 |
| LRM-related issues: | Range = 1999-2000 |
| Database-related issues | Range = 50-59 |
| Output files Default location |
FCRasSvr.log, FCRasSvr.dbg C:\Program Files\Cisco\Desktop\log |
Debug Chat Server
These are the settings to debug the chat server:
| Setting | Value |
|---|---|
| Configuration file Default location |
FCCServer.cfg C:\Program Files\Cisco\Desktop\config |
| General issues | Threshold=DEBUG |
| Output files Default location |
FCCServer.log, FCCServer.dbg C:\Program Files\Cisco\Desktop\log |
Other PG-Related Tracing and Logs
See Use Dumplog Utility to Pull Logs for log collection.
Enable Tracing of CallManager PIM
Use the process monitoring (procmon) utility in order to turn trace levels on and off. These commands turn on CallManager peripheral interface manager (PIM) tracing:
C:\procmon <Customer_Name> <PG_Name> <ProcessName>
>>>trace tp*     !-- Turns on third party request tracing
>>>trace precall !-- Turns on precall event tracing
>>>trace *event  !-- Turns on agent and call event tracing
>>>trace csta*   !-- Turns on CSTA call event tracing
>>>ltrace        !-- Output of all trace bits
>>>q             !-- Quits
This procmon command turns off CallManager PIM tracing:
>>>trace * /off
Enable Tracing on the CUCM
This procedure describes how to turn on CUCM tracing:
- Go to Call Manager Unified Serviceability.
- Select Trace/Configuration.
- Select CM Services.
- Select CTIManager (Active).
- In the top right, select SDL Configuration.
- Enable everything except Disable Pretty Print of SDL Trace.
- Leave the number of files and their sizes at the default values.
- In the Real-Time Monitoring Tool (RTMT), collect Cisco Call Manager and Cisco Computer Telephony Integration (CTI) Manager. Both have system diagnostic interface (SDI) and signal distribution layer (SDL) logs.
Enable Java Telephony Application Programming Interface (JTAPI) Gateway (JGW)
These procmon commands turn on JGW tracing:
C:\procmon <Customer_Name> <node> process
>>>trace JT_TPREQUESTS       !-- Turns on third-party request traces
>>>trace JT_JTAPI_EVENT_USED !-- Turns on traces for the JTAPI Events the PG uses
>>>trace JT_ROUTE_MESSAGE    !-- Turns on routing client traces
>>>trace JT_LOW*             !-- Traces based on the underlying JTAPI and CTI layers
An example command is procmon ipcc pg1a jgw1.
Enable CTI Server (CTISVR) Tracing on Active Side
This procedure describes how to enable CTISVR tracing on the active side:
- Use the registry editor in order to edit HKLM\software\Cisco Systems, Inc\icm\<cust_inst>\CG1(a and b)\EMS\CurrentVersion\library\Processes\ctisvr.
- Set EMSTraceMask = f8.
Enable Tracing VRU PIM
These procmon commands turn on tracing for VRU PIM:
C:\procmon <Customer_Name> <PG_Name> <ProcessName>
procmon>>>trace *.* /off !-- Turns off
procmon>>>trace          !-- Verifies what settings are on/off
procmon>>>trace cti* /onprocmon>>>trace opc* /on
procmon>>>trace *ecc* /onprocmon>>>trace *session* /off
procmon>>>trace *heartbeat* /off
procmon>>>ltrace /traceprocmon>>>quit
This procmon command turns off VRU PIM tracing:
>>>trace * /off
Enable CTIOS Server Tracing on Both CTIOS Servers
This procedure describes how to enable tracing on both CTIOS servers:
- Make a note of the current trace mask for later use.
- Use the registry editor in order to edit HLKM >> Software\Cisco Systems Inc.\ICM\<cust_inst\CTIOS\EMS\CurrentVersion\library\Processes\ctios.
- Set:
- EMSTraceMask = 0x60A0F
- EMSTraceMask to one of these values, depending upon the release:
- 0x0A0F for Release 6.0 and earlier
- 0x20A0F for Release 7.0 and 7.1(1)
- 0x60A0F for Release 7.1(2) and later
The default trace mask is 0x3 in all releases except Release 7.0(0), where it is 0x20003.
If the trace mask has a high value (0xf or higher), there is a large impact on CTIOS server performance and call completion rate. Set the trace mask at a high value only when you are debugging a problem; once you have collected the needed logs, you must set the trace mask back to its default value.
For troubleshooting purposes, set the CTIOS server trace mask to:
- 0x0A0F for Release 6.0 and earlier
- 0x20A0F for Release 7.0, and 7.1(1)
- 0x60A0F for Release 7.1(2) and later
Enable Open Peripheral Controller (OPC) Tracing on Active PG
These opctest commands turn on OPC tracing on an active PG:
opctest /cust <cust_inst> /node <node>
opctest:debug /agent /routing /cstacer /tpmsg /closedcalls
This is an example from a lab environment:
C:\Documents and Settings\ICMAdministrator>opctest /cust cc1 /node pg1a
OPCTEST Release 8.0.3.0 , Build 27188
opctest: debug /agent /routing /cstacer /tpmsg /closedcalls !-- Use debug /on in
   order to restore default tracing levels
opctest: quit
Additional examples are:
opctest:debug /agent /routing /cstacer /rcmsg /closedcalls /inrcmsg
!-- General example

opctest:debug /agent /routing /cstacer /rcmsg /closedcalls /inrcmsg /NCT
!-- Network transfer example

opctest:debug /agent /routing /cstacer /rcmsg /closedcalls /inrcmsg /task    /passthru
!-- Multimedia example

opctest:debug /agent /routing /cstacer /rcmsg /closedcalls /inrcmsg /passthru
!-- VRU PG example
Enable Eagtpim Tracing on Active PG
These procmon commands turn on eagtpim tracing on an active PG:
C:\>procmon <cust_inst> <node> pim<pim instance
>>>>trace tp* /on
>>>trace precall /on
>>>trace *event /on
>>>trace csta* /on
This is an example from a lab environment:
C:\Documents and Settings\ICMAdministrator>procmon cc1 pg1a pim1
>>>>trace tp* /on
>>>>trace precall /on
>>>>trace *event /on
>>>>trace csta* /on
>>>>quit
Use Dumplog Utility to Pull Logs
Refer to How to Use the Dumplog Utility for additional details. Use the cdlog command in order to get to the logfiles directory, as shown in this example:
c:\cdlog <customer_name> pg1a   !-- Or, pgXa to depending on the PG number (X)
c:\icm\<customer_name>\<<PG#>>\logfiles\
These examples show how to place output in the default file; in all cases, you can use /of in order to define a specific name for the output file:
c:\icm\<customer_name>\<PG#>\logfiles\dumplog pim1 /bt <HH:MM> /et <HH:MM> /ms /o
!-- This PIM example places output in a default pim1.txt file

c:\icm\<customer_name>\<PG#>\logfiles\dumplog opc /bt <HH:MM> /et  <HH:MM> /ms /o
!-- This OPC example places output in a default opc.txt file

c:\icm\<customer_name>\<PG#>\logfiles\dumplog jgw1 /bt <HH:MM> /et <HH:MM> /ms /o
c:\cdlog <customer_name> cg1a
c:\icm\<customer_name>\<cg#>\logfiles\
!-- This JTAPI example places output in a default jgw1.txt file

c:\icm\<customer_name>\cg#\logfiles\dumplog ctisvr /bt <HH:MM> /et <HH:MM> /ms /o
!-- This CTI server example places output in a default ctisvr.txt file

c:\ icm\<customer_name>\ctios\logfiles\dumplog ctios /bt <HH:MM> /et <HH:MM> /ms /o
!-- This CTIOS server example places output in a default ctios.txt file
Enable Tracing on CVP Servers
SIP
This procedure describes how to enable tracing on CVP servers with Cisco SIP IP Phone software:
- On the call server(s), go to the CVP diag tool (http://localhost(CallServer):8000/cvp/diag) in order to get the Session Initiation Protocol (SIP) stack.
- Add com.dynamicsoft.Dslibs.DsUAlibs with debug.
- Click Set.
- Click DEBUG/41.
H323
This procedure describes how to enable tracing on CVP servers with an H323 gateway:
- On the call server(s), log in to VBAdmin.
- Enable these traces for the CVP Voice Browser:
setcalltrace on
setinterfacetrace on
Pull CVP Logs from Call Servers
Collect the CVP *.log file and Error.log files for the time of the test period. These files are in the C:\Cisco\CVP\logs directory on both CVP servers.
These are the locations of the log files for Unified CVP, where CVP_HOME is the directory in which the Unified CVP software is installed.
| Type of Logs | Location |
|---|---|
Call server and/or reporting server logs |
CVP_HOME\logs\ |
| Operations console logs | CVP_HOME\logs\OAMP\ |
| Voice XML (VXML) server logs | CVP_HOME\logs\VXML\ |
| Simple Network Management Protocol (SNMP) agent logs | CVP_HOME\logs\SNMP\ |
| Unified CVP resource manager logs | CVP_HOME\logs\ORM\ |
An example location is C:\Cisco\CVP.
VXML Server Logs
For custom voice XML applications such as a deployed Audium application, you can turn on a debug logger.
Add this line to the <loggers> section (the last section) of the settings.xml configuration file in the C:\Cisco\CVP\VXMLServer\applications\APP_NAME\data\application\ directory:
<logger_instance name="MyDebugLogger"
   class="com.audium.logger.application.debug.ApplicationDebugLogger"/>
At runtime, this logger outputs a detailed VoiceXML log to the \Cisco\CVP\VXMLServer\applications\APP_NAME\MyDebuggerLogger directory.
Outbound Dialer-Related Tracing and Log Collection
This procedure describes how to increase the badialer process logs on the Outbound Dialer (which is usually found on a PG).
- Ensure EMSDisplaytoScreen = 0.
- Use the registry editor in order to edit HKEY_LOCAL_MACHINE\SOFTWARE\Cisco Systems, Inc.\ICM\<instance>\Dialer\EMS\CurrentVersion\Library\Processes\baDialer.
- Set:
- EMSTraceMask = 0xff
- EMSUserData = ff ff (four f's in binary mode)
- Use the registry editor in order to edit HKEY_LOCAL_MACHINE\SOFTWARE\Cisco Systems, Inc.\ICM\<instance>\Dialer.
- Set DebugDumpAllEvents = 1.
Pull Logs
Run the dumplog utility from the /icm/<instance>/dialer/logfiles directory:
dumplog badialer /bt hh:mm:ss /et hh:mm:ss /o
On the Importer
This procedure describes how to increase the baimport process log.
- Use the registry editor in order to edit HKEY_LOCAL_MACHINE\SOFTWARE\Cisco Systems, Inc.\ICM\<instance>\LoggerA\EMS\CurrentVersion\Library\Processes\ baImport.
- Set:
- EMSTraceMask = 0xff
- EMSUserData = ff ff (four f's in binary mode)
- Run the dumplog utility from the /icm/<instance>/la/logfiles directory:
dumplog baimport /bt hh:mm:ss /et hh:mm:ss /o
On the Campaignmanager
This procedure describes how to increase the campaignmanager process log.
- Use the registry editor in order to edit HKEY_LOCAL_MACHINE\SOFTWARE\Cisco Systems, Inc.\ICM\<instance>\LoggerA\EMS\CurrentVersion\Library\Processes\CampaignManager.
- Set:
- EMSTraceMask = 0xff
- EMSUserData = ff ff (four f's in binary mode)
- Run the dumplog utility from the /icm/<instance>/la/logfiles directory:
dumplog campaignmanager /bt hh:mm:ss /et hh:mm:ss /o
On the Avaya Communications Manager (ACD) PG, use the opctest utility in order to increase the following for both CallManager and Avaya.
C:\opctest /cust <instance> /node <pgname>
opctest: type debug /agent /closedcalls /cstacer /routing
opctest: q !-- Quits
This procedure describes how to increase the tracing for the ctisvr process.
- Use the registry editor in order to edit HKEY_LOCAL_MACHINE\SOFTWARE\Cisco Systems, Inc.\ICM\icm\CG1A\EMS\CurrentVersion\Library\Processes\ctisvr.
- Set EMSTraceMask = f8. You can leave the value at f0 if you want.
Enable Router Logs on Router Process
This procedure describes how to enable router logs:
- On the router, navigate to Start > Run, and enter rtrtrace.
- Type the customer name.
- Click Connect.
- Select these options:
- agentchanges
- routerequests
- scriptselects
- networkvrutracing
- translationroute
- callqueuing
- calltyperealtime
- Click Apply.
- Exit the utility.
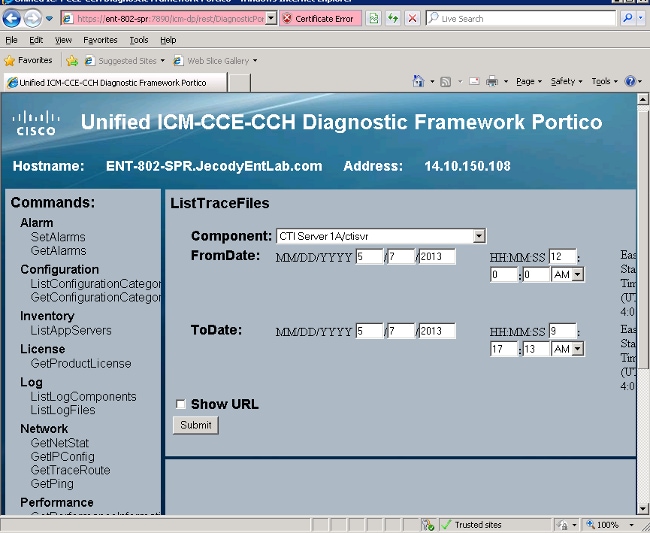
For opctest Release 8.5, use the Diagnostic Framework Portico instead.
debug level 3 component "icm:Router A" subcomponent icm:rtr
Pull Router Logs
Use the dumplog utility in order to pull router logs from either router for the time period of the tests. Refer to How to Use the Dumplog Utility for additional details.
This is an example of a log request for logs on 10/21/2011 between 09:00:00 and 09:30:00 (in 24-hour time format). This output goes to the file C:/router_output.txt:
C:\Documents and Settings\ICMAdministrator>cdlog u7x ra
C:\icm\u7x\ra\logfiles>dumplog rtr /bd 10/21/2011 /bt 09:00:00 /ed 10/21/2011
   /et 09:30:00 /ms /of C:/router_output.txt
Submit the output file (C:/router_output.txt) to Cisco for troubleshooting if needed.
Gateway Traces (SIP)
These commands turn on tracing on CVP servers with SIP:
#conf  t
service timestamps debug datetime msec
service timestamps log datetime msec
service sequence-numbers
no logging console
no logging monitor
logging buffered 5000000 7
end
clear logging
This is a very robust platform that can handle the suggested debugs at the provided call volume without issue. However, Cisco recommends that you:
- Send all logs to a syslog server instead of to the logging buffer:
logging <syslog server ip>
logging trap debugs - Apply the debug commands one at a time, and check the CPU utilization after each one:
show proc cpu hist
Enable these debugs:
debug isdn q931
debug voip ccapi inout
debug ccsip mess
debug http client all
debug voip application vxml all
debug vtsp all
debug voip application all
After you make the call and simulate the issue, stop the debugging:
#undebug all
Collect this output:
term len 0
show ver
show run
show log
CUSP Tracing
These commands turn on SIP tracing on the Cisco Unified SIP Proxy (CUSP):
(cusp)> config
(cusp-config)> sip logging
(cusp)> trace enable
(cusp)> trace level debug component sip-wire
Remember to turn logging off once you are done.
This procedure describes how to collect the logs:
- Configure a user on the CUSP (for example, test).
- Add this configuration at the CUSP prompt:
username <userid> create
username <userid> password <password>
username <userid> group pfs-privusers - FTP to the CUSP IP address. Use the username (test) and password as defined in the previous step.
- Change directories to /cusp/log/trace.
- Get the log_<filename>.
Use of CLI for Tracing
In UCCE Release 8 and later, you can use the Unified System Command-Line Interface (CLI) in order to collect traces. Compared to the dumplog utilities, the CLI is a very fast and efficient method to obtain an entire set of logs from one server such as a PG or Rogger.
This procedure describes how to start problem analysis and how to determine what tracing to enable. The example gathers logs from these servers:
- ROUTER-A/ROUTER-B
- LOGGER-A/LOGGER-B
- PGXA/PGXB
- All CVP Call Servers
- All CVP VXML/Media Servers (if present)
- On each system in the list, open Unified System CLI on each server, and execute this command:
show tech-support absdatetime mm-dd-yyyy:hh:mm mm-dd-yyyy:hh:mm redirect
   dir c:\temp
Replace the first mm-dd-yyyy:hh:mm string with a date and time that is approximately 15 minutes before the event.
This produces a file named clioutputX.zip, where X is the next number in sequence.
Replace the second mm-dd-yyyy:hh:mm string with a date and time that is approximately 15 minutes after the event is resolved. If the event is still occurring, gather at least 15 minutes. - Export each system's Windows Application/Security/System logs in comma-separated values (CSV) format, and save to the C:\Temp directory.
- Add the Windows CSV logs to the zip from step 1, and rename the zip file in this format:
<SERVERNAME>-SystCLILogs-EvntOn-YYYYMMDD_HHMMSS.zip - On any agent PG, collect the logs in the directory C:\Program Files\Cisco\Desktop\logs every time the failure is seen. Zip the logs into a file with a name in this format:
<SERVERNAME>-CADLogs-EvntOn-YYYYMMDD_HHMMSS.zip
If you are using CAD-Browser Edition (CAD-BE) or any CAD web products, gather the logs from the C:\Program Files\Cisco\Desktop\Tomcat\logs directory, and add them to the same zip file.
If you are running on any of the Windows 2008 x64 products, the log directory is under C:\Program Files (x86)\Cisco\Desktop\...
- Attach these files to the service request, or upload the files to FTP if they are too large to email or attach.
Gather this additional information if possible:
- The event start and stop time.
- Several samples of the ANI/DNIS/AgentID involved in the event. At a minimum, Cisco needs at least one of these in order to see the event.
- The RouteCallDetail (RCD) and TerminationCallDetail (TCD) for the time period surrounding the event.
- The RCD query is:
SELECT * FROM Route_Call_Detail WHERE DbDateTime > 'YYYY-MM-DD HH:MM:SS.MMM' and DbDateTime < 'YYYY-MM-DD HH:MM:SS.MMM' - The TCD query is:
SELECT * FROM Termination_Call_Detail WHERE DbDateTime > 'YYYY-MM-DD HH:MM:SS.MMM' and DbDateTime < 'YYYY-MM-DD HH:MM:SS.MMM'
- The RCD query is:
CLI Example
There are two tools: a Diagnostic Framework tool and the system CLI tool. Both are icons either on the desktop or under the Programs directory on each server.
This procedure describes how to use the Unified System CLI for tracing.
- Click the Unified System CLI icon, then log in with the domain and the username. (In this example, the domain administrator has logged in before, so the CLI already knows the domain (JecodyEntLab) and user name (Jcody).
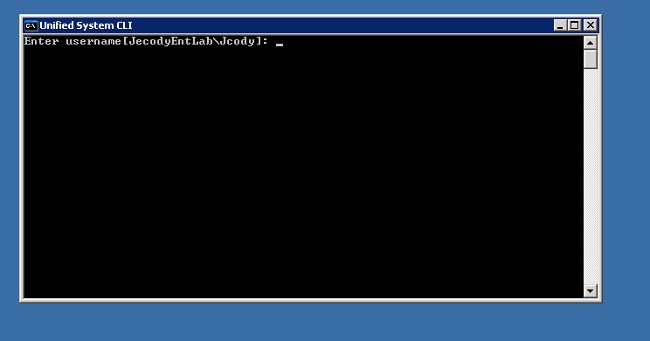
- Enter the password.
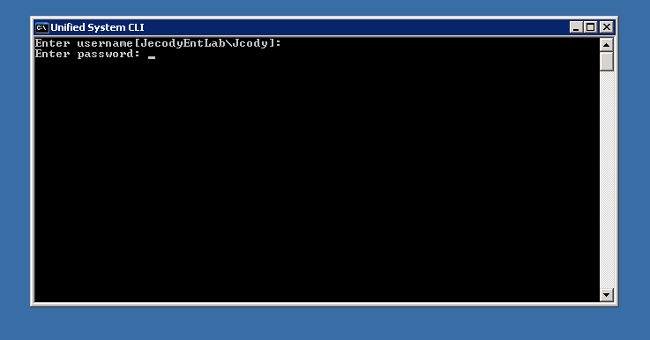
- Enter the instance name; in this example, it is v802. Look on the PG at one of the services; the instance name is the first part of the service name.
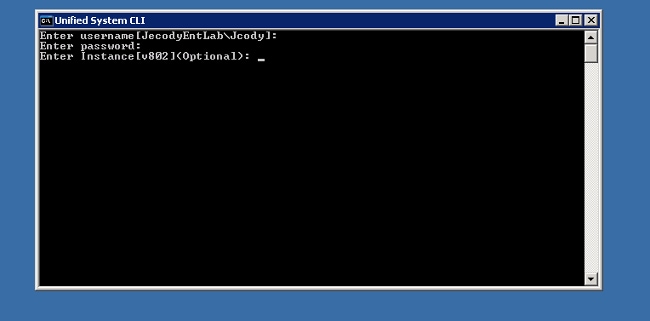
- A simple way to find the instance name is to look at the services that are running on the server.
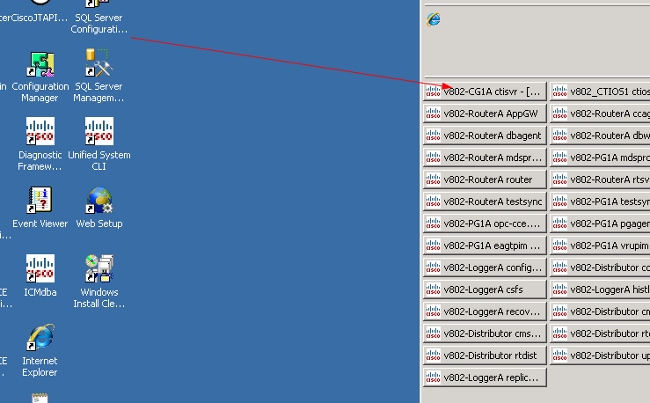
- Once you see the welcome message, enter this command:
show tech-support absdatetime mm-dd-yyyy:hh:mm mm-dd-yyyy:hh:mm redirect dir c:\temp
- Replace the first mm-dd-yyyy:hh:mm string with a date and time that is approximately 15 minutes before the event.
- Replace the second mm-dd-yyyy:hh:mm string with a date and time that is approximately 15 minutes after the event is resolved.
- If the event is still occurring, gather at least 15 minutes.
- This produces a file named clioutputX.zip, where X is the next number in sequence.
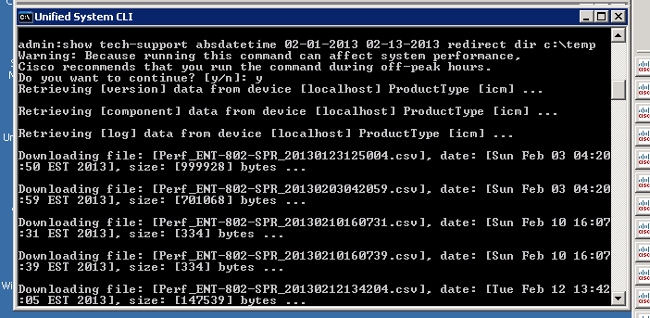
- Replace the first mm-dd-yyyy:hh:mm string with a date and time that is approximately 15 minutes before the event.
- Once the process completes, look for the clioutputX.zip file in the directory:
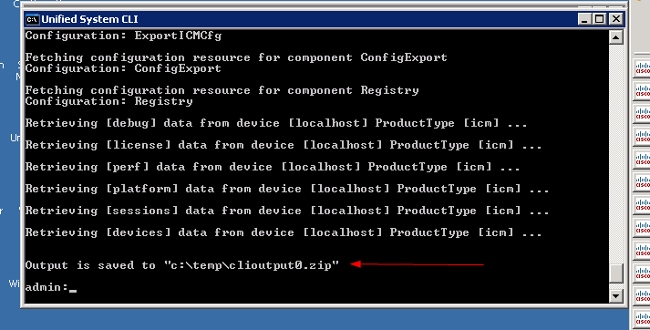
- If you need only one log, you may find it easier to use the older dumplog utility or to use the Diagnostic Framework Portico:
Contact Cisco
- Open a Support Case

- (Requires a Cisco Service Contract)


 Feedback