Understand Output Drops on Catalyst 9000 Switches
Available Languages
Download Options
Bias-Free Language
The documentation set for this product strives to use bias-free language. For the purposes of this documentation set, bias-free is defined as language that does not imply discrimination based on age, disability, gender, racial identity, ethnic identity, sexual orientation, socioeconomic status, and intersectionality. Exceptions may be present in the documentation due to language that is hardcoded in the user interfaces of the product software, language used based on RFP documentation, or language that is used by a referenced third-party product. Learn more about how Cisco is using Inclusive Language.
Contents
Introduction
This document describes how to troubleshoot output drops on high-speed interfaces on the UADP ASIC based Catalyst 9000 series platforms.
Prerequisites
Requirements
Cisco recommends that you have knowledge of these topics:
- Standard QoS concepts
- Modular QoS Command Line Interface (CLI)
- Wireshark
Components Used
The information in this document is based on these software and hardware versions:
- UADP 2.0 and UADP 3.0 ASIC types
- Catalyst 9200
- Catalyst 9300
- Catalyst 9400
- Catalyst 9500
- Catalyst 9600
- Cisco IOS® XE 16.X or 17.X software
Note: Consult the appropriate configuration guide for the commands that are used in order to enable these features on other Cisco platforms.
The information in this document was created from the devices in a specific lab environment. All of the devices used in this document started with a cleared (default) configuration. If your network is live, ensure that you understand the potential impact of any command.
Background Information
Output drops on high-speed interfaces are an issue that can occur in any network environments, particularly when it deals with interfaces that support data transfer rates of 10 Gbps or higher. Output drops occur when packets are dropped by the interface before they can be transmitted onto the network.
It is often misunderstood how interface utilization is interpreted when output drops occur at low levels of utilization:
- When too much traffic is sent out of a single interface, the buffers for that interface can become overwhelmed and output drops occur. An interface with too few buffers can also increase the probability of output drops.
- Output drops can also be caused by a mismatch between the speed of the interface and the speed of the connected device. For example, if a 10 Gbps interface is connected to a device that only supports a data transfer rate of 1 Gbps, the interface can drop packets if it is unable to slow down the data rate to match the capabilities of the device.
However, in a large majority of cases output drops are caused by microburst traffic that exhausted the port buffers:
- A microburst refers to a phenomenon in which a large amount of traffic is sent in a very short period of time, typically it lasts only a few milliseconds and exceeds the available bandwidth of the interface.
- When a microburst occurs, network devices need to buffer the traffic until it can be transmitted onto the network. If the buffer size is exceeded, packets are dropped.
Network traffic is often measured by the average utilization of a link (measured over 30 seconds to 5 minutes depending on configuration). Although this average shows a steady and relatively even flow, when viewed at a millisecond scale interface utilization is often very bursty.
Figure 1. Shows a visual representation of the underlying cause of output drops on high-speed interface.

- Packet flows A, B, and C represent groups of bits in a flow.
- Flows A, B, and C are transmitted through the 100G interface and received at the next hop switch.
- Observe that A and some of B bits are successfully forwarded out the 10G egress interface.
- However, when flow C arrives the switch has buffered some of the bits from flow B due to the inability to dequeue bits as quickly as they are arriving.
- The buffer becomes full and cannot hold both the remaining B bits and all of the bits in packet C.
- If the ingress classifier determines there is not room for even one bit of the next frame, it drops the entire packet!
- Flow A and some of B are transmitted through the 10G interface.
Interface "Speed/Bandwidth" are both somewhat of misnomers:
- Bandwidth = data (bits)/time
- Bits do not "physically speed up" when they traverse from 10G > 100G > 10G
The "speed" difference is the interleaving capabilities/number of lanes/number of pulses per time interval, encoding mechanism, and so on, versus the media (light/electrons) going faster.
Tip: Use the load-interval <30-600> command under interface configuration mode to modify the load interval delay in seconds. (load interval represents the frequency the switch polls interface counters).
Verify
Troubleshoot output drops on high-speed interfaces can be a complex process, but here are some general steps that can help identify and resolve the issue:
Identify the affected interface:
- Start by narrowing down the interface that experiences the output drops.
- Use the show interfaces | include is up|Total output drops command output or use monitoring tools to determine which interface faces the issue.
Identify Inbound and Outbound Interfaces:
- To verify the interface to ASIC mappings, run the command show platform software fed <switch|active> ifm mappings.
Verify buffer allocation:
- It is important to verify the buffer allocation and interface configuration for the affected interfaces.
Verify the microburts with Wireshark:
- Output drops on high-speed interfaces can often be caused by microbursts of traffic.
- Use traffic analysis tools such Wireshark to monitor traffic patterns and identify any potential microbursts.
Consider a hardware upgrade:
- If the previous steps do not resolve the issue, it is necessary to upgrade hardware, such as the interface, device, or network infrastructure, to handle the increased traffic.
Identify the Affected Interface
To identify the affected interface that experiences output drops, use the show interfaces command.
- This command provides detailed information about each interface that includes statistics on input and output errors, dropped packets, and other critical information.
To narrow down the list of interfaces and quickly identify the affected interface, use the show interfaces | include is up|Total output drops command to filter out interfaces down, or admin down, and only show those that are active and have drops.
- For example, you can use this command to display only the interfaces that have experienced output drops.
Cat9k(config)#show interfaces | in is up|Total output drops
HundredGigE1/0/1 is up, line protocol is up (connected)
Input queue: 0/2000/0/0 (size/max/drops/flushes); Total output drops: 54845
HundredGigE1/0/10 is up, line protocol is up (connected)
Input queue: 0/2000/0/0 (size/max/drops/flushes); Total output drops: 1540231
--snip--
Tip: Use the show interfaces command and filter the output with the appropriate criteria to quickly and easily identify the affected interface. Take the necessary steps to resolve the issue.
By default, on Catalyst 9000 series switches, egress packet drops are shown in bytes instead of packets. It is important to determine whether the amount of output drops found had any actual impact or were simply caused by transient bursty traffic.
To calculate the percentage of the total output bytes transmitted on an interface that were dropped:
- Collect the total output drops count from the interface.
- Collect the total output bytes count from the interface.
- Calculate the percentage of output drops. Divide the total output drops count by the total output byte count and multiplying by 100.
This provides the percentage of output bytes that were dropped on the interface, which can help you determine whether there is a congestion or buffer allocation issue that needs to be addressed, or whether the output drops were caused by transitory microbusrt traffic.
Use the showinterface <interface> command to collect the information.
Cat9k#show interfaces twentyFiveGigE 1/0/41
TwentyFiveGigE1/0/41 is up, line protocol is up (connected)
  Hardware is Twenty Five Gigabit Ethernet, address is dc77.4c8a.4289 (bia dc77.4c8a.4289)
  MTU 1500 bytes, BW 25000000 Kbit/sec, DLY 10 usec,
     reliability 255/255, txload 3/255, rxload 1/255
  Encapsulation ARPA, loopback not set
  Keepalive set (10 sec)
  Full-duplex, 10Gb/s, link type is auto, media type is SFP-10GBase-AOC1M
  input flow-control is on, output flow-control is off
  ARP type: ARPA, ARP Timeout 04:00:00
  Last input 00:00:06, output 00:00:10, output hang never
  Last clearing of "show interface" counters 6w1d
  Input queue: 0/2000/0/0 (size/max/drops/flushes); Total output drops: 299040207
  Queueing strategy: Class-based queueing
  Output queue: 0/40 (size/max)
  30 second input rate 767000 bits/sec, 155 packets/sec
  30 second output rate 14603000 bits/sec, 1819 packets/sec
     931864194 packets input, 572335285416 bytes, 0 no buffer
     Received 933005 broadcasts (933005 multicasts)
     0 runts, 0 giants, 0 throttles
     0 input errors, 0 CRC, 0 frame, 0 overrun, 0 ignored
     0 watchdog, 0 multicast, 0 pause input
     0 input packets with dribble condition detected
     1067891106 packets output, 5930422327799 bytes, 0 underruns
--snip--
Total output drops: 299040207
Total output bytes: 5930422327799
Percentage of output drops = 299040207/5930422327799 x 100 = 0.005%
In this example, the total output drops represent 0.005% of the total amount of bytes transmitted on this interface in the past six weeks (last clearing of counters 6w1d).
- The total number of packets versus the number dropped is minor, and will not have any impact.
Identify Inbound and Outbound Interfaces
To better allocate soft buffers and manage traffic on the Catalyst 9000 series switches, consider selecting inbound and outbound interfaces in different ASICs.
A soft buffer, also known as a dynamic buffer or shared buffer, refers to a portion of memory that is dynamically allocated to temporarily store packets in periods of congestion or high traffic load.

Tip: Please refer to the Understand Queue Buffer Allocation on Catalyst 9000 Switches document for detailed information on buffer allocation in the Catalyst 9000 series switches.
Based on the architecture of a specific model of Catalyst 9000 switches, it is important to note that they often incorporate multiple ASICs responsible for various functions.
To verify the interface to ASIC mappings, you can run the command: show platform software fed <switch|active> ifm mappings
This example shows the interface to ASIC mappings. Interface range TenGigabitEthernet1/0/1 to TenGigabitEthernet1/0/24 are mapped to ASIC 1 while the rest are mapped to ASIC 0:
Cat9k#show platform software fed switch active ifm mappings
Interface                 IF_ID    Inst Asic Core Port SubPort Mac  Cntx LPN  GPN  Type Active
TenGigabitEthernet1/0/1   0x9        3   1   1    0      0      11   0    1    1    NIF  Y
TenGigabitEthernet1/0/2   0xa        3   1   1    1      0      10   1    2    2    NIF  Y
TenGigabitEthernet1/0/3   0xb        3   1   1    2      0      9    2    3    3    NIF  Y
TenGigabitEthernet1/0/4   0xc        3   1   1    3      0      8    3    4    4    NIF  Y
TenGigabitEthernet1/0/5   0xd        3   1   1    4      0      7    4    5    5    NIF  Y
TenGigabitEthernet1/0/6   0xe        3   1   1    5      0      6    5    6    6    NIF  Y
TenGigabitEthernet1/0/7   0xf        3   1   1    6      0      5    6    7    7    NIF  Y
TenGigabitEthernet1/0/8   0x10       3   1   1    7      0      4    7    8    8    NIF  Y
TenGigabitEthernet1/0/9   0x11       3   1   1    8      0      3    8    9    9    NIF  Y
TenGigabitEthernet1/0/10  0x12       3   1   1    9      0      2    9    10   10   NIF  Y
TenGigabitEthernet1/0/11  0x13       3   1   1    10     0      1    10   11   11   NIF  Y
TenGigabitEthernet1/0/12  0x14       3   1   1    11     0      0    11   12   12   NIF  Y
TenGigabitEthernet1/0/13  0x15       2   1   0    12     0      11   0    13   13   NIF  Y
TenGigabitEthernet1/0/14  0x16       2   1   0    13     0      10   1    14   14   NIF  Y
TenGigabitEthernet1/0/15  0x17       2   1   0    14     0      9    2    15   15   NIF  Y
TenGigabitEthernet1/0/16  0x18       2   1   0    15     0      8    3    16   16   NIF  Y
TenGigabitEthernet1/0/17  0x19       2   1   0    16     0      7    4    17   17   NIF  Y
TenGigabitEthernet1/0/18  0x1a       2   1   0    17     0      6    5    18   18   NIF  Y
TenGigabitEthernet1/0/19  0x1b       2   1   0    18     0      5    6    19   19   NIF  Y
TenGigabitEthernet1/0/20  0x1c       2   1   0    19     0      4    7    20   20   NIF  Y
TenGigabitEthernet1/0/21  0x1d       2   1   0    20     0      3    8    21   21   NIF  Y
TenGigabitEthernet1/0/22  0x1e       2   1   0    21     0      2    9    22   22   NIF  Y
TenGigabitEthernet1/0/23  0x1f       2   1   0    22     0      1    10   23   23   NIF  Y
TenGigabitEthernet1/0/24  0x20       2   1   0    23     0      0    11   24   24   NIF  Y
TenGigabitEthernet1/0/25  0x21       1   0   1    24     0      11   0    25   25   NIF  Y
TenGigabitEthernet1/0/26  0x22       1   0   1    25     0      10   1    26   26   NIF  Y
TenGigabitEthernet1/0/27  0x23       1   0   1    26     0      9    2    27   27   NIF  Y
TenGigabitEthernet1/0/28  0x24       1   0   1    27     0      8    3    28   28   NIF  Y
TenGigabitEthernet1/0/29  0x25       1   0   1    28     0      7    4    29   29   NIF  Y
TenGigabitEthernet1/0/30  0x26       1   0   1    29     0      6    5    30   30   NIF  Y
TenGigabitEthernet1/0/31  0x27       1   0   1    30     0      5    6    31   31   NIF  Y
TenGigabitEthernet1/0/32  0x28       1   0   1    31     0      4    7    32   32   NIF  Y
TenGigabitEthernet1/0/33  0x29       1   0   1    32     0      3    8    33   33   NIF  Y
TenGigabitEthernet1/0/34  0x2a       1   0   1    33     0      2    9    34   34   NIF  Y
TenGigabitEthernet1/0/35  0x2b       1   0   1    34     0      1    10   35   35   NIF  Y
TenGigabitEthernet1/0/36  0x2c       1   0   1    35     0      0    11   36   36   NIF  Y
TenGigabitEthernet1/0/37  0x2d       0   0   0    36     0      11   11   37   37   NIF  Y
TenGigabitEthernet1/0/38  0x2e       0   0   0    37     0      10   10   38   38   NIF  Y
TenGigabitEthernet1/0/39  0x2f       0   0   0    38     0      9    9    39   39   NIF  Y
TenGigabitEthernet1/0/40  0x30       0   0   0    39     0      8    8    40   40   NIF  Y
TenGigabitEthernet1/1/1   0x31       0   0   0    40     0      0    19   41   41   NIF  N
TenGigabitEthernet1/1/2   0x32       0   0   0    41     0      0    18   42   42   NIF  N
TenGigabitEthernet1/1/3   0x33       0   0   0    42     0      0    17   43   43   NIF  N
TenGigabitEthernet1/1/4   0x34       0   0   0    43     0      0    16   44   44   NIF  N
TenGigabitEthernet1/1/5   0x35       0   0   0    44     0      0    15   45   45   NIF  N
TenGigabitEthernet1/1/6   0x36       0   0   0    45     0      0    14   46   46   NIF  N
TenGigabitEthernet1/1/7   0x37       0   0   0    46     0      0    13   47   47   NIF  N
TenGigabitEthernet1/1/8   0x38       0   0   0    47     0      0    12   48   48   NIF  N
FortyGigabitEthernet1/1/1 0x39       0   0   0    48     0      4    4    49   49   NIF  N
FortyGigabitEthernet1/1/2 0x3a       0   0   0    49     0      0    0    50   50   NIF  N
Buffer Allocation
Buffer allocation is an important factor to avoid output drops because buffers are used to temporarily store traffic that cannot be forwarded due to congestion or other variables. If there are not enough buffers available, the traffic is dropped, leading to poor network performance and potential disruptions. With this verification, you can ensure that the switch has enough buffer space to handle high traffic loads.
The show platform hardware fed switch active qos queue stats interface <interface> command allows you to see per-queue statistics on an interface, which includes how many bytes were enqueued into the buffers, and how many bytes were dropped due to lack of available buffers.
In this example:
- Queues 0 to 4 are currently holding enqueued traffic. The traffic received on this interface is temporarily stored in the buffers until it can be transmitted.
- Only Queue 2 has experienced discarded or dropped traffic (24010607 Bytes).
Cat9k#show platform hardware fed active qos queue stats interface twentyFiveGigE 1/0/41
----------------------------------------------------------------------------------------------
AQM Global counters
GlobalHardLimit: 16257   |   GlobalHardBufCount: 0
GlobalSoftLimit: 39039   |   GlobalSoftBufCount: 0

----------------------------------------------------------------------------------------------
High Watermark Soft Buffers:  Port Monitor Disabled
----------------------------------------------------------------------------------------------
Asic:0 Core:0 DATA Port:8 Hardware Enqueue Counters
----------------------------------------------------------------------------------------------
 Q Buffers          Enqueue-TH0          Enqueue-TH1          Enqueue-TH2             Qpolicer
   (Count)              (Bytes)              (Bytes)              (Bytes)              (Bytes)
-- ------- -------------------- -------------------- -------------------- --------------------
 0       0                    0             40588200              9368282                    0
 1       0                    0             23584521               789524                    0
 2       0                    0                    0         110307150901                    0
 3       0                    0                    0            487852543                    0
 4       0                    0                    0              5483512                    0
 5       0                    0                    0                    0                    0
 6       0                    0                    0                    0                    0
 7       0                    0                    0                    0
Asic:0 Core:0 DATA Port:8 Hardware Drop Counters
--------------------------------------------------------------------------------------------------------------------------------
 Q             Drop-TH0             Drop-TH1             Drop-TH2             SBufDrop              QebDrop         QpolicerDrop
                (Bytes)              (Bytes)              (Bytes)              (Bytes)              (Bytes)              (Bytes)
-- -------------------- -------------------- -------------------- -------------------- -------------------- --------------------
 0                    0                    0                    0                    0                    0                    0
 1                    0                    0                    0                    0                    0                    0
 2                    0                    0             24010607 <-- (drops on Q2)  0                    0                    0
 3                    0                    0                    0                    0                    0                    0
 4                    0                    0                    0                    0                    0                    0
 5                    0                    0                    0                    0                    0                    0
 6                    0                    0                    0                    0                    0                    0
 7                    0                    0                    0                    0                    0                    0
Troubleshoot
Modify Buffer Allocation
To increase the value of the soft buffers used by an interface, use the qos queue-softmax-multipliercommand in the global configuration mode:
- Specify a value in the range of 100 to 4800. The default value is 100.
- This command increases the ability of a single port queue to absorb microbursts.
- This command increases the port queue thresholds so that the port queue can consume additional buffer units from the shared pool.
This configuration applies across all interfaces:
- The buffer allocation itself assumes that the microbursts does not happen on all ports on the switch at the same time.
- If microbursts happen at random moments, the shared buffer can dedicate additional buffer units to absorb them.
Use the qos queue-softmax-multiplier<100 4800>command in the global configuration mode to modify the soft buffer allocation. If you configure this to the maximum value available, it provides the switch with the highest probability to eliminate or reduce output drops. This is a commonly recommended best practice to avoid drops whenever possible.
Cat9k(config)#qos queue-softmax-multiplier ?
<100-4800> multiplier(%)
Use the show platform hardware fed active qos queue config interface <interface>command to identify the Soft Buffer allocation on Catalyst 9000 Series.
This example shows the default Soft Buffers allocatedon an interface that has negotiated to 10Gbps speed on a Catalyst 9500.
Cat9k#show platform hardware fed active qos queue config interface twentyFiveGigE 1/0/41
Asic:0 Core:0 DATA Port:8 GPN:141 LinkSpeed:0x12
AFD:Disabled FlatAFD:Disabled QoSMap:0 HW Queues: 64 - 71
  DrainFast:Disabled PortSoftStart:5 - 4320 BufferSharing:Disabled
   DTS  Hardmax  Softmax   PortSMin  GlblSMin  PortStEnd   QEnable
  ----- --------  --------  --------  --------  ---------  -------
 0   1  6   480   8  1920  16   960   0     0   3  5760      En <-- 1920 is the total soft buffers allocated to queue 0 on interface twentyFiveGigE 1/0/41
 1   1  5     0  11  2880  16  1440   8   720   3  5760      En <-- 2880 is the total soft buffers allocated to queue 1 on interface twentyFiveGigE 1/0/41
 2   1  5     0   6     0   0     0   0     0   3  5760      En
 3   1  5     0   6     0   0     0   0     0   3  5760      En
 4   1  5     0   6     0   0     0   0     0   3  5760      En
 5   1  5     0   6     0   0     0   0     0   3  5760      En
 6   1  5     0   6     0   0     0   0     0   3  5760      En
 7   1  5     0   6     0   0     0   0     0   3  5760      En
 Priority   Shaped/shared   weight  shaping_step  sharpedWeight
 --------   -------------   ------  ------------   -------------
 0      0     Shared            50           0           0
 1      0     Shared            75           0           0
 2      0     Shared         10000           0           0
 3      0     Shared         10000           0           0
 4      0     Shared         10000           0           0
 5      0     Shared         10000           0           0
 6      0     Shared         10000           0           0
 7      0     Shared         10000           0           0
 Port       Port            Port    Port
 Priority   Shaped/shared   weight  shaping_step
 --------   -------------   ------  ------------
        2     Shaped          1023        1023
  QPolicer     Refresh Credit   Max Credit  Interval Idx
 -----------   --------------   ----------  ------------
 0 Disabled                 0            0           0
 1 Disabled                 0            0           0
 2 Disabled                 0            0           0
 3 Disabled                 0            0           0
 4 Disabled                 0            0           0
 5 Disabled                 0            0           0
 6 Disabled                 0            0           0
 7 Disabled                 0            0           0

   Weight0 Max_Th0 Min_Th0 Weigth1 Max_Th1 Min_Th1  Weight2 Max_Th2 Min_Th2
   ------- ------- ------- ------- ------- -------  ------- ------- ------
 0       0    1912       0       0    2137       0       0    2400       0 <-- Thresholds values in queue 0 on interface twentyFiveGigE 1/0/41
 1       0    2295       0       0    2565       0       0    2880       0 <-- Thresholds values in queue 1 on interface twentyFiveGigE 1/0/41
 2       0       0       0       0       0       0       0       0       0
 3       0       0       0       0       0       0       0       0       0
 4       0       0       0       0       0       0       0       0       0
 5       0       0       0       0       0       0       0       0       0
 6       0       0       0       0       0       0       0       0       0
 7       0       0       0       0       0       0       0       0       0
This example shows the Soft Buffers allocated on an interface that has negotiated to 10Gbps speed on a Catalyst 9500 with 4800 multiplier configured.
Cat9k#show platform hardware fed active qos queue config interface twentyFiveGigE 1/0/41
Asic:0 Core:0 DATA Port:8 GPN:141 LinkSpeed:0x12
AFD:Disabled FlatAFD:Disabled QoSMap:0 HW Queues: 64 - 71
  DrainFast:Disabled PortSoftStart:4 - 42000 BufferSharing:Disabled
   DTS  Hardmax  Softmax   PortSMin  GlblSMin  PortStEnd   QEnable
  ----- --------  --------  --------  --------  ---------  -------
 0   1  6   480  10 42000   1  1312   0     0   4 42000      En <-- 42000 is the total soft buffers allocated to queue 0 on interface twentyFiveGigE 1/0/41
 1   1  5     0  10 42000   1  1312   1  1312   4 42000      En <-- 42000 is the total soft buffers allocated to queue 1 on interface twentyFiveGigE 1/0/41
 2   1  5     0   6     0   0     0   0     0   4 42000      En
 3   1  5     0   6     0   0     0   0     0   4 42000      En
 4   1  5     0   6     0   0     0   0     0   4 42000      En
 5   1  5     0   6     0   0     0   0     0   4 42000      En
 6   1  5     0   6     0   0     0   0     0   4 42000      En
 7   1  5     0   6     0   0     0   0     0   4 42000      En
 Priority   Shaped/shared   weight  shaping_step  sharpedWeight
 --------   -------------   ------  ------------   -------------
 0      0     Shared            50           0           0
 1      0     Shared            75           0           0
 2      0     Shared         10000           0           0
 3      0     Shared         10000           0           0
 4      0     Shared         10000           0           0
 5      0     Shared         10000           0           0
 6      0     Shared         10000           0           0
 7      0     Shared         10000           0           0
 Port       Port            Port    Port
 Priority   Shaped/shared   weight  shaping_step
 --------   -------------   ------  ------------
        2     Shaped          1023        1023
  QPolicer     Refresh Credit   Max Credit  Interval Idx
 -----------   --------------   ----------  ------------
 0 Disabled                 0            0           0
 1 Disabled                 0            0           0
 2 Disabled                 0            0           0
 3 Disabled                 0            0           0
 4 Disabled                 0            0           0
 5 Disabled                 0            0           0
 6 Disabled                 0            0           0
 7 Disabled                 0            0           0

   Weight0 Max_Th0 Min_Th0 Weigth1 Max_Th1 Min_Th1  Weight2 Max_Th2 Min_Th2
   ------- ------- ------- ------- ------- -------  ------- ------- ------
 0       0   33851       0       0   37833       0       0   42480       0 <-- Thresholds values in queue 0 on interface twentyFiveGigE 1/0/41
 1       0   33468       0       0   37406       0       0   42000       0 <-- Thresholds values in queue 1 on interface twentyFiveGigE 1/0/41
 2       0       0       0       0       0       0       0       0       0
 3       0       0       0       0       0       0       0       0       0
 4       0       0       0       0       0       0       0       0       0
 5       0       0       0       0       0       0       0       0       0
 6       0       0       0       0       0       0       0       0       0
7 0 0 0 0 0 0 0 0 0Note: The allocation of Soft Buffers varies. It is possible that the allocation will not match the output above. The allocation output differs, depending on the specific platform used, QoS policies applied, and negotiated operating speed of the interface in question.
Modify Per-Queue Buffers
Per-Queue buffer modification can be leveraged for scenarios where you cannot use the SoftMax multiplier or in scenarios where you attempt to fine tune the buffers to fit a traffic profile.
- To modify the queue buffer allocation the switch on a per interface basis you must use policy-maps.
- In most circumstances you modify the current policy-map of an interface and change the buffers on a per-class basis.
In this example interface, twentyFiveGigE 1/0/1 has experienced output drops. As shown in the command output egress policy-map that is applied to this interface.
The show platform hardware fed switch active qos queue stats interface <interface> command allows you to see per-queue statistics on an interface, which includes how many bytes were enqueued into the buffers, and how many bytes were dropped due to lack of available buffers.
Cat9k#show platform hardware fed active qos queue stats interface twentyFiveGigE 1/0/1
----------------------------------------------------------------------------------------------
AQM Global counters
GlobalHardLimit: 16257   |   GlobalHardBufCount: 0
GlobalSoftLimit: 39039   |   GlobalSoftBufCount: 0

----------------------------------------------------------------------------------------------
High Watermark Soft Buffers:  Port Monitor Disabled
----------------------------------------------------------------------------------------------
Asic:0 Core:0 DATA Port:8 Hardware Enqueue Counters
----------------------------------------------------------------------------------------------
 Q Buffers          Enqueue-TH0          Enqueue-TH1          Enqueue-TH2             Qpolicer
   (Count)              (Bytes)              (Bytes)              (Bytes)              (Bytes)
-- ------- -------------------- -------------------- -------------------- --------------------
 0       0                    0                    0                   82                    0
 1       0                    0                    0                 7517                    0
 2       0                    0                    0         110307150901                    0
 3       0                    0                    0           7174010710                    0
 4       0                    0                    0                    0                    0
 5       0                    0                    0                    0                    0
 6       0                    0                    0                    0                    0
 7       0                    0                    0                    0
Asic:0 Core:0 DATA Port:8 Hardware Drop Counters
--------------------------------------------------------------------------------------------------------------------------------
 Q             Drop-TH0             Drop-TH1             Drop-TH2             SBufDrop              QebDrop         QpolicerDrop
                (Bytes)              (Bytes)              (Bytes)              (Bytes)              (Bytes)              (Bytes)
-- -------------------- -------------------- -------------------- -------------------- -------------------- --------------------
 0                    0                    0                    0                    0                    0                    0
 1                    0                    0                    0                    0                    0                    0
 2                    0                    0             24010607                    0                    0                    0
 3                    0                    0             20071103                    0                    0                    0
 4                    0                    0                    0                    0                    0                    0
 5                    0                    0                    0                    0                    0                    0
 6                    0                    0                    0                    0                    0                    0
 7                    0                    0                    0                    0                    0                    0
To alleviate the output drops on this interface, based on Enqueue counters, Q0 to Q1 have a very low enqueue rate, and thus cannot require as many buffers as Q2 and Q3. The recommended action is to allocate more buffers to Queue 2 and Queue 3, since these queues have a higher amount of enqueued traffic compared to any other queue.
- To modify the buffer allocation, you can use the queue-buffers ratio <0-100> configuration in the policy-map applied to interface twentyFiveGigE 1/0/1.

Note: if this command is configured on each class in the policy, it must add up to 100. However, if only a single class is configured, the system evenly subtracts buffers from the other queues.
This example shows how to configure a queue-buffers ratio on a policy-map.
Cat9k(config)#policy-map test
Cat9k(config-pmap)# class Voice
Cat9k(config-pmap-c)# priority level 1
Cat9k(config-pmap-c)# queue-buffers ratio 5
Cat9k(config-pmap-c)# class Video
Cat9k(config-pmap-c)# bandwidth remaining percent 50
Cat9k(config-pmap-c)# queue-buffers ratio 15
Cat9k(config-pmap-c)# class BuisnessCritical
Cat9k(config-pmap-c)# bandwidth remaining percent 30
Cat9k(config-pmap-c)# queue-buffers ratio 40           <-- Queue 3
Cat9k(config-pmap-c)# class class-default
Cat9k(config-pmap-c)# bandwidth remaining percent 20
Cat9k(config-pmap-c)# queue-buffers ratio 40           <-- Queue 4
From the Cisco IOS XE 17.2.1 release, switches based on UADP 3.0 (Catalyst 9500 High Performance and Catalyst 9600) can be configured to share the Active Queue Management (AQM) buffers between the two cores inside the same ASIC.
- A port configured with buffer sharing uses any of the available AQM buffers regardless of the cores to which the AQM buffers are mapped.
- This helps to manage higher bursts of traffic that would have saturated the buffer of a single AQM core.
- You can enable this feature with the qos share-buffer command in global configuration mode.
- You can check the feature with the show platform hardware fed active qos queue config interface command. This is a global configuration that affects the whole system.
You can disable buffer share with the no form of the command, no qos share-buffer.
Cat9k(config)#qos share-buffer
Cat9k(config)#end
Analyze Output Drops With Wireshark
To verify the presence of microbursts on a network, you can use a packet capture tool like Wireshark:
- Wireshark captures packets and allows you to analyze network traffic in real-time or post-capture.
-
To identify what microbursts occur when a drop happens with Wireshark, start the packet capture on the affected interface, and check the interface repeatedly until an output drop occurs.
- Once the capture is complete, open the capture file in Wireshark and look for periods of high traffic followed by periods of low or no traffic. These are potential microbursts.
To effectively capture and analyze output drops on a interface, use these recommendations:
- EPC (Embedded Packet Capture) must not be used. EPC limits all traffic to a maximum of 1000 packets per second (pps), which can potentially invalidate the data.
- A TX-Only SPAN of the interface where the output drops are identified is the recommended method.
- The source and destination ports must have the same speed, or the destination port must have a higher speed than the source port when you use SPAN. This ensures that the SPAN session does not introduce additional network congestion or packet drops due to mismatched port speeds.
- It is important to collect the SPAN session while the output drops are actively incrementing. This ensures that you capture the relevant traffic and can identify the root cause of the microburst. If the SPAN session is collected after the drops have occurred, you will not be able to capture the relevant traffic.
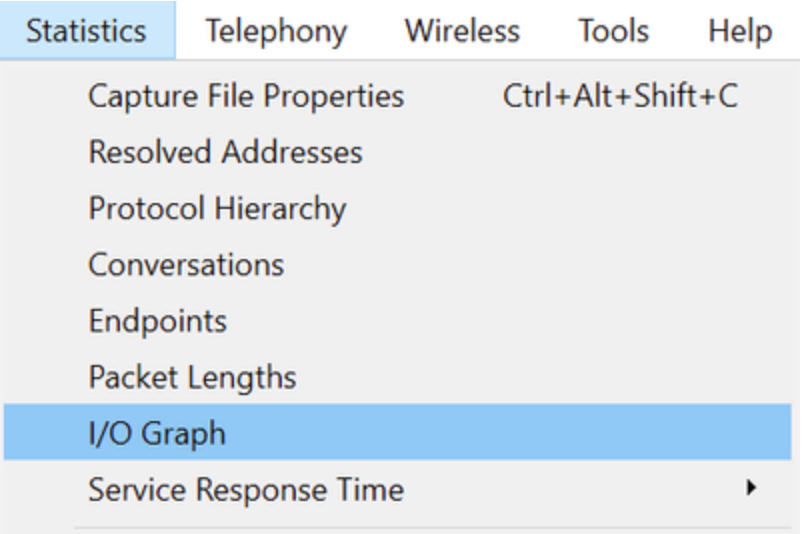
To confirm whether these periods of high traffic are indeed microbursts, use the Wireshark I/O graph feature. Since the I/O graph displays a graphical representation of network traffic over time, it is easier to identify microbursts. To create an I/O graph, go to Statistics > I/O Graph:
Note: To demonstrate this procedure, we used a packet capture taken on a 1 Gbps interface. However, the steps are the same for troubleshooting output drops on any high-speed interface.
Figure 2. Select the I/O graph.
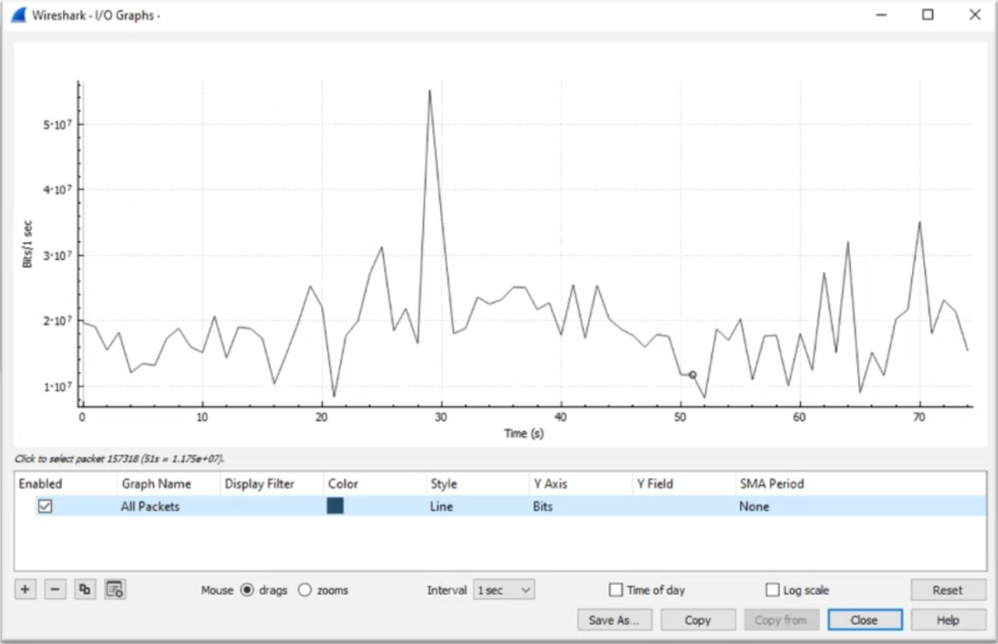
The next graph shows a line that represents the amount of data in transit over time. Look for spikes in the graph, which indicate periods of high traffic. If these spikes are followed by periods of low or no traffic, you have possibly identified a microburst.
Figure 3. Shows the I/O graph of the packet capture.
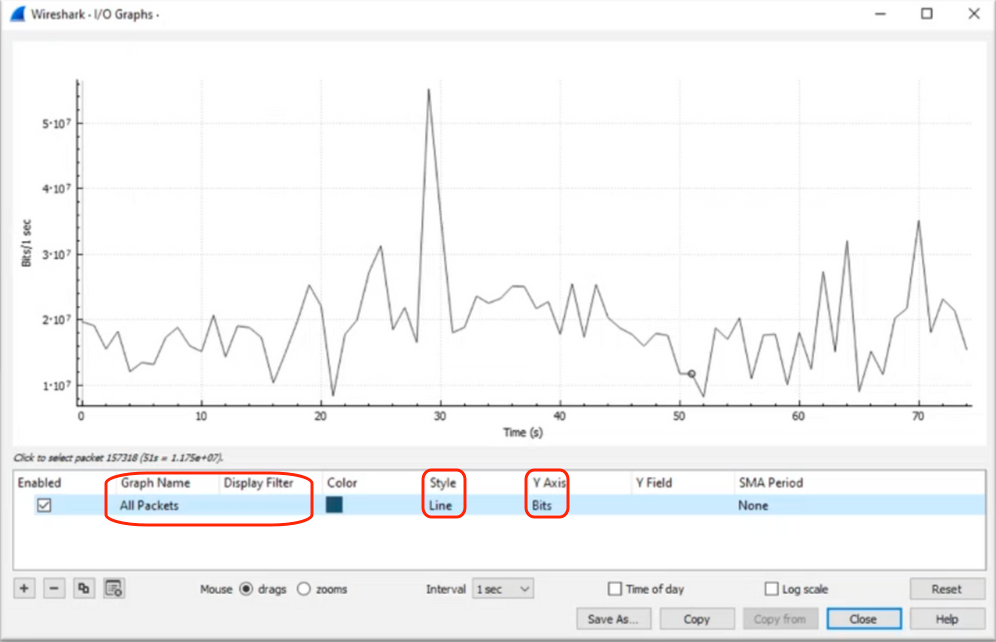
It is important to ensure that all packets are selected with no display filter applied. Additionally, select the Line Graph option and set the Y-Axis to Bits to properly analyze the traffic.
Figure 4. Shows how to select the Line Graph option and set the Y-Axis to Bits.
When you analyze a large packet capture, It is crucial to identify the specific period of time that you are interested in. For example, in this scenario, it can be observed that there is a large amount of traffic in the vicinity of 30 seconds.
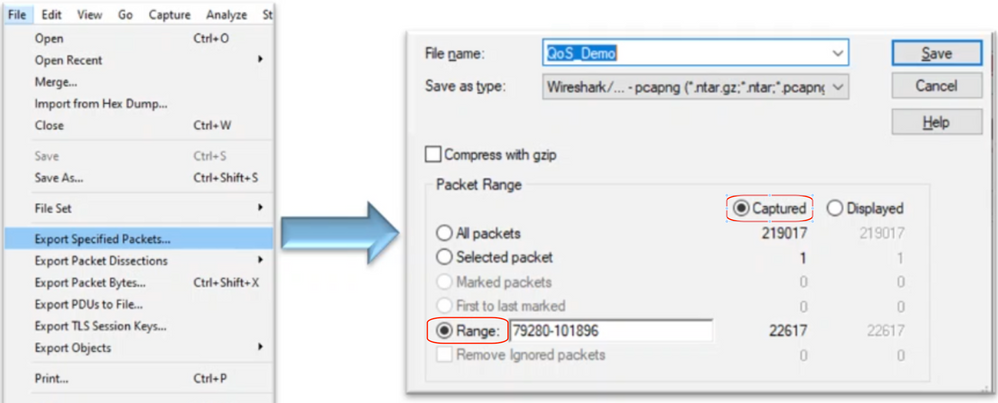
Clicking on the peak of a spike in the I/O graph causes Wireshark to select that packet in the background. In our scenario, packets 79280 and 101896 were selected to create a subset of the packet capture in order to work within the timestamps where the presence of microbursts is suspected.
Figure 5. Shows how to create a subset of the packet capture that focuses on the suspected timestamps of microburst presence.

To export the first and last packets selected to a new file, ensure to select the Range and Captured radio icons.
Figure 6. Shows how to export and save the subset of the packet capture.
After you save the file, open it and navigate back to the I/O graph. Ensure the interval is set to 1ms to graph the spikes seen on a millisecond basis.
Figure 7. Shows the I/O graph of the exported subset of the packet capture.
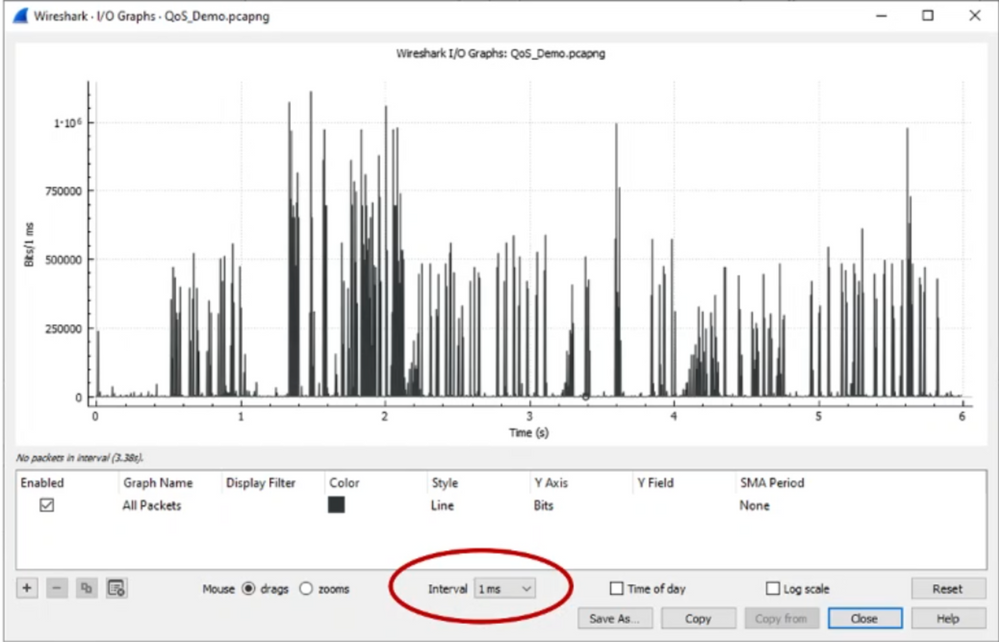
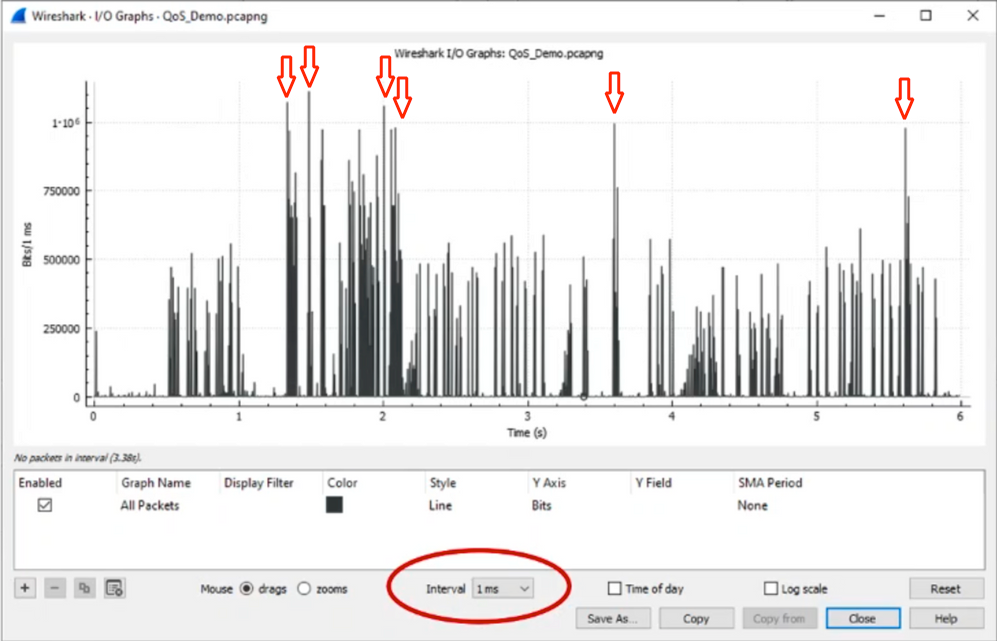
When the graph is displayed, it is important to identify spikes that represent periods where the traffic was transmitted at line rate for a full millisecond, which cause the buffer to fill up and where output drops could have been generated. For example, on a 1 Gbps interface, this would correspond to 1,000,000 bits per millisecond. Click on the peak of a spike that represents a potential microburst. It helps to identify the packet that has caused the output drops. This packet can then be further analyzed to determine the root cause of the microburst and take corrective actions.
Figure 8. Shows how to identify potential microburst traffic in the I/O graph.

Warning: It is important to be aware of this limitation when you use Wireshark or any other packet capture tool on high-speed interface. High-speed interfaces, such as 40G and 100G, generate a substantial volume of network traffic that has the potential to overwhelm the resources of the system used to capture packets. Consequently, this can lead to dropped packets during the capture process and can impact the accuracy and completeness of the captured data.
Alternative Approaches
If you have exhausted the resources allocated to a queue and still experience drops, you need to consider alternative options to manage congestion. These can include:
- Upgrade interface speeds. You can move from 1G to 10G, 10G to 25G, or 40G to increase egress bandwidth and reduce the oversubscription ratio.
- Change the platform to one with a larger per-queue/per-interface buffer.
- Adjust application settings to reduce the size of the burst that causes output drops.
- Use a queueing scheduler to prioritize one class of traffic over another. This method prioritizes the protection of more important traffic at the expense of increased drops for less important traffic.
- Implement congestion management algorithms such as Weighted Random Early Discard (WRED) or Weighted Tail Drop (WTD) to drop traffic earlier. WRED or WTD thresholds can lead to the earlier drop of bursty traffic, resulting in the automatic reduction of transmit windows for end clients. This allows other less bursty traffic to encounter reduced congestion, ensuring a minimal buffer allocation for different traffic classes during periods of high congestion.
- Police traffic closest to the source of a known high-bandwidth application, such as data backups to reduce the frequency and severity of bursts on the network. This gives low-bandwidth areas between the source and destination, located elsewhere on the network, more opportunity to manage both the bursty traffic and normal network traffic effectively.
- Use Port-channels. However, it is important to note that due to hashing, there is a possibility of multiple flows being directed to a single member, which can lead to persistent drops.
It is important to note that some of these options require more involved configurations, such as traffic engineering, but can provide significant benefits to mitigate network congestion and output drops.
Related Information
- Cisco Catalyst 9000 Switching Platforms: QoS and Queuing White Paper
- Quality of Service Configuration Guide, Cisco IOS XE 17.x
- Cisco Optics-to-Device Compatilbility Matrix
- Support Innovation: How Cisco TAC is transforming documentation and simplifying self-service
- Technical Support & Documentation - Cisco Systems
Revision History
| Revision | Publish Date | Comments |
|---|---|---|
2.0 |
15-Jul-2024 |
Initial Release, shortened title, modified Alt Text and made stylistic changes. |
1.0 |
07-Jun-2023 |
Initial Release |
Contributed by Cisco Engineers
- Leonardo Pena Davila
- Ambrose Taylor
- Kris Gabrielsen
Contact Cisco
- Open a Support Case

- (Requires a Cisco Service Contract)
 Feedback