Manage Interface Statistics on a Switch
Available Languages
Objective
As the administrator of the network, it is good practice to check the behavior of the interfaces on a switch. Good maintenance is key in the performance of a network. With the Cisco Small Business Series Switches, you can check how many packets are being sent through an interface and in which form.
The Interface page of the switch is useful for analyzing the amount of traffic that is both sent and received and its dispersion such as Unicast, Multicast, and Broadcast packets. Furthermore, if an interface has problems, you can perform a diagnostic test on the cable that is plugged on that interface to see its status. With this information in hand, you can make better decisions when you troubleshoot an interface.
This article provides instructions on how to manage the statistics and diagnostics of the interfaces on your switch.
Applicable Devices
- Sx200 Series
- Sx250 Series
- Sx300 Series
- Sx350 Series
- SG350X Series
- Sx500 Series
- Sx550X Series
Software Version
- 1.4.7.06 — Sx200, Sx300, Sx500
- 2.2.8.04 — Sx250, Sx350, SG350X, Sx550X
Manage Interface Statistics on your Switch
Manage Statistics of an Interface
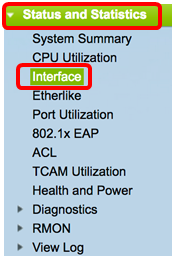
Step 1. Log in to the web-based utility of your switch then choose Status and Statics > Interface.
Note: The available menu options may vary depending on the device model. In this example, SG350X-48MP is used.
Step 2. In the Interface area, choose the interface for which the Ethernet statistics are to be displayed.
Note: In this example, Port GE4 of Unit 2 is chosen.

Note: If you have a non-stackable switch such as Sx250 or Sx300 Series switch, the options are Port and LAG only.

Step 3. Click a refresh rate from Refresh Rate area. This is the time period that passes before the interface statistics are refreshed.

- No refresh — The information about the interface that will not refresh with new information.
- 15 sec — The information about the interface refreshes every 15 seconds.
- 30 sec — The information about the interface refreshes every 30 seconds.
- 60 sec — The information about the interfaces refreshes every 60 seconds
Note: In this example, 60 sec is chosen.
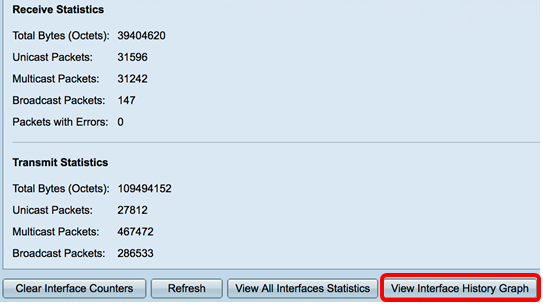
The Receive Statistics area displays the following information for the chosen interface:
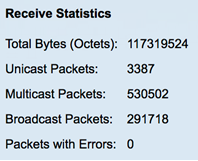
Receive Statistics
- Total Bytes (Octets) — Displays the number of octets received, which includes the number of bad packets and the Frame Check Sequence (FCS) octets. The FCS checks if the validity of a frame.
- Unicast Packets — Displays the information about the number of good unicast packets received. A unicast is a one-to-one connection between two users.
- Multicast Packets — Displays the information about the number of good multicast packets received. A multicast is one-to-many connection between one and one or more users.
- Broadcast Packets — Displays the information about the number of good broadcast packets received. A broadcast is a connection between one to all the members that belong to a network segment.
- Packets with Errors — Displays the information about the number of packets with errors received. These packets can be unicast, multicast, or broadcast that during the transmission got corrupted or dropped.
The Transmit Statistics area displays the following information for the chosen interface:
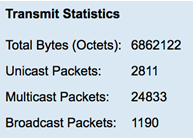
- Total Bytes (Octets) — Displays the number of octets transmitted, which includes the number of bad packets and the FCS octets.
- Unicast Packets — Displays the information about the number of good unicast packets transmitted.
- Multicast Packets — Displays the information about the number of good multicast packets transmitted.
- Broadcast Packets — Displays the information about the number of good broadcast packets transmitted.
Step 4. (Optional) Click Clear Interface Counters to clear the counters of the chosen interface.

Step 5. (Optional) Click Refresh to refresh the statistics page.

You should now have successfully managed the statistics of an interface on your switch.
View Statistics of All Interfaces
Step 1. In the Interface page, click View All Interfaces Statistics to see all ports in table view.
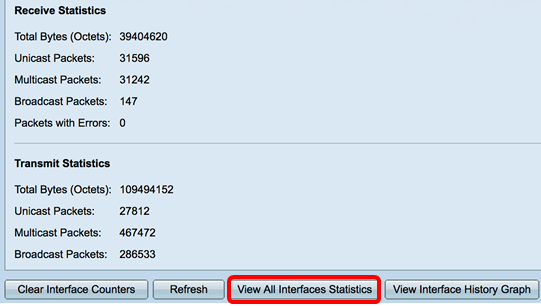
Step 2. (Optional) Choose a refresh rate from Refresh Rate drop-down list. This is the time period that passes before the interface statistics are refreshed.

Note: In this example, 30 sec is chosen.
Step 3. Choose the interface type from the Interface Type drop-down list.

Note: In this example, Port of Unit 2 is chosen.
Step 4. Click Go.

The Interface Statistics Table will display the statistics of all the ports of the chosen switch.

Step 5. (Optional) Click Clear All Interface Counters to clear the counters of the chosen interface.

Step 6. (Optional) Click Refresh to refresh the statistics page.

You should now have successfully viewed the statistics of all the ports of your switch.
Graphic RMON Statistics View of an Interface
Note: This feature is only available to Sx250, Sx350, SG350X, and Sx550X Series switches.
Step 1. In the Interface page, click the View Interface History Graph button to display these results in graphic form.
Step 2. In the Interface area, choose the interface for which the Ethernet statistics are to be displayed.
Note: In this example, Port GE4 of Unit 2 is chosen.

Note: If you have a non-stackable switch such as Sx250 Series switch, the options are Port and LAG only.

Step 3. (Optional) Check the Receive Statistics check boxes that you want to be displayed.
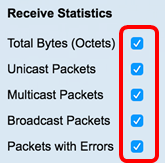
Note: In this example, all check boxes are checked.
Step 4. (Optional) Check the Transmit Statistics check boxes that you want to be displayed.
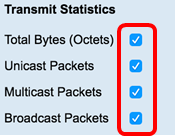
Note: In this example, all check boxes are checked.
Step 5. (Optional) From the Time Span area, click the time span of the interface statistics that you want to view.

Note: In this example, Last Hour is chosen.
The Packets chart should display the statistics of the chosen interface and packets on your switch.
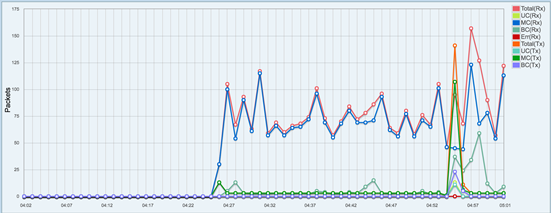
You should now have successfully viewed the graphic statistics of an interface on your switch.
Note: If you figured that an interface has problems upon viewing the statistics, you can perform a diagnostic test on the cable that is plugged in to that interface to see its status. To learn how, click here.
Revision History
| Revision | Publish Date | Comments |
|---|---|---|
1.0 |
13-Dec-2018 |
Initial Release |
 Feedback