Manage Remote Network Monitoring (RMON) Statistics on a Switch
Available Languages
Objective
Remote Network Monitoring (RMON) was developed by the Internet Engineering Task Force (IETF) to support monitoring and protocol analysis of Local Area Networks (LANs). It is a standard monitoring specification which enables different network monitors and console systems to exchange their network-monitoring data with each other. RMON facilitates network administrators to choose among the network-monitoring probes and consoles with features that meet their particular networking needs. RMON specifically defines the information that any network monitoring system should be able to provide. Statistics, events, history, alarms, hosts, hosts top N, matrix, filter, capture, and token ring are the ten groups in RMON.
The RMON Statistics page of the switch displays detailed information regarding packet sizes and information regarding physical layer errors. The information is displayed according to the RMON standard. An oversized packet is defined as an Ethernet frame with the following criteria:
- Packet length is greater than Maximum Receive Unit (MRU) byte size.
- Collision event has not been detected.
- Late collision event has not been detected.
- Received (Rx) error event has not been detected.
- Packet has a valid Cyclic Redundancy Check (CRC).
This article provides instructions on how to manage RMON statistics on your switch.
Applicable Devices
- Sx250 Series
- Sx300 Series
- Sx350 Series
- SG350X Series
- Sx500 Series
- Sx550X Series
Software Version
- 1.4.7.05 — Sx300, Sx500
- 2.2.8.04 — Sx250, Sx350, SG350X, Sx550X
Manage RMON Statistics on your Switch
Manage RMON Statistics of an Interface
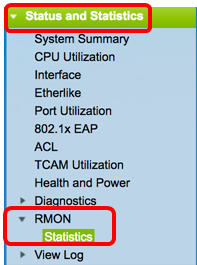
Step 1. Log in to the web-based utility of your switch then choose Status and Statics >RMON > Statistics.
Note: In this example, SG350X-48MP switch is used.
Step 2. In the Interface area, choose the interface for which the Ethernet statistics are to be displayed.
Note: In this example, Port GE2 of Unit 1 is chosen.

Note: If you have a non-stackable switch such as Sx250 or Sx300 Series switch, the options are Port and LAG only.

Step 3. Click a refresh rate from the Refresh Rate area. This is the time period that passes before the interface statistics are refreshed.

Note: In this example, 60 sec is chosen.
The following statistics are displayed for the chosen interface:
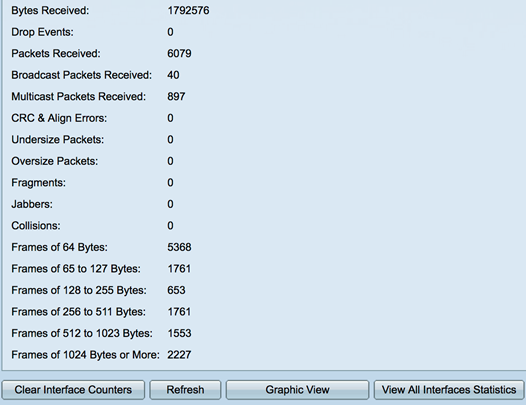
- Bytes Received — Octets received, including bad packets and FCS octets, but excluding framing bits.
- Drop Events — Packets dropped.
- Packets Received — Good packets received, including Multicast and Broadcast packets.
- Broadcast Packets Received — Good Broadcast packets received. This number does not include Multicast packets.
- Multicast Packets Received — Good Multicast packets received.
- CRC & Align Errors — CRC and Align errors that have occurred.
- Undersize Packets — Undersized packets (less than 64 octets) received.
- Oversize Packets — Oversized packets (over 2000 octets) received.
- Fragments — The fragments or packets with less than 64 octets, excluding framing bits, but including Frame Check Sequence (FCS) octets received.
- Jabbers — Received packets that longer than 1632 octets. This number excludes frame bits, but includes FCS octets that had either a bad FCS with an integral number of octets (FCS Error) or a bad FCS with a non-integral octet (Alignment Error) number. A Jabber packet is defined as an Ethernet frame that satisfies the following criteria:
- Packet data length is greater than MRU.
- Packet has an invalid CRC.
- Received (Rx) Error Event has not been detected.
- Collisions — The collisions received. If Jumbo frames are enabled, the threshold of Jabber frames is raised to the maximum size of Jumbo frames.
- Frames of 64 Bytes — Frames, containing 64 bytes that were sent or received.
- Frames of 65 to 127 Bytes — Frames, containing 65-127 bytes that were sent or received.
- Frames of 128 to 255 Bytes — Frames, containing 128-255 bytes that were sent or received.
- Frames of 256 to 511 Bytes — Frames, containing 256-511 bytes that were sent or received.
- Frames of 512 to 1023 Bytes — Frames, containing 512-1023 bytes that were sent or received.
- Frames of 1024 Bytes or More — Frames, containing 1024-2000 bytes, and Jumbo Frames, that were sent or received.
Step 4. (Optional) Click Clear Interface Counters to clear the counters of the chosen interface.

Step 5. (Optional) Click OK to clear the interface statistics.

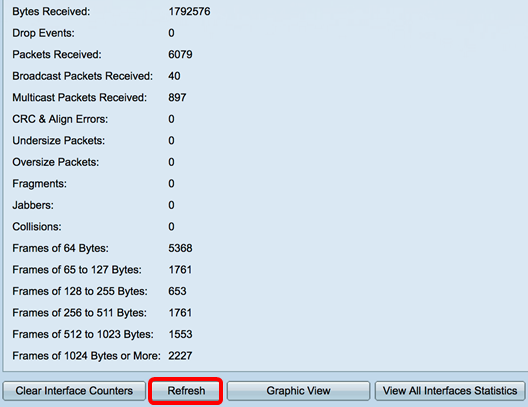
Step 6. (Optional) Click Refresh to refresh the statistics page.
You should now have successfully managed the RMON statistics of an interface on your switch.
View RMON Statistics of All Interfaces
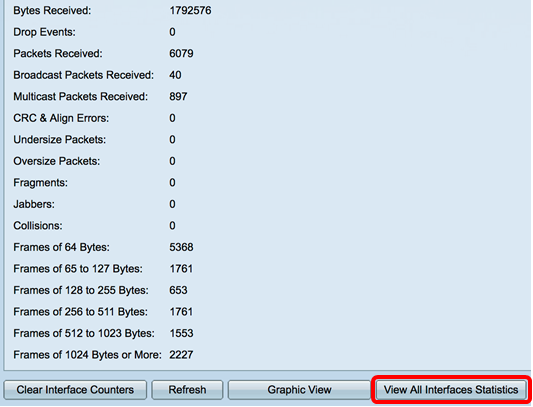
Step 1. In the Statistics page, click View All Interfaces Statistics to see all ports in table view.
Step 2. (Optional) Choose a refresh rate from the Refresh Rate drop-down list. This is the time period that passes before the interface statistics are refreshed.
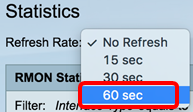
Note: In this example, 60 sec is chosen.
Step 3. Choose the interface type from the Interface Type drop-down list then click Go.

Note: In this example, Port of Unit 1 is chosen.
The RMON Statistics Table will display the statistics of all the ports of the chosen switch.

Step 4. (Optional) Click Clear Interface Counters to clear the counters of the chosen interface.

Step 5. (Optional) Click Refresh to refresh the statistics page.

You should now have successfully viewed the RMON statistics of all the ports of your switch.
Graphic RMON Statistics View of an Interface
Note: This feature is not available to Sx300 and Sx500 Series switches.
Step 1. In the Statistics page, click Graphic View button to display these results in graphic form.
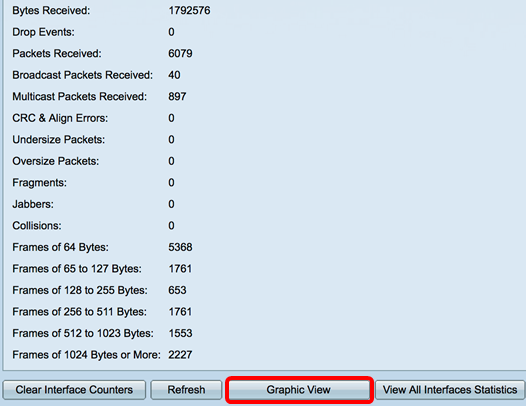
Step 2. In the Interface area, choose the interface for which the Ethernet statistics are to be displayed.
Note: In this example, Port GE2 of Unit 1 is chosen.

Note: If you have a non-stackable switch such as Sx250 Series switch, the options are Port and LAG only.

Step 3. (Optional) Check the frames sizes that you want to be displayed.
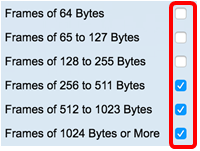
Note: In this example, Frames of 256 to 511 Bytes, Frames of 512 to 1023 Bytes, and Frames of 1024 to 1023 Bytes or More are chosen.
Step 4. (Optional) From the Time Span area, click the time span of the RMON statistics that you want to view.

Note: In this example, Last Hour is chosen.
The chart should display the RMON statistics of the chosen interface and frames of your switch.
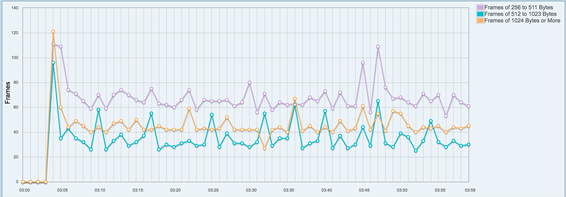
You should now have successfully viewed the graphic RMON statistics of an interface on your switch.
Revision History
| Revision | Publish Date | Comments |
|---|---|---|
1.0 |
13-Dec-2018 |
Initial Release |
 Feedback