Introduction
This document describes the procedure to troubleshoot "502" errors when users log in to the Cisco Telemetry Broker (CTB) Web User Interface (UI).
Prerequisites
- Basic Cisco Telemetry Broker knowledge
Procedure
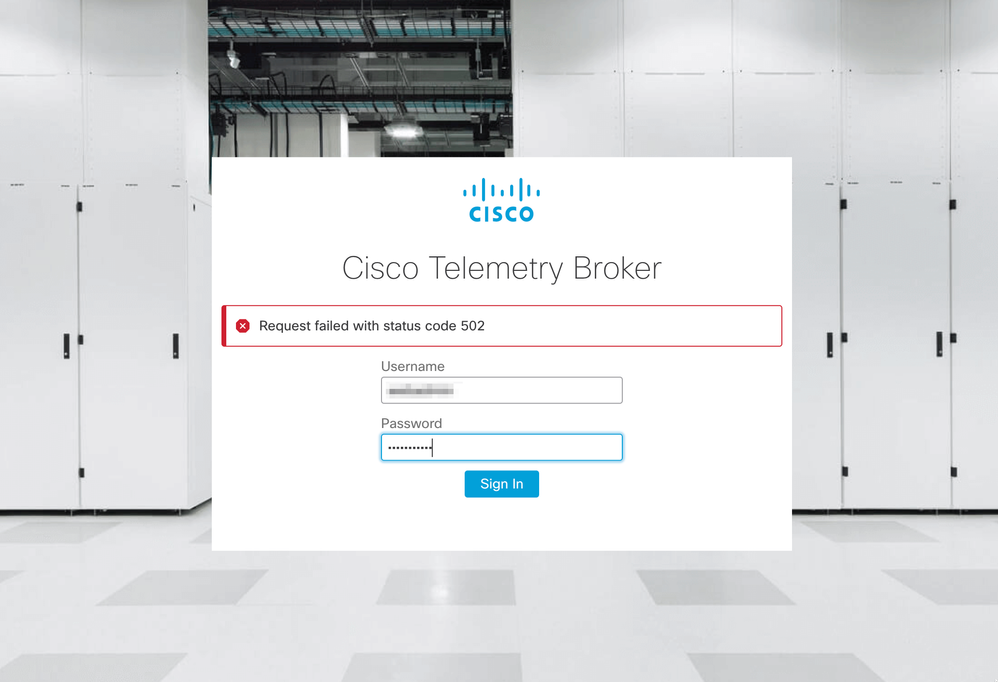
There are some times when users are no longer able to log in to the CTB Manager Web UI right after a software update was completed. The web UI displays a Request failed with status code 502 error:

This happens when the telegraf service has errors. To confirm this is your case, proceed as follows:
- Log in to the CTB Manager Node with admin credentials via SSH.
- Run the sudo su command and enter the password for admin to gain full access as root.
- Once you have root access, review the latest logs of the telegraf-collector and the titanium-frontend container services. To do so, run these 2 commands:
- docker logs -f telegraf-collector
- docker logs -f titanium-frontend
- From the telegraf-collector logs these errors are displayed:
root@mexsna-ctb-mgr-node:/home/admin# docker logs -f telegraf-collector
Running as collector
2022-12-16T23:10:11Z I! Starting Telegraf 1.19.1-titan
2022-12-16T23:10:11Z I! Loaded inputs: disk mem system
2022-12-16T23:10:11Z I! Loaded aggregators:
2022-12-16T23:10:11Z I! Loaded processors:
2022-12-16T23:10:11Z I! Loaded outputs: http
2022-12-16T23:10:11Z I! Tags enabled:
2022-12-16T23:10:11Z I! [agent] Config: Interval:1m0s, Quiet:false, Hostname:"", Flush Interval:10s
2022-12-16T23:11:02Z E! [agent] Error writing to outputs.http: when writing to [http://localhost/telegraf] received status code: 500
2022-12-16T23:11:17Z E! [agent] Error writing to outputs.http: when writing to [http://localhost/telegraf] received status code: 500
2022-12-16T23:11:31Z E! [agent] Error writing to outputs.http: when writing to [http://localhost/telegraf] received status code: 500
- From the titanium-frontend logs the auth request unexpected status: 502 while sending to client and connection refused errors are displayed:
root@mexsna-ctb-mgr-node:/home/admin# docker logs -f titanium-frontend
2022/12/16 23:10:13 [error] 15#15: *4 auth request unexpected status: 502 while sending to client, client: 10.64.0.66, server: , request: "POST /telegraf HTTP/1.0", host: "10.64.0.65"
2022/12/16 23:10:20 [error] 15#15: *8 auth request unexpected status: 502 while sending to client, client: 10.64.0.67, server: , request: "POST /telegraf HTTP/1.0", host: "10.64.0.65"
2022/12/16 23:10:21 [error] 15#15: *10 connect() failed (111: Connection refused) while connecting to upstream, client: 169.254.64.10, server: , request: "GET /api-v1/node-manager HTTP/1.0", upstream: "http://169.254.64.8:8000/api-v1/node-manager", host: "
2022/12/16 23:10:23 [error] 15#15: *12 connect() failed (111: Connection refused) while connecting to upstream, client: 10.64.0.67, server: , request: "GET /api-v1/node-manager/config-v2 HTTP/1.0", upstream: "http://169.254.64.8:8000/api-v1/node-manager/config-v2", host: "10.64.0.65"
2022/12/16 23:10:26 [error] 15#15: *14 connect() failed (111: Connection refused) while connecting to upstream, client: 169.254.64.10, server: , request: "GET /api-v1/node-manager HTTP/1.0", upstream: "http://169.254.64.8:8000/api-v1/node-manager", host: "titanium-frontend:8080"
2022/12/16 23:10:28 [error] 15#15: *16 connect() failed (111: Connection refused) while connecting to upstream, client: 10.64.0.66, server: , request: "POST /telegraf HTTP/1.0", subrequest: "/api-v1/node-manager/auth", upstream: "http://169.254.64.8:8000/api-v1/node-manager/auth", host: "10.64.0.65"
2022/12/16 23:11:02 [error] 15#15: *54 auth request unexpected status: 502 while sending to client, client: 169.254.64.10, server: , request: "POST /telegraf HTTP/1.0", host: "titanium-frontend:8080"
This behavior can occur if the utilization of the /var/lib/titan partition on the CTB Manager is almost full (above 90%). Run the df -h command to check the disk utilization:
root@mexsna-ctb-mgr-node:/home/admin# df -h

Filesystem      Size  Used Avail Use% Mounted on
udev            3.9G     0  3.9G   0% /dev
tmpfs           798M  1.4M  797M   1% /run
/dev/sda4        15G  3.6G   11G  26% /
tmpfs           3.9G     0  3.9G   0% /dev/shm
tmpfs           5.0M     0  5.0M   0% /run/lock
tmpfs           3.9G     0  3.9G   0% /sys/fs/cgroup
/dev/sda2       227M  146M   65M  70% /boot
/dev/sda6        49G   45G  1.5G  97% /var/lib/titan
/dev/sda5        15G  3.6G   11G  26% /mnt/alt_root
The solution to this behavior is to expand the disk size of the CTB Manager. To accomplish this, perform the Expand Cisco Telemetry Broker Manager and Broker Node Disk Size procedure described in the Cisco Telemetry Broker v1.3.1 User Guide.
Once more disk space has been allocated and you have confirmed that the utilization of the /var/lib/titan partition is no longer more than 90%, the CTB Manager Web UI is accessible again.
Note: Based on the different experienced behaviors, it can take up to 4 hours for the CTB Manager Web UI to be accessible again once more disk space has been allocated.
Related Information


 Feedback