Introduction
This document describes how to investigate multiple possible causes of a Secure Cloud Analytics (SCA) Sensor to appear as offline.
Background Information
Secure Cloud Analytics (SCA) was formerly called Stealthwatch Cloud (SWC) and these terms can be used interchangeably.
The SCA Sensor is the Private Network Monitor and can be referenced as ONA, ONA Sensor or simply just as Sensor.
The commands in this article are based off of the ona-20.04.1-server-amd64.iso debian installation.
Possible Causes of Offline Sensors
There are many possible factors that can result in a sensor to present an offline status.
Two examples of these factors are Network related issues, and the local file system has a full disk.
Identify an offline sensor
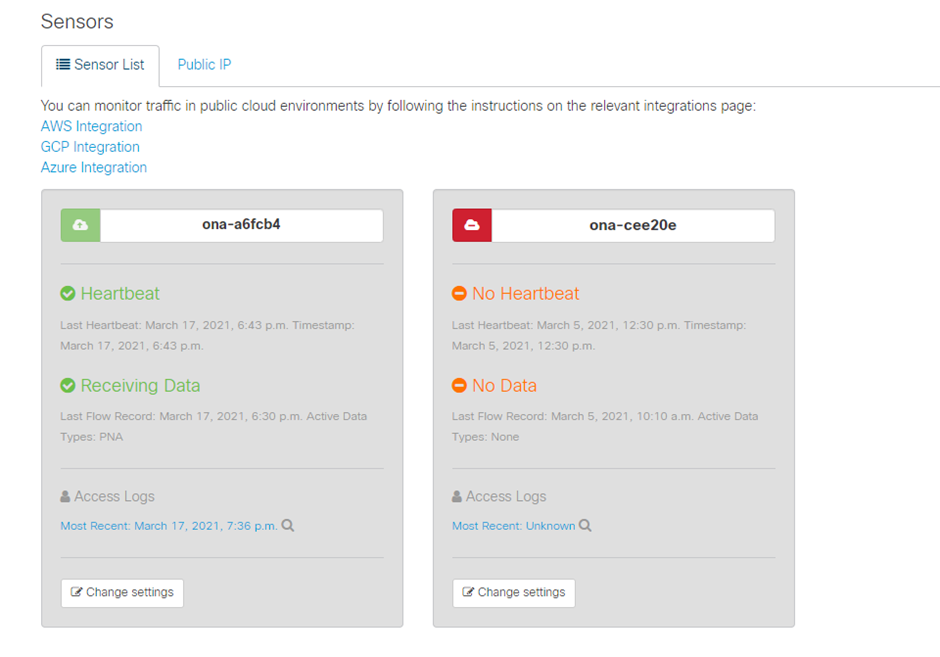
The SCA Portal contains a list of configured sensors. To access this page navigate to Settings > Sensors.
The offline sensor in this image is represented in red and shows no recent Heartbeat and Data.

Investigate an Offline Sensor
Network Issues
The ONA host can lose Internet access, which results in the Sensor to be listed as offline.
Test if the ONA Host is able to ping a known alive IP address such as one of the Google DNS servers at 8.8.8.8.
Log in to the ONA sensor and run the ping -c4 8.8.8.8 command.
user@example-ona:~# ping -c4 8.8.8.8
PING 8.8.8.8 (8.8.8.8) 56(84) bytes of data.
From 10.10.10.11 icmp_seq=1 Destination Host Unreachable
From 10.10.10.11 icmp_seq=2 Destination Host Unreachable
From 10.10.10.11 icmp_seq=3 Destination Host Unreachable
From 10.10.10.11 icmp_seq=4 Destination Host Unreachable

--- 8.8.8.8 ping statistics ---
4 packets transmitted, 0 received, 100% packet loss, time 3065ms
user@example-ona:~#
If the Sensor is unable to ping a known alive IP address, investigate further.
Determine the default gateway with the route -n command.
Determine if there is a valid Address Resolution Protocol (ARP) entry seen for the default gateway with the arp -an command.
If the Sensor is able to ping a known IP address then test DNS host name resolution and the ability to of the sensor to connect to the cloud.
Log into the Sensor and run the sudo curl https://sensor.ext.obsrvbl.com command.
The curl command output shows that DNS resolution for sensor.ext.obsrvbl.com failed and investigation into DNS is warranted.
user@example-ona:~# sudo curl https://sensor.ext.obsrvbl.com
[sudo] password for user:
curl: (6) Could not resolve host: sensor.ext.obsrvbl.com
user@example-ona:~#
This type of a response indicates a good connection and also that the cloud portal recognizes the sensor.
This type of response indicates a good connection but the sensor has not been associated with a particular domain.
user@example-ona:~# sudo curl https://sensor.anz-prod.obsrvbl.com
[sudo] password for user:
{"error":"unknown identity","identity":"240.0.0.0"}
user@example-ona:~#
DNS Problems
If Sensor is not able to resolve host names with DNS then verify the DNS settings with the cat /etc/netplan/01-netcfg.yaml command.
if DNS settings require changes refer to the Update the DNS Configuration section.
Once the DNS settings are validated run the sudo systemctl restart systemd-resolved.service command.
No output is expected with this command.
user@example-ona:~# sudo systemctl restart systemd-resolved.service
[sudo] password for user:
user@example-ona:~#
Update the DNS Configuration
To update DNS servers in Netplan, you can modify the Netplan configuration file for your network interface.
Netplan configuration files are stored in the /etc/netplan directory.

Tip: One or two YAML files can be found in this directory. The expected file names are 01-netcfg.yaml and/or 50-cloud-init.yaml.
Open the Netplan configuration file with the sudo vi /etc/netplan/01-netcfg.yaml command.
In the Netplan configuration file, locate the "nameservers" key under the network interface.
You can specify multiple DNS Server IP addresses separated with commas.
Apply the changes to the Netplan configuration with the sudo netplan apply command.
Netplan generates the configuration files for the systemd-resolved service.
To verify that the new DNS resolvers are set, run the resolvectl status | grep -A2 'DNS Servers' command.
user@example-ona:~# resolvectl status | grep -A2 'DNS Servers'
 DNS Servers: 10.122.147.56
 DNS Domain: example.org

user@example-ona:~#
Local File System Full
A common error message can appear on the console of the Sensor: "Failed to create new system journal: No space left on device."
This indicates that the disk is full, and no more space is left in the / root file system.
Run the df -ah / command and determine how much space is available.
user@example-ona:~# df -ah /
Filesystem Size Used Avail Use% Mounted on
/dev/mapper/vgona--default-root 30G 30G 0G 100% /
user@example-ona:~#
Clear old journal logs to free up disk space with the journalctl --vacuum-time 1d command.
user@example-ona:~# journalctl --vacuum-time 1d
Vacuuming done, freed 0B of archived journals from /var/log/journal.
{Removed for brevity}
Vacuuming done, freed 2.9G of archived journals from /var/log/journal/315bfec86e0947b2a3a23da2a672e577.
Vacuuming done, freed 0B of archived journals from /run/log/journal.
user@example-ona:~#
Ensure that your Storage Space meets the minimum system requirements outlined in the Initial Deployment guide.
The guide can be retrieved from the Cisco Secure Cloud Analytics (Stealthwatch Cloud) product support page: https://www.cisco.com/c/en/us/support/security/stealthwatch-cloud/series.html
Monitoring Configuration
A Sensor that has good network connectivity to the cloud and valid DNS settings can still present an offline status.
An offline status is possible if the Sensor monitoring options are disabled or the Sensor does not send heartbeats.

Note: This section is for a default installation of the ONA Sensor with no customizations and actively receives netflow and/or IPFIX data.
Run the grep PNA_SERVICE /opt/obsrvbl-ona/config command to determine the status.
user@example-ona:~# grep PNA_SERVICE /opt/obsrvbl-ona/config
OBSRVBL_PNA_SERVICE="false"
user@example-ona:~#
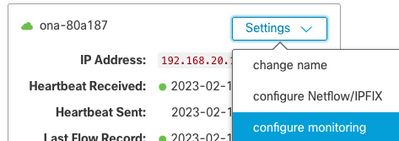
If the service is set to false, verify that the desired networks are listed in Settings > configure monitoring for your Sensor in the SCA Portal.

Run the ps -fu obsrvbl_ona | grep pna command and the note if the service is seen and if the expected monitored network ranges are listed.
user@example-ona:~# ps -fu obsrvbl_ona | grep pna
obsrvbl+ 925 763 0 Feb09 ? 00:29:04 /usr/bin/python3 /opt/obsrvbl-ona/ona_service/pna_pusher.py
obsrvbl+ 956 920 0 Feb09 ? 00:24:00 /opt/obsrvbl-ona/pna/user/pna -i ens192 -N 10.0.0.0/8 172.16.0.0/12 192.168.0.0/16 -o /opt/obsrvbl-ona/logs/pna -Z obsrvbl_ona (net 10.0.0.0/8) or (net 172.16.0.0/12) or (net 192.168.0.0/16)
obsrvbl+ 957 921 0 Feb09 ? 00:00:00 /opt/obsrvbl-ona/pna/user/pna -i ens224 -N 10.0.0.0/8 172.16.0.0/12 192.168.0.0/16 -o /opt/obsrvbl-ona/logs/pna -Z obsrvbl_ona (net 10.0.0.0/8) or (net 172.16.0.0/12) or (net 192.168.0.0/16)
user@example-ona:~#
The output of the command shows that the PNA service has process ID 956 and 957, and the private address ranges 10.0.0.0/8, 172.16.0.0/12, and 192.168.0.0/16 are monitored on the ens192 and ens224 interfaces.

Note: The address ranges and interface names can differ based on configuration and deployment of the Sensor
SSL Errors
Review the /opt/obsrvbl-ona/logs/ona_service/ona-pna-pusher.log file for SSL errors with the less /opt/obsrvbl-ona/logs/ona_service/ona-pna-pusher.log command.
An example error is provided.
(Caused by SSLError(SSLCertVerificationError(1, '[SSL: CERTIFICATE_VERIFY_FAILED] certificate verify failed: unable to get local issuer certificate (_ssl.c:1131)'))).
Run the wget https://s3.amazonaws.com command and review the output to see if there is any possible HTTPS inspection.
If there is HTTPS inspection, ensure that the Sensor is removed from any inspection or placed on an allowed list.


 Feedback