Introduction
This document describes the ELK Stack components built-in Cisco Identity Services Engine (ISE) 3.3 through System 360 Log Analytics.
Prerequisites
Requirements
Cisco recommends that you have knowledge of these topics:
Components Used
The information in this document is based on Cisco ISE 3.3.
The information in this document was created from the devices in a specific lab environment. All of the devices used in this document started with a cleared (default) configuration. If your network is live, ensure that you understand the potential impact of any command.
Background Information
System 360 includes Monitoring and Log Analytics.
The Monitoring feature enables you to monitor a wide range of application and system statistics, and the key performance indicators (KPI) of all the nodes in a deployment from a centralized console. KPIs are useful to gain insight into the overall health of the node environment. Statistics offer a simplified representation of the system configurations and utilization-specific data.
Log Analytics provides a flexible analytics system for in-depth analysis of endpoint authentication, authorization, and accounting (AAA), and profiling syslog data. You can also analyze the Cisco ISE health summary and process statuses. You can generate reports that are similar to the Cisco ISE Counters and Health Summary report.
ELK Stack
The ELK Stack is a popular open-source software stack used for collecting, processing, and visualizing large volumes of data. It stands for Elasticsearch, Logstash, and Kibana.
-
Elasticsearch: Elasticsearch is a distributed search and analytics engine. It is designed to store, search, and analyze large volumes of data quickly and in near real-time. It uses a JSON-based query language and is highly scalable.
-
Logstash: Logstash is a data processing pipeline that ingests, processes, and transforms data from multiple sources. It can parse and enrich data, making it more structured and suitable for analysis. Logstash supports a wide range of input sources and output destinations.
-
Kibana: Kibana is a data visualization platform that works with Elasticsearch. It allows users to create interactive dashboards, charts, graphs, and visualizations to explore and understand data stored in Elasticsearch. The interface of Kibana makes it easy to query and visualize data.
When combined, these components form a powerful stack for managing and analyzing diverse types of data, from log files to metrics and more, while providing visualization capabilities to make sense of the information.
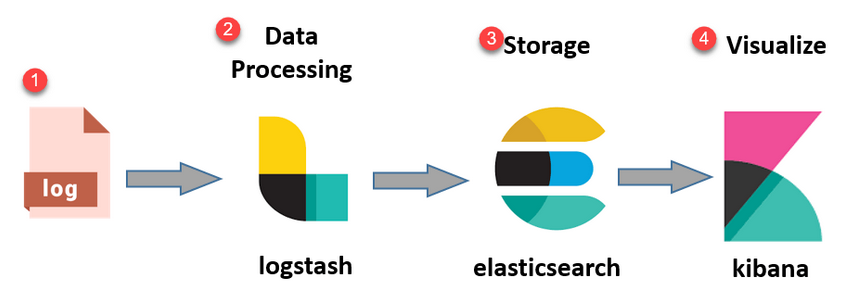 ELK Stack flow
ELK Stack as Log Analytics
- A separate instance of ElasticSearch+LogStash+Kibana stack is running on MnT nodes only.
- This does not have any correlation with the Elasticsearch of Context-Visibility.
- Running ELK 7.17
- Primary and Secondary MNTs have their own separate instances of ELK.
- Kibana is enabled only on secondary MNT if it is available, displaying data only from this node.
- Log Analytics is disabled by default.
- Consumes Oracle resources.
- Stores max 7 days of data.
- The total size of data consumed by Log Analytics is restricted to 10GB.
- Once any of the limits are reached, ElasticSearch purges the data out.
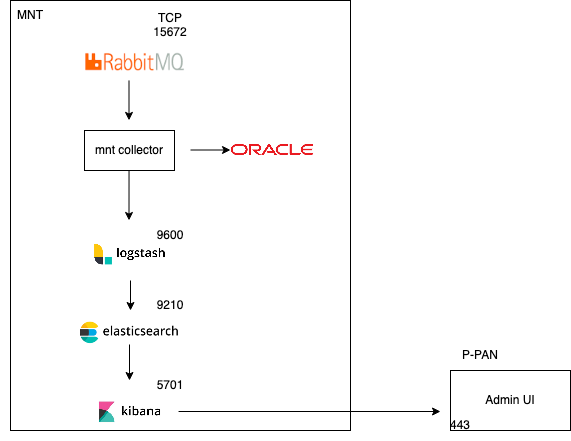 ELK flow as Log Analytics
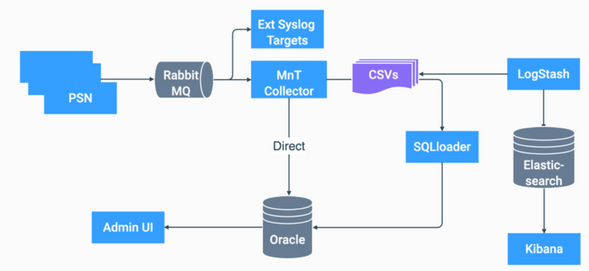 Flowchart of ELK in ISE
Enable Log Analytics
Log analytics is disabled by default on ISE. To enable it, navigate to Operations > System 360 > Settings as shown in the image.
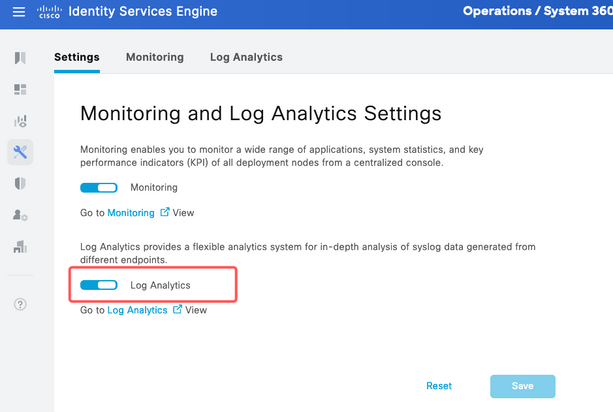 Enable log analytics
ISE takes about a minute to initialize the ELK stack, you can check the status using show app stat ise.
Additionally, you can check the container status from the root.
admin#show application status ise

ISE PROCESS NAME STATE PROCESS ID
--------------------------------------------------------------------
Database Listener running 7708
Database Server running 132 PROCESSES
Application Server running 551493
Profiler Database running 14281
ISE Indexing Engine running 553168
AD Connector running 41413
M&T Session Database running 26017
M&T Log Processor running 33547
Certificate Authority Service running 41230
EST Service running 659568
SXP Engine Service disabled
TC-NAC Service disabled
PassiveID WMI Service disabled
PassiveID Syslog Service disabled
PassiveID API Service disabled
PassiveID Agent Service disabled
PassiveID Endpoint Service disabled
PassiveID SPAN Service disabled
DHCP Server (dhcpd) disabled
DNS Server (named) disabled
ISE Messaging Service running 10937
ISE API Gateway Database Service running 13294
ISE API Gateway Service running 586762
ISE pxGrid Direct Service running 637606
Segmentation Policy Service disabled
REST Auth Service disabled
SSE Connector disabled
Hermes (pxGrid Cloud Agent) disabled
McTrust (Meraki Sync Service) disabled
ISE Node Exporter running 44422
ISE Prometheus Service running 47890
ISE Grafana Service running 51094
ISE MNT LogAnalytics Elasticsearch running 611684
ISE Logstash Service running 614339
ISE Kibana Service running 616064
ISE Native IPSec Service running 75883
MFC Profiler running 651910
Navigation Menu
Once ELK services start, you have access to the Elastic navigation menu.
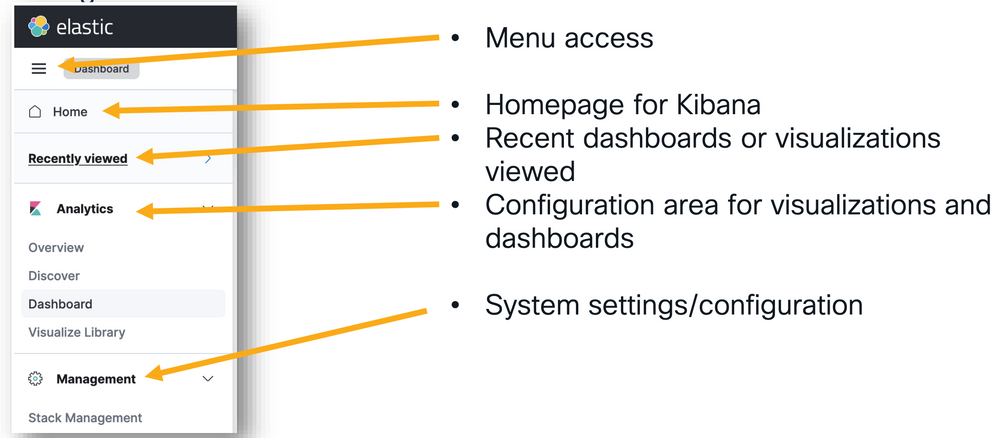 Navigation menu
Built-in Dashboards
- ISE by default has built-in dashboards with data from Radius, TACACS, system performance and ISE observability.
- These dashboards can be accessed by navigating to
Operations > Log Analytics .
- Once Elastic UI is open, click on
Sandwich Menu > Analytics > Dashboards .
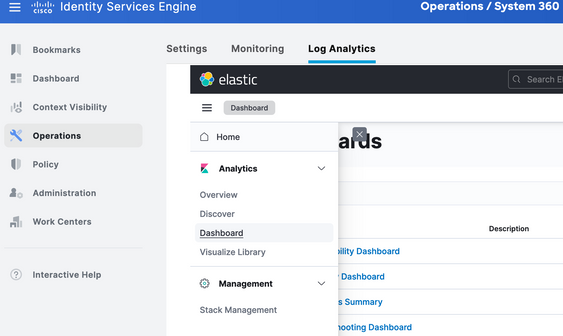 Built-in dashboards
- Available dashboards on ISE 3.3.
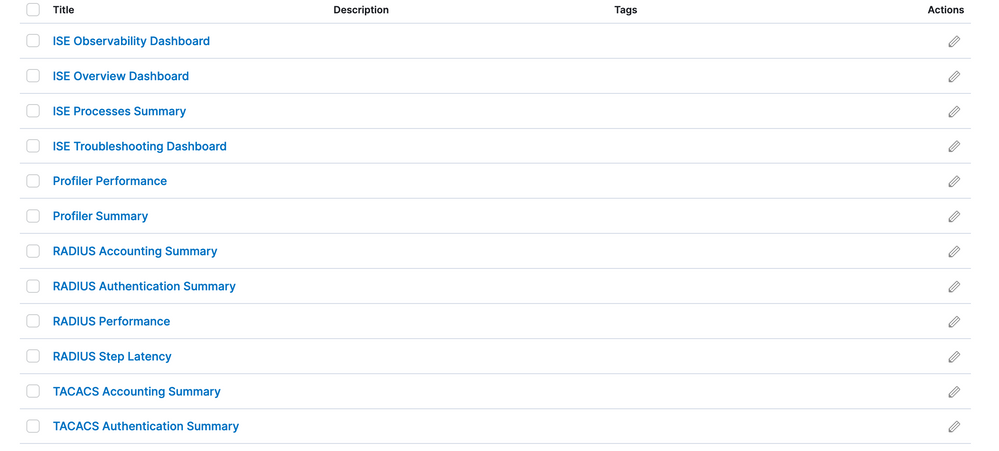 ISE 3.3 log analytics dashboards
Create New Dashboards
Step 1. Create Index Patterns (Data Source)
In Kibana, "index patterns" are configurations that allow you to define how Kibana interacts with one or more Elasticsearch indices.
Navigate to Management > Stack Management > Kibana > Index Patterns, and click Create Index Pattern as shown in the image.
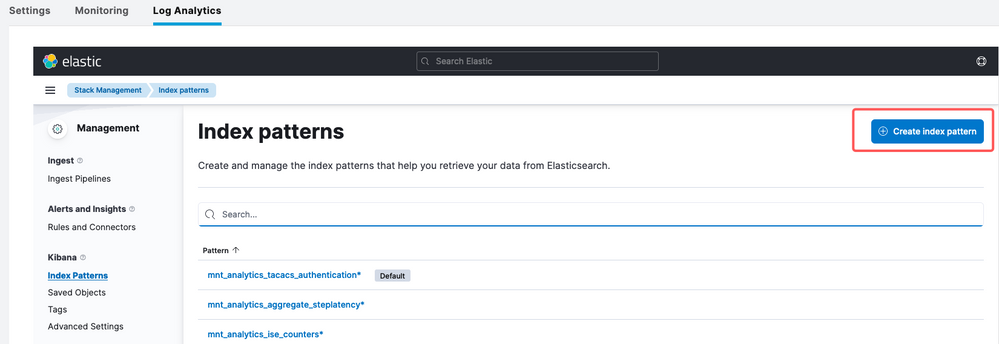 Create index pattern
The next window shows up listing all the available indexes on ISE.
- Type the name of the index you are interested in, it can be an exact match or wildcard using *.
- Select Timestamp field, logged_at, logged_at_timezone or "I don't want to use time filter".
- Then, click
Create index pattern.
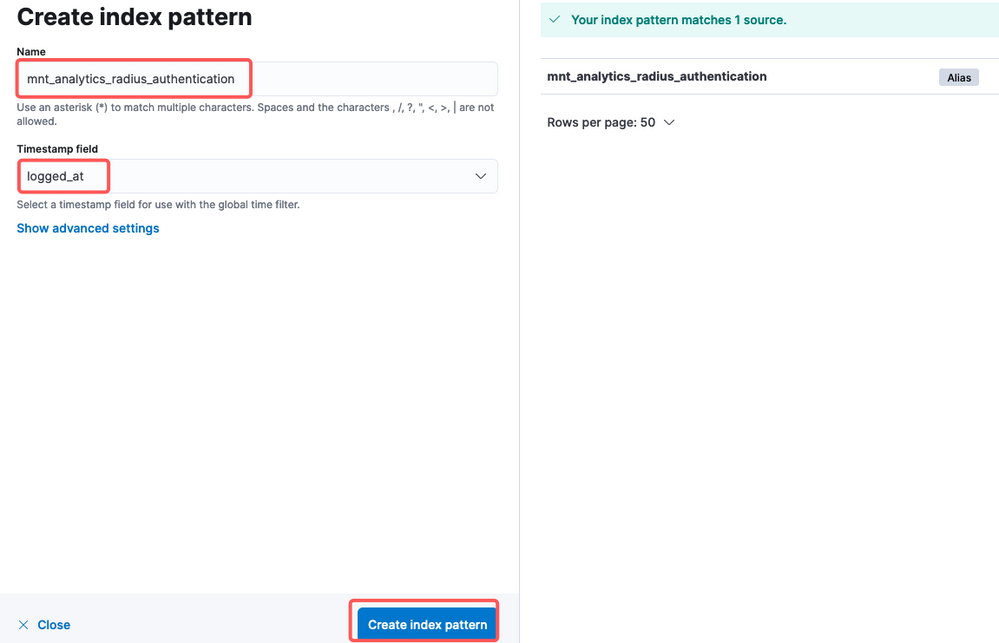 Select index
Once created, the index lists all the associated variables that can be used later to create visualizations.
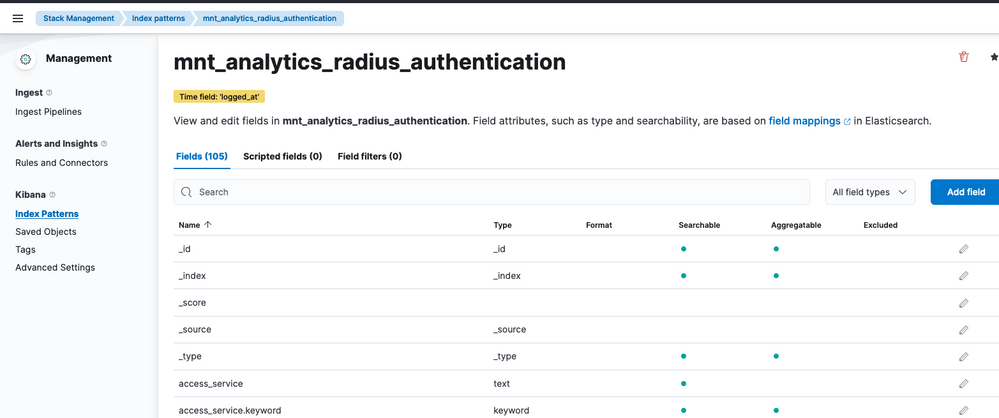 Index variables
Step 2. Create Visualizations
In Kibana, "visualizations" are graphical representations of your data. They allow you to take the data stored in Elasticsearch and turn it into meaningful charts, graphs, and diagrams for easier understanding and analysis. These are some common types of visualizations you can create:
- Lens: Creates visualization with a drag-and-drop editor. Recommended.
- Bar Charts: These show data in vertical bars, making it easy to compare values across categories or time intervals.
- Line Charts: Line charts display data as a series of data points connected by lines. They are useful for visualizing trends over time.
- Pie Charts: Pie charts represent data in a circular graph, with each segment of the pie representing a category and the size of the segment indicating its proportion.
- Area Charts: Similar to line charts, area charts also show trends over time, but they fill the area under the lines, making it easier to see the magnitude of changes.
- Heat Maps: Heat maps use colors to represent data values in a matrix or grid. They are useful for showing concentrations or variations in data.
- Metric Visualizations: These display single numeric values, such as counts or averages. They are often used to show key performance indicators (KPIs).
- Data Tables: Data tables present raw data in tabular form, allowing you to see detailed information and sort or filter the data.
- Histograms: Histograms divide data into bins or intervals and display the frequency or count of data points in each bin. They are useful for understanding data distributions.
- Coordinate Maps: These visualize geospatial data, allowing you to display data on a map and use various markers, colors, or sizes to represent data attributes.
- Tag Clouds: Tag clouds display word frequencies, with the size of each word indicating its importance or frequency in a dataset.
Navigate to Analytics > Visualize Library , then click on Create Visualization as shown in the image.
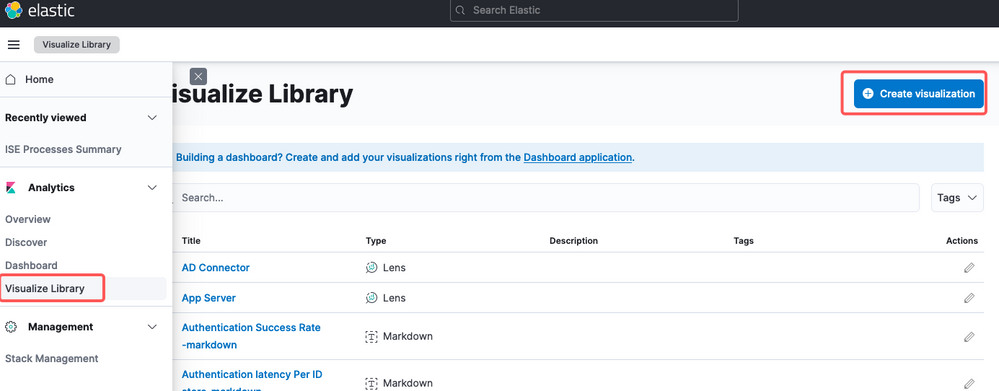 Create visualization
Select the visualization of your preference, on this example Lens is preferred for practicality.
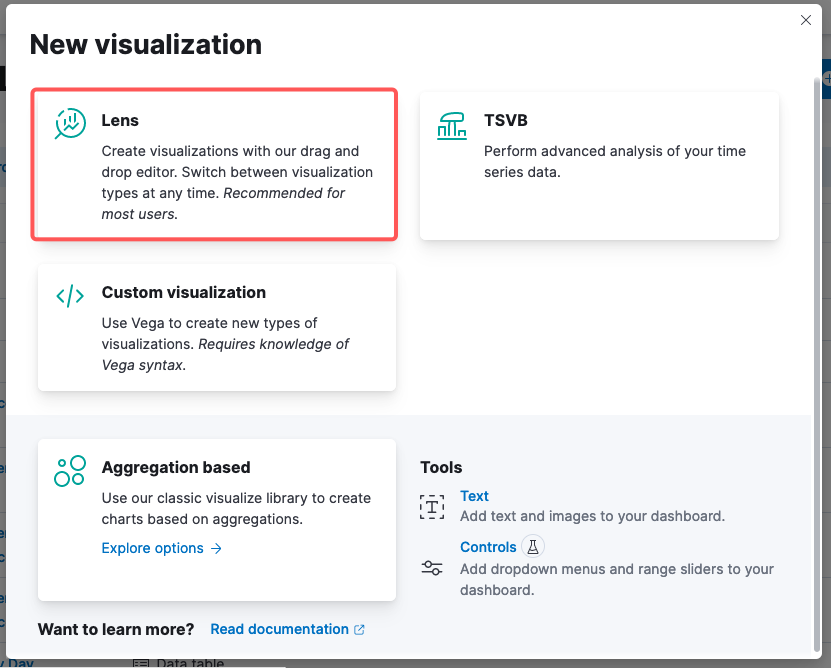 Select visualization type
Kibana Lens, navigation items consist of:
- Data Source Selection: In the left-hand panel, you can select the data source or Elasticsearch index pattern that you want to use for your visualization.
- Visualization Canvas: The central area is where you build your visualization by dragging and dropping fields, selecting chart types, and configuring chart settings.
- Visualization Toolbar: On top of the canvas, you can find a toolbar that allows you to customize your visualization, including options for changing chart types, adding filters, and configuring chart settings.
-
Data Panel: On the right-hand side, you can access the "Data" panel, which allows you to manage your data transformation, aggregation, and field settings.
- Layer Management: Depending on the type of visualization you are creating (for example, layered charts), you can have a layer management area for configuring multiple layers in your visualization.
-
Preview: As you make changes to your visualization, a real-time preview is typically provided so you can see how your chart looks with the current settings.
-
Visualization Settings: Depending on the selected chart type, you can access specific settings for that visualization type, such as axis configuration, color schemes, and labels.
-
Interactivity Settings: You can add interactions and actions to your visualization, allowing users to filter data or navigate to other parts of your Kibana dashboards.
-
Save and Share: At the top of the Lens interface, there are typically options to save your visualization, add it to a dashboard, or share it with others.
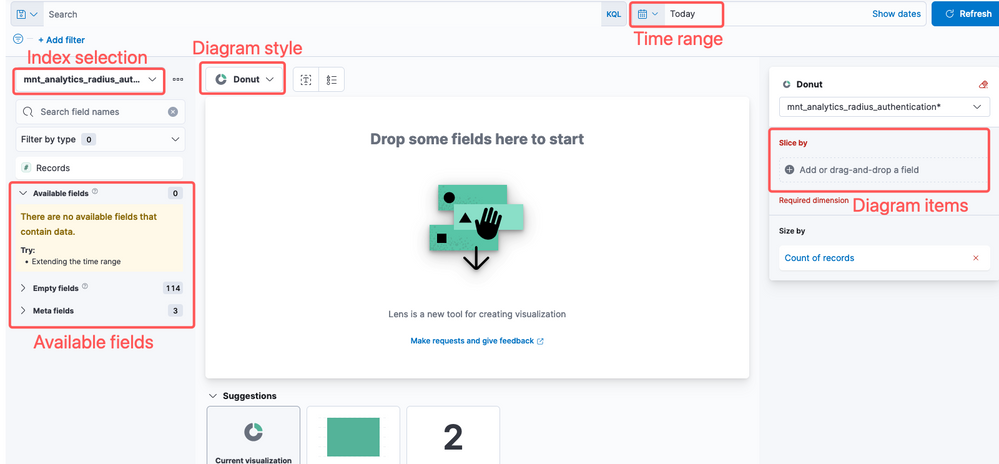 Lens visualization
Due to Cisco bug ID CSCwh48057, the left panel doesn´t show available fields to use. However, from the right side, you can select the required fields plus diagram style. In this example, since auth latency is a topic of common interest the graph is built to visualize authentication latency vs endpoint ID.
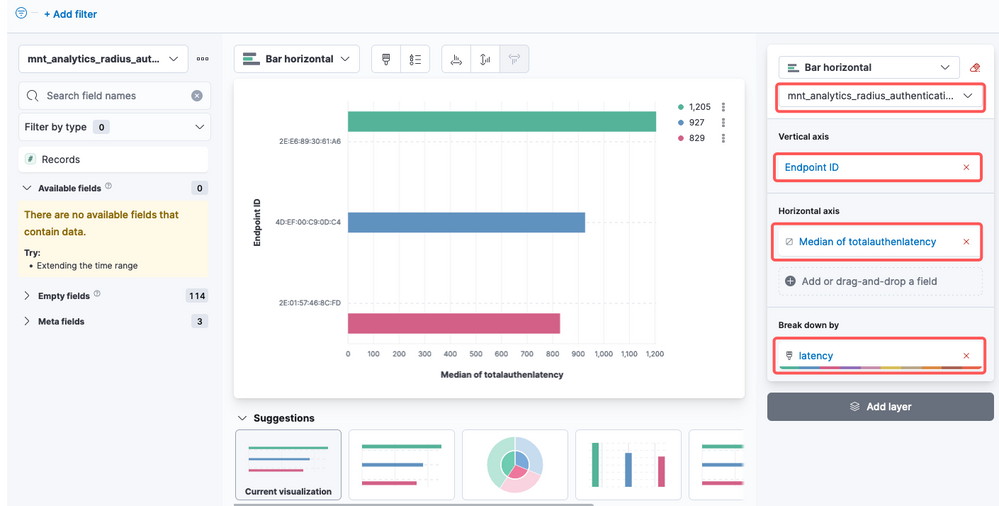 Endpoint ID vs latency
Once done, you can click the Save button on the right corner as shown in the image.
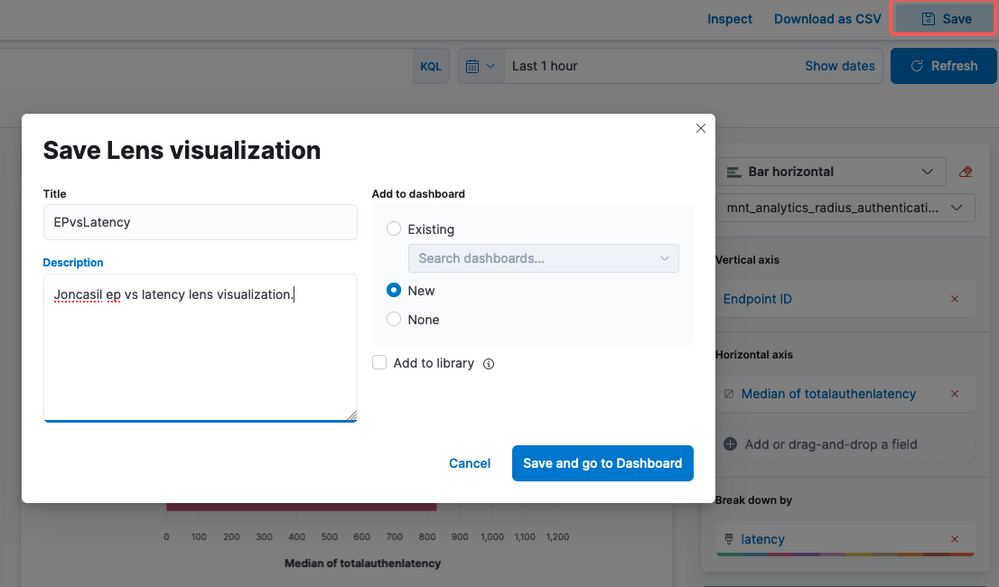 Save visualization
Step 3. Create a Dashboard
It automatically adds the new visualization into a new Dashboard. Bear in mind that Kibana Dashboards enable users to create, customize, and share interactive visualizations and reports based on data stored in Elasticsearch indices.
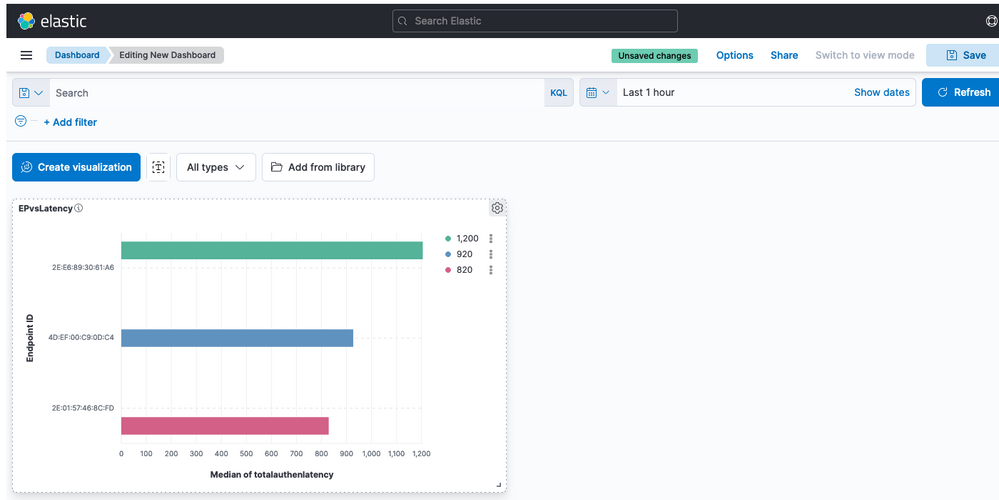 New Dashboard
Troubleshooting
- Verify the ELK stack services are running on the MNT.
- Since Kibana, Logstash, and Elasticsearch are running on containers, the logs are found at:
admin#show logging application ise-kibana/kibana.log
admin#show logging application ise-logstash/logstash.log
admin#show logging application mnt-la-elasticsearch/mnt-la-elasticsearch.log
Related Information


 Feedback