Introduction
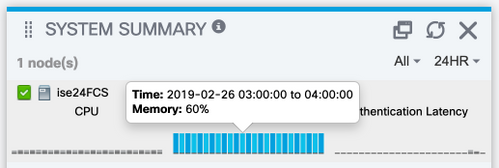
The Primary Admin GUI includes a system summary dashboard which shows CPU, Memory and Authentication Latency stats per hour over the last 24 hours.
This data is driven by syslog messages generated by each node in the deployment and delivered to the Monitoring nodes every 5 minutes.
The Monitoring nodes collect these 5 minute average resource utilization numbers which is then averaged over the hour for display in the System Summary Dashboard.

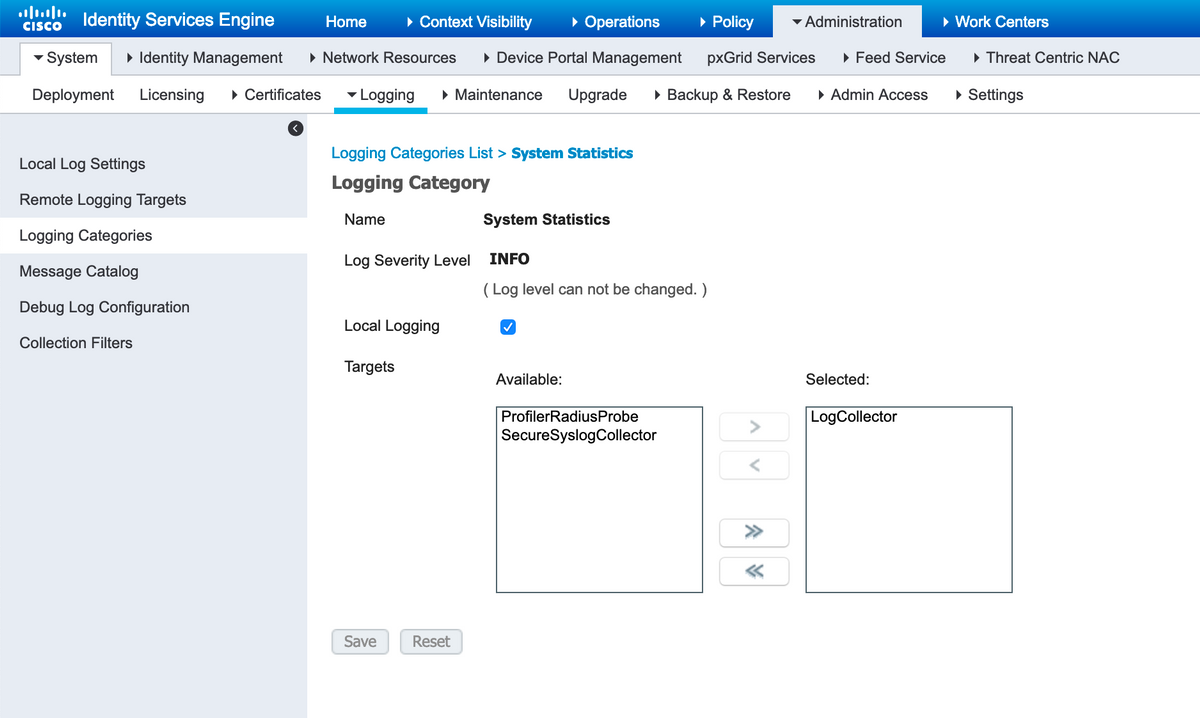
The configuration that governs this (and which will also let you send this data out to external syslog collection) is under Administration > Logging > Logging Categories > System Statistics

With the Local Logging checkbox enabled, this indicates that every node will log the Syslog locally to it's localStore/iseLocalStore.log file along with sending a copy to the monitoring nodes and any other remote logging target selected in this configuration. LogCollector is the default name for the Primary Monitoring node. If your deployment has 2 monitoring nodes you would also expect to see LogCollector2 listed as a selected target here. To check list of targets, Administration > Logging > Remote Logging Targets.
Verification and Troubleshooting:
You would expect to see every node in the deployment sending these messages out every 5 minutes and also logging it locally.
On the node you can run:
# show logging application localStore/iseLocalStore.log | i "70000 NOTICE"
To review if the node is indeed generating these syslogs.
With Collector at DEBUG on the monitoring node, you should also see these messages being collected via:
# show logging application collector.log | i "70000 NOTICE"
on the Monitoring nodes.
Provided the logging target is not ocnfigured for secure communication, a packet capture should also reveal if the node is sending out data to the monitoring nodes. The default communication is on UDP port 20514.
Data to collect:
Enable Collector debugs under Administration > Logging > Debug Log Configuration > Monitoring nodes.
Packet captures on the monitoring node and the node for which health status unavailable alarms are being generated.
