Analyze Firepower Firewall Captures to Troubleshoot Network Issues
Available Languages
Download Options
Bias-Free Language
The documentation set for this product strives to use bias-free language. For the purposes of this documentation set, bias-free is defined as language that does not imply discrimination based on age, disability, gender, racial identity, ethnic identity, sexual orientation, socioeconomic status, and intersectionality. Exceptions may be present in the documentation due to language that is hardcoded in the user interfaces of the product software, language used based on RFP documentation, or language that is used by a referenced third-party product. Learn more about how Cisco is using Inclusive Language.
Contents
Introduction
This document describes various packet capture analysis techniques that aim to effectively troubleshoot network issues.
Prerequisites
Requirements
Cisco recommends that you have knowledge of these topics:
- Firepower platform architecture
- NGFW logs
- NGFW packet-tracer
Additionally, before you start to analyze packet captures it is highly advisable to meet these requirements:
- Know the protocol operation - Do not start to check a packet capture if you do not understand how the captured protocol operates.
- Know the topology - You must know the transit devices end-to-end. If this is not possible, you must at least know the upstream and downstream devices.
- Know the appliance - You must know how your device handles packets, what are the involved interfaces (ingress/egress), what is the device architecture, and what are the various capture points.
- Know the configuration - You must know how a packet flow is supposed to be handled by the device in terms of:
- Routing/Egress Interface
- Policies applied
- Network Address Translation (NAT)
- Know the available tools - Along with the captures, it is recommended to be ready to apply other tools and techniques (like logging and tracers) and if needed, correlate them with the captured packets.
Components Used
The information in this document is based on these software and hardware versions:
- Most of the scenarios are based on FP4140 running FTD software 6.5.x.
- FMC running software 6.5.x.
The information in this document was created from the devices in a specific lab environment. All of the devices used in this document started with a cleared (default) configuration. If your network is live, ensure that you understand the potential impact of any command.
Background Information
Packet capture is one of the most overlooked troubleshoot tools available today. Daily, Cisco TAC solves many problems with analysis of captured data.
The goal of this document is to help network and security engineers to identify and troubleshoot common network issues based mainly on packet capture analysis.
All the scenarios presented in this document are based on real user cases seen in the Cisco Technical Assistance Center (TAC).
The document covers the packet captures from a Cisco Next-Generation Firewall (NGFW) point of view, but the same concepts are applicable to other device types as well.
How to Collect and Export Captures on the NGFW Product Family?
In the case of a Firepower appliance (1xxx, 21xx, 41xx, 93xx) and a Firepower Threat Defense (FTD) application a packet processing can be visualized as shown in the image.

- A packet enters the ingress interface and it is handled by the chassis internal switch.
- The packet enters the FTD Lina engine which does mainly L3/L4 checks.
- If the policy requires the packet is inspected by the Snort engine (mainly L7 inspection).
- The Snort engine returns a verdict for the packet.
- The LINA engine drops or forwards the packet based on Snort’s verdict.
- The packet egresses the chassis through the internal chassis switch.
Based on the shown architecture, the FTD captures can be taken in three (3) different places:
- FXOS
- FTD Lina engine
- FTD Snort engine
Collect FXOS Captures
The process is described in this document:
FXOS captures can be only taken in the ingress direction from the internal switch point of view are shown in the image here.

Shown here, these are two capture points per direction (due to internal switch architecture).

Captured packets in points 2, 3, and 4 have a virtual network tag (VNTag).
Note: FXOS chassis-level captures are only available on FP41xx and FP93xx platforms. FP1xxx and FP21xx do not provide this capability.
Enable and Collect FTD Lina Captures
Main capture points:
- Ingress interface
- Egress interface
- Accelerated Security Path (ASP)

You can use either Firepower Management Center User Interface (FMC UI) or FTD CLI to enable and collect the FTD Lina captures.
Enable capture from CLI on the INSIDE interface:
firepower# capture CAPI interface INSIDE match icmp host 192.168.103.1 host 192.168.101.1
This capture matches the traffic between IPs 192.168.103.1 and 192.168.101.1 in both directions.
Enable ASP capture to see all packets dropped by the FTD Lina engine:
firepower# capture ASP type asp-drop all
Export an FTD Lina capture to an FTP server:
firepower# copy /pcap capture:CAPI ftp://ftp_username:ftp_password@192.168.78.73/CAPI.pcap
Export an FTD Lina capture to a TFTP server:
firepower# copy /pcap capture:CAPI tftp://192.168.78.73
As from FMC 6.2.x version you can enable and collect FTD Lina captures from FMC UI.
Another way to collect FTD captures from an FMC-managed firewall is this.
Step 1
In case of LINA or ASP capture copy the capture to the FTD disk.
firepower# copy /pcap capture:capin disk0:capin.pcap

Source capture name [capin]?

Destination filename [capin.pcap]?
!!!!
Step 2
Navigate to expert mode, locate the saved capture, and copy it to the /ngfw/var/common location:
firepower#

Console connection detached.

> expert
admin@firepower:~$ sudo su
Password:
root@firepower:/home/admin# cd /mnt/disk0
root@firepower:/mnt/disk0# ls -al | grep pcap
-rwxr-xr-x 1 root root     24 Apr 26 18:19 CAPI.pcap
-rwxr-xr-x 1 root root  30110 Apr  8 14:10 capin.pcap
-rwxr-xr-x 1 root root   6123 Apr  8 14:11 capin2.pcap
root@firepower:/mnt/disk0# cp capin.pcap /ngfw/var/common
Step 3
Login to the FMC that manages the FTD and navigate to Devices > Device Management. Locate the FTD device and select the Troubleshoot icon:

Step 4
Select Advanced Troubleshooting:
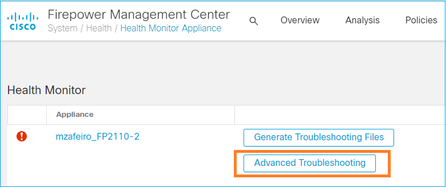
Specify the capture file name and select Download:
For more examples on how to enable/collect captures from the FMC UI check this document:
Enable and Collect FTD Snort Captures
The capture point is shown in the image here.

Enable Snort-level capture:
> capture-traffic

Please choose domain to capture traffic from:
  0 - br1
  1 - Router

Selection? 1

Please specify tcpdump options desired.
(or enter '?' for a list of supported options)
Options: -n host 192.168.101.1
To write the capture to a file with name capture.pcap and copy it via FTP to a remote server:
> capture-traffic

Please choose domain to capture traffic from:
  0 - br1
  1 - Router

Selection? 1

Please specify tcpdump options desired.
(or enter '?' for a list of supported options)
Options: -w capture.pcap host 192.168.101.1
CTRL + C <- to stop the capture

> file copy 10.229.22.136 ftp / capture.pcap
Enter password for ftp@10.229.22.136:
Copying capture.pcap
Copy successful.

>
For more Snort-level capture examples that include different capture filters check this document:
Troubleshoot
Case 1. No TCP SYN on Egress Interface
The topology is shown in the image here:

Problem Description: HTTP does not work
Affected Flow:
Src IP: 192.168.0.100
Dst IP: 10.10.1.100
Protocol: TCP 80
Capture Analysis
Enable captures on the FTD LINA engine:
firepower# capture CAPI int INSIDE match ip host 192.168.0.100 host 10.10.1.100
firepower# capture CAPO int OUTSIDE match ip host 192.168.0.100 host 10.10.1.100

Captures - Functional Scenario:
As a baseline, it is always very useful to have captures from a functional scenario.
Capture taken on NGFW INSIDE interface, is as shown in the image:

Key Points:
- TCP 3-way handshake.
- Bidirectional data exchange.
- No delays between the packets (based on the time difference between the packets).
- Source MAC is the correct downstream device.
Capture taken on NGFW OUTSIDE interface, is shown in the image here:
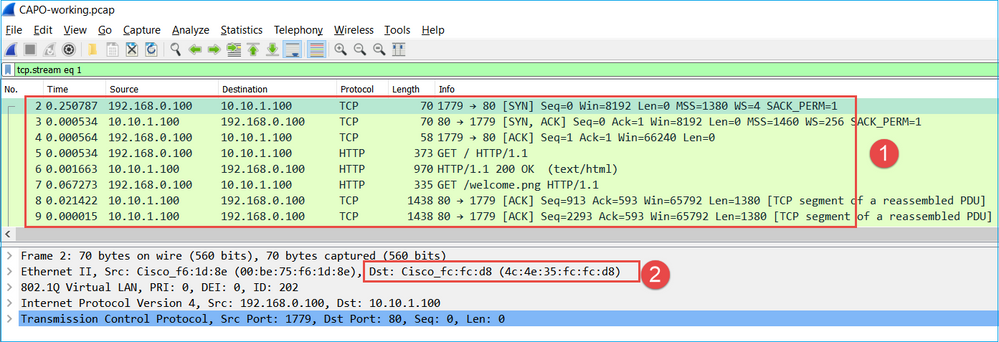
Key Points:
- Same data as in the CAPI capture.
- Destination MAC is the correct upstream device.
Captures - Non-functional scenario
From the device CLI the captures look like this:
firepower# show capture
capture CAPI type raw-data interface INSIDE [Capturing - 484 bytes]
  match ip host 192.168.0.100 host 10.10.1.100
capture CAPO type raw-data interface OUTSIDE [Capturing - 0 bytes]
  match ip host 192.168.0.100 host 10.10.1.100
CAPI contents:
firepower# show capture CAPI

6 packets captured

   1: 11:47:46.911482   192.168.0.100.3171 > 10.10.1.100.80: S 1089825363:1089825363(0) win 8192 <mss 1460,nop,wscale 2,nop,nop,sackOK>
   2: 11:47:47.161902   192.168.0.100.3172 > 10.10.1.100.80: S 3981048763:3981048763(0) win 8192 <mss 1460,nop,wscale 2,nop,nop,sackOK>
   3: 11:47:49.907683   192.168.0.100.3171 > 10.10.1.100.80: S 1089825363:1089825363(0) win 8192 <mss 1460,nop,wscale 2,nop,nop,sackOK>
   4: 11:47:50.162757   192.168.0.100.3172 > 10.10.1.100.80: S 3981048763:3981048763(0) win 8192 <mss 1460,nop,wscale 2,nop,nop,sackOK>
   5: 11:47:55.914640   192.168.0.100.3171 > 10.10.1.100.80: S 1089825363:1089825363(0) win 8192 <mss 1460,nop,nop,sackOK>
   6: 11:47:56.164710   192.168.0.100.3172 > 10.10.1.100.80: S 3981048763:3981048763(0) win 8192 <mss 1460,nop,nop,sackOK>
firepower# show capture CAPO

0 packet captured

0 packet shown
This is the image of CAPI capture in Wireshark:

Key Points:
- Only TCP SYN packets are seen (no TCP 3-way handshake).
- There are 2 TCP sessions (source port 3171 and 3172) that cannot be established. The source client resends the TCP SYN packets. These retransmitted packets are identified by the Wireshark as TCP Retransmissions.
- The TCP Retransmissions occur every ~3 then 6 etc seconds.
- The source MAC address is from the correct downstream device.
Based on the 2 captures it can be concluded that:
- A packet of a specific 5-tuple (src/dst IP, src/dst port, protocol) arrives on the firewall on the expected interface (INSIDE).
- A packet does not leave the firewall on the expected interface (OUTSIDE).
Recommended Actions
The actions listed in this section have as a goal to further narrow down the issue.
Action 1. Check the Trace of an Emulated Packet.
Use the packet-tracer tool to see how a packet is supposed to be handled by the firewall. In case the packet is dropped by the firewall Access Policy the trace of the emulated packet looks similar to this output:
firepower# packet-tracer input INSIDE tcp 192.168.0.100 11111 10.10.1.100 80

Phase: 1
Type: CAPTURE
Subtype:
Result: ALLOW
Config:
Additional Information:
MAC Access list

Phase: 2
Type: ACCESS-LIST
Subtype:
Result: ALLOW
Config:
Implicit Rule
Additional Information:
MAC Access list

Phase: 3
Type: ROUTE-LOOKUP
Subtype: Resolve Egress Interface
Result: ALLOW
Config:
Additional Information:
found next-hop 192.168.2.72 using egress ifc  OUTSIDE

Phase: 4
Type: ACCESS-LIST
Subtype: log
Result: DROP
Config:
access-group CSM_FW_ACL_ global
access-list CSM_FW_ACL_ advanced deny ip any any rule-id 268439946 event-log flow-start
access-list CSM_FW_ACL_ remark rule-id 268439946: ACCESS POLICY: FTD_Policy - Default
access-list CSM_FW_ACL_ remark rule-id 268439946: L4 RULE: DEFAULT ACTION RULE
Additional Information:

Result:
input-interface: INSIDE
input-status: up
input-line-status: up
output-interface: OUTSIDE
output-status: up
output-line-status: up
Action: drop
Drop-reason: (acl-drop) Flow is denied by configured rule, Drop-location: frame 0x00005647a4f4b120 flow (NA)/NA
Action 2. Check the traces of live packets.
Enable the packet trace to check how the real TCP SYN packets are handled by the firewall. By default, only the first 50 ingress packets are traced:
firepower# capture CAPI trace
Clear the capture buffer:
firepower# clear capture /all
In case the packet is dropped by the firewall Access Policy the trace looks similar to this output:
firepower# show capture CAPI packet-number 1 trace

6 packets captured

   1: 12:45:36.279740       192.168.0.100.3630 > 10.10.1.100.80: S 2322685377:2322685377(0) win 8192 <mss 1460,nop,wscale 2,nop,nop,sackOK>
Phase: 1
Type: CAPTURE
Subtype:
Result: ALLOW
Config:
Additional Information:
MAC Access list

Phase: 2
Type: ACCESS-LIST
Subtype:
Result: ALLOW
Config:
Implicit Rule
Additional Information:
MAC Access list

Phase: 3
Type: ROUTE-LOOKUP
Subtype: Resolve Egress Interface
Result: ALLOW
Config:
Additional Information:
found next-hop 192.168.2.72 using egress ifc  OUTSIDE

Phase: 4
Type: ACCESS-LIST
Subtype: log
Result: DROP
Config:
access-group CSM_FW_ACL_ global
access-list CSM_FW_ACL_ advanced deny ip any any rule-id 268439946 event-log flow-start
access-list CSM_FW_ACL_ remark rule-id 268439946: ACCESS POLICY: FTD_Policy - Default
access-list CSM_FW_ACL_ remark rule-id 268439946: L4 RULE: DEFAULT ACTION RULE
Additional Information:

Result:
input-interface: INSIDE
input-status: up
input-line-status: up
output-interface: OUTSIDE
output-status: up
output-line-status: up
Action: drop
Drop-reason: (acl-drop) Flow is denied by configured rule, Drop-location: frame 0x00005647a4f4b120 flow (NA)/NA

1 packet shown
Action 3. Check FTD Lina logs.
To configure Syslog on FTD via FMC check this document:
It is highly recommended to have an external Syslog server configured for FTD Lina logs. If there is no remote Syslog server configured, enable local buffer logs on the firewall while you troubleshoot. The log configuration shown in this example is a good start point:
firepower# show run logging
…
logging enable
logging timestamp
logging buffer-size 1000000
logging buffered informational
Set the terminal pager to 24 lines in order to control the terminal pager:
firepower# terminal pager 24
Clear the capture buffer:
firepower# clear logging buffer
Test the connection and check the logs with a parser filter. In this example the packets are dropped by the firewall Access Policy:
firepower# show logging | include 10.10.1.100
Oct 09 2019 12:55:51: %FTD-4-106023: Deny tcp src INSIDE:192.168.0.100/3696 dst OUTSIDE:10.10.1.100/80 by access-group "CSM_FW_ACL_" [0x97aa021a, 0x0]
Oct 09 2019 12:55:51: %FTD-4-106023: Deny tcp src INSIDE:192.168.0.100/3697 dst OUTSIDE:10.10.1.100/80 by access-group "CSM_FW_ACL_" [0x97aa021a, 0x0]
Oct 09 2019 12:55:54: %FTD-4-106023: Deny tcp src INSIDE:192.168.0.100/3696 dst OUTSIDE:10.10.1.100/80 by access-group "CSM_FW_ACL_" [0x97aa021a, 0x0]
Oct 09 2019 12:55:54: %FTD-4-106023: Deny tcp src INSIDE:192.168.0.100/3697 dst OUTSIDE:10.10.1.100/80 by access-group "CSM_FW_ACL_" [0x97aa021a, 0x0]
Action 4. Check the firewall ASP drops.
If you suspect that the packet is dropped by the firewall you can see the counters of all the packets dropped by the firewall at software level:
firepower# show asp drop

Frame drop:
  No route to host (no-route)                                                234
  Flow is denied by configured rule (acl-drop)                                71

Last clearing: 07:51:52 UTC Oct 10 2019 by enable_15

Flow drop:

Last clearing: 07:51:52 UTC Oct 10 2019 by enable_15
You can enable captures to see all ASP software-level drops:
firepower# capture ASP type asp-drop all buffer 33554432 headers-only
Tip: If you are not interested in the packet contents you can capture only the packet headers (headers-only option). This allows you to capture much more many packets in the capture buffer. Additionally, you can increase the size of the capture buffer (by default is 500Kbytes) to a value up 32 Mbytes (buffer option). Finally, as from FTD version 6.3, the file-size option allows you to configure a capture file up to 10GBytes. In that case you can only see the capture contents in a pcap format.
To check the capture contents, you can use a filter to narrow down your search:
firepower# show capture ASP | include 10.10.1.100
  18: 07:51:57.823672   192.168.0.100.12410 > 10.10.1.100.80: S 1870382552:1870382552(0) win 8192 <mss 1460,nop,wscale 2,nop,nop,sackOK>
  19: 07:51:58.074291   192.168.0.100.12411 > 10.10.1.100.80: S 2006489005:2006489005(0) win 8192 <mss 1460,nop,wscale 2,nop,nop,sackOK>
  26: 07:52:00.830370   192.168.0.100.12410 > 10.10.1.100.80: S 1870382552:1870382552(0) win 8192 <mss 1460,nop,wscale 2,nop,nop,sackOK>
  29: 07:52:01.080394   192.168.0.100.12411 > 10.10.1.100.80: S 2006489005:2006489005(0) win 8192 <mss 1460,nop,wscale 2,nop,nop,sackOK>
  45: 07:52:06.824282   192.168.0.100.12410 > 10.10.1.100.80: S 1870382552:1870382552(0) win 8192 <mss 1460,nop,nop,sackOK>
  46: 07:52:07.074230   192.168.0.100.12411 > 10.10.1.100.80: S 2006489005:2006489005(0) win 8192 <mss 1460,nop,nop,sackOK>
In this case, since the packets are already traced at interface level the reason for the drop is not mentioned in the ASP capture. Remember that a packet can be only traced in one place (ingress interface or ASP drop). In that case, it is recommended to take multiple ASP drops and set a specific ASP drop reason. Here is a recommended approach:
1. Clear the current ASP drop counters:
firepower# clear asp drop
2. Send the flow that you troubleshoot through the firewall (run a test).
3. Check again the ASP drop counters and note down the ones increased.
firepower# show asp drop
Frame drop:
  No route to host (no-route)                                                234
  Flow is denied by configured rule (acl-drop)                                71
4. Enable ASP capture(s) for the specific drops seen:
firepower# capture ASP_NO_ROUTE type asp-drop no-route
firepower# capture ASP_ACL_DROP type asp-drop acl-drop
5. Send the flow that you troubleshoot through the firewall (run a test).
6. Check the ASP captures. In this case, the packets were dropped due to an absent route:
firepower# show capture ASP_NO_ROUTE | include 192.168.0.100.*10.10.1.100
  93: 07:53:52.381663   192.168.0.100.12417 > 10.10.1.100.80: S 3451917925:3451917925(0) win 8192 <mss 1460,nop,wscale 2,nop,nop,sackOK>
  95: 07:53:52.632337   192.168.0.100.12418 > 10.10.1.100.80: S 1691844448:1691844448(0) win 8192 <mss 1460,nop,wscale 2,nop,nop,sackOK>
 101: 07:53:55.375392   192.168.0.100.12417 > 10.10.1.100.80: S 3451917925:3451917925(0) win 8192 <mss 1460,nop,wscale 2,nop,nop,sackOK>
 102: 07:53:55.626386   192.168.0.100.12418 > 10.10.1.100.80: S 1691844448:1691844448(0) win 8192 <mss 1460,nop,wscale 2,nop,nop,sackOK>
 116: 07:54:01.376231   192.168.0.100.12417 > 10.10.1.100.80: S 3451917925:3451917925(0) win 8192 <mss 1460,nop,nop,sackOK>
 117: 07:54:01.626310   192.168.0.100.12418 > 10.10.1.100.80: S 1691844448:1691844448(0) win 8192 <mss 1460,nop,nop,sackOK>
Action 5. Check the FTD Lina connection table.
There can be cases where you expect the packet to egress interface 'X', but for whatever reasons it egresses interface 'Y'. The firewall egress interface determination is based on this order of operation:
- Established Connection Lookup
- Network Address Translation (NAT) lookup - UN-NAT (destination NAT) phase takes precedence over PBR and route lookup.
- Policy-Based Routing (PBR)
- Routing Table lookup
To check the FTD connection table:
firepower# show conn
2 in use, 4 most used
Inspect Snort:
        preserve-connection: 2 enabled, 0 in effect, 4 most enabled, 0 most in effect

TCP DMZ  10.10.1.100:80 INSIDE  192.168.0.100:11694, idle 0:00:01, bytes 0, flags aA N1
TCP DMZ  10.10.1.100:80 INSIDE  192.168.0.100:11693, idle 0:00:01, bytes 0, flags aA N1
Key Points:
- Based on the flags (Aa) the connection is embryonic (half-opened - only TCP SYN was seen by the firewall).
- Based on the source/destination ports the ingress interface is INSIDE and the egress interface is DMZ.
This can be visualized in the image here:

Note: Since all FTD interfaces have a Security Level of 0 the interface order in the show conn output is based on the interface number. Specifically, the interface with higher vpif-num (virtual platform interface number) is selected as inside while the interface with lower vpif-num is selected as outside. You can see the interface vpif value with the show interface detail command. Related enhancement, Cisco bug ID CSCvi15290  ENH: FTD shows the connection directionality in FTD 'show conn' output
firepower# show interface detail | i Interface number is|Interface [P|E].*is up
...
Interface Ethernet1/2 "INSIDE", is up, line protocol is up
        Interface number is 19
Interface Ethernet1/3.202 "OUTSIDE", is up, line protocol is up
        Interface number is 20
Interface Ethernet1/3.203 "DMZ", is up, line protocol is up
Interface number is 22Note: As from Firepower software release 6.5, ASA release 9.13.x the show conn long and show conn detail command outputs provide information about the connection initiator and responder
Output 1:
firepower# show conn long
...
TCP OUTSIDE: 192.168.2.200/80 (192.168.2.200/80) INSIDE: 192.168.1.100/46050 (192.168.1.100/46050), flags aA N1, idle 3s, uptime 6s, timeout 30s, bytes 0
  Initiator: 192.168.1.100, Responder: 192.168.2.200
  Connection lookup keyid: 228982375
Output 2:
firepower# show conn detail
...
TCP OUTSIDE: 192.168.2.200/80 INSIDE: 192.168.1.100/46050,
    flags aA N1, idle 4s, uptime 11s, timeout 30s, bytes 0
  Initiator: 192.168.1.100, Responder: 192.168.2.200
  Connection lookup keyid: 228982375
Additionally, the show conn long displays the NATed IPs within a parenthesis in case of a Network Address Translation:
firepower# show conn long
...
TCP OUTSIDE: 192.168.2.222/80 (192.168.2.222/80) INSIDE: 192.168.1.100/34792 (192.168.2.150/34792), flags aA N1, idle 0s, uptime 0s, timeout 30s, bytes 0, xlate id 0x2b5a8a4314c0
  Initiator: 192.168.1.100, Responder: 192.168.2.222
  Connection lookup keyid: 262895
Action 6. Check the firewall Address Resolution Protocol (ARP) cache.
If the firewall cannot resolve the next hop, the firewall silently drops the original packet (TCP SYN in this case) and continuously sends ARP Requests until it resolves the next hop.
In order to see the firewall ARP cache, use the command:
firepower# show arp
Additionally, to check if there are unresolved hosts you can use the command:
firepower# show arp statistics
        Number of ARP entries in ASA: 0

        Dropped blocks in ARP: 84
        Maximum Queued blocks: 3
        Queued blocks: 0
        Interface collision ARPs Received: 0
        ARP-defense Gratuitous ARPS sent: 0
        Total ARP retries: 182			< indicates a possible issue for some hosts
        Unresolved hosts: 1			< this is the current status
        Maximum Unresolved hosts: 2
If you want to check further the ARP operation you can enable an ARP-specific capture:
firepower# capture ARP ethernet-type arp interface OUTSIDE
firepower# show capture ARP
...
   4: 07:15:16.877914       802.1Q vlan#202 P0 arp who-has 192.168.2.72 tell 192.168.2.50
   5: 07:15:18.020033       802.1Q vlan#202 P0 arp who-has 192.168.2.72 tell 192.168.2.50
In this output, the firewall (192.168.2.50) tries to resolve the next-hop (192.168.2.72), but there is no ARP reply

The output here shows a functional scenario with proper ARP resolution:
firepower# show capture ARP

2 packets captured

   1: 07:17:19.495595       802.1Q vlan#202 P0 arp who-has 192.168.2.72 tell 192.168.2.50
   2: 07:17:19.495946       802.1Q vlan#202 P0 arp reply 192.168.2.72 is-at 4c:4e:35:fc:fc:d8
2 packets shown
firepower# show arp
        INSIDE 192.168.1.71 4c4e.35fc.fcd8 9
        OUTSIDE 192.168.2.72 4c4e.35fc.fcd8 9
In case there is no ARP entry in place a trace of a live TCP SYN packet shows:
firepower# show capture CAPI packet-number 1 trace

6 packets captured

   1: 07:03:43.270585       192.168.0.100.11997 > 10.10.1.100.80: S 4023707145:4023707145(0) win 8192 <mss 1460,nop,wscale 2,nop,nop,sackOK>
Phase: 1
Type: CAPTURE
Subtype:
Result: ALLOW
Config:
Additional Information:
MAC Access list

Phase: 2
Type: ACCESS-LIST
Subtype:
Result: ALLOW
Config:
Implicit Rule
Additional Information:
MAC Access list

Phase: 3
Type: ROUTE-LOOKUP
Subtype: Resolve Egress Interface
Result: ALLOW
Config:
Additional Information:
found next-hop 192.168.2.72 using egress ifc  OUTSIDE
…
Phase: 14
Type: FLOW-CREATION
Subtype:
Result: ALLOW
Config:
Additional Information:
New flow created with id 4814, packet dispatched to next module
…
Phase: 17
Type: ROUTE-LOOKUP
Subtype: Resolve Egress Interface
Result: ALLOW
Config:
Additional Information:
found next-hop 192.168.2.72 using egress ifc  OUTSIDE

Result:
input-interface: INSIDE
input-status: up
input-line-status: up
output-interface: OUTSIDE
output-status: up
output-line-status: up
Action: allow
As can be seen in the output, the trace shows Action: allow even when the next hop is not reachable and the packet is silently dropped by the firewall! In this case, the packet-tracer tool must be also checked since it provides a more accurate output:
firepower# packet-tracer input INSIDE tcp 192.168.0.100 1111 10.10.1.100 80

Phase: 1
Type: CAPTURE
Subtype:
Result: ALLOW
Config:
Additional Information:
MAC Access list

Phase: 2
Type: ACCESS-LIST
Subtype:
Result: ALLOW
Config:
Implicit Rule
Additional Information:
MAC Access list

Phase: 3
Type: ROUTE-LOOKUP
Subtype: Resolve Egress Interface
Result: ALLOW
Config:
Additional Information:
found next-hop 192.168.2.72 using egress ifc  OUTSIDE
…

Phase: 14
Type: FLOW-CREATION
Subtype:
Result: ALLOW
Config:
Additional Information:
New flow created with id 4816, packet dispatched to next module
…
Phase: 17
Type: ROUTE-LOOKUP
Subtype: Resolve Egress Interface
Result: ALLOW
Config:
Additional Information:
found next-hop 192.168.2.72 using egress ifc  OUTSIDE

Result:
input-interface: INSIDE
input-status: up
input-line-status: up
output-interface: OUTSIDE
output-status: up
output-line-status: up
Action: drop
Drop-reason: (no-v4-adjacency) No valid V4 adjacency, Drop-location: frame 0x00005647a4e86109 flow (NA)/NA
In recent ASA/Firepower versions, the previous message has been optimized to:
Drop-reason: (no-v4-adjacency) No valid V4 adjacency. Check ARP table (show arp) has entry for nexthop., Drop-location: f
Possible Causes and Recommended Actions Summary
If you only see a TCP SYN packet on the ingress interfaces, but no TCP SYN packet sent out of the expected egress interface some possible causes are:
|
Possible Cause |
Recommended Actions |
|
The packet is dropped by the firewall access-policy. |
|
|
The capture filter is wrong. |
|
|
The packet is sent to a different egress interface. |
If the packet is sent to a wrong interface because it matches a current connection use the command clear conn address and specify the 5-tuple of the connection that you want to clear. |
|
There is no route towards the destination. |
|
|
There is no ARP entry on the egress interface. |
|
|
The egress interface is down. |
Check the output of the show interface ip brief command on the firewall and verify the interface status. |
Case 2. TCP SYN from Client, TCP RST from Server
This image shows the topology:

Problem Description: HTTP does not work
Affected Flow:
Src IP: 192.168.0.100
Dst IP: 10.10.1.100
Protocol: TCP 80
Capture Analysis
Enable captures on the FTD LINA engine.
firepower# capture CAPI int INSIDE match ip host 192.168.0.100 host 10.10.1.100
firepower# capture CAPO int OUTSIDE match ip host 192.168.0.100 host 10.10.1.100

Captures - Non-functional scenario:
This is how the captures look from the device CLI:
firepower# show capture
capture CAPI type raw-data trace interface INSIDE [Capturing - 834 bytes]
  match ip host 192.168.0.100 host 10.10.1.100
capture CAPO type raw-data interface OUTSIDE [Capturing - 878 bytes]
  match ip host 192.168.0.100 host 10.10.1.100
CAPI contents:
firepower# show capture CAPI
   1: 05:20:36.654217   192.168.0.100.22195 > 10.10.1.100.80: S 1397289928:1397289928(0) win 8192 <mss 1460,nop,wscale 2,nop,nop,sackOK>
   2: 05:20:36.904311   192.168.0.100.22196 > 10.10.1.100.80: S 2171673258:2171673258(0) win 8192 <mss 1460,nop,wscale 2,nop,nop,sackOK>
   3: 05:20:36.905043   10.10.1.100.80 > 192.168.0.100.22196: R 1850052503:1850052503(0) ack 2171673259 win 0
   4: 05:20:37.414132   192.168.0.100.22196 > 10.10.1.100.80: S 2171673258:2171673258(0) win 8192 <mss 1460,nop,wscale 2,nop,nop,sackOK>
   5: 05:20:37.414803   10.10.1.100.80 > 192.168.0.100.22196: R 31997177:31997177(0) ack 2171673259 win 0
   6: 05:20:37.914183   192.168.0.100.22196 > 10.10.1.100.80: S 2171673258:2171673258(0) win 8192 <mss 1460,nop,nop,sackOK>
...
CAPO contents:
firepower# show capture CAPO
   1: 05:20:36.654507   802.1Q vlan#202 P0 192.168.0.100.22195 > 10.10.1.100.80: S 2866789268:2866789268(0) win 8192 <mss 1380,nop,wscale 2,nop,nop,sackOK>
   2: 05:20:36.904478   802.1Q vlan#202 P0 192.168.0.100.22196 > 10.10.1.100.80: S 4785344:4785344(0) win 8192 <mss 1380,nop,wscale 2,nop,nop,sackOK>
   3: 05:20:36.904997   802.1Q vlan#202 P0 10.10.1.100.80 > 192.168.0.100.22196: R 0:0(0) ack 4785345 win 0
   4: 05:20:37.414269   802.1Q vlan#202 P0 192.168.0.100.22196 > 10.10.1.100.80: S 4235354730:4235354730(0) win 8192 <mss 1380,nop,wscale 2,nop,nop,sackOK>
   5: 05:20:37.414758   802.1Q vlan#202 P0 10.10.1.100.80 > 192.168.0.100.22196: R 0:0(0) ack 4235354731 win 0
   6: 05:20:37.914305   802.1Q vlan#202 P0 192.168.0.100.22196 > 10.10.1.100.80: S 4118617832:4118617832(0) win 8192 <mss 1380,nop,nop,sackOK>
This image shows the capture of CAPI in Wireshark.

Key Points:
- The source sends a TCP SYN packet.
- A TCP RST is sent towards the source.
- The source retransmits the TCP SYN packets.
- The MAC addresses are correct (on ingress packets the source MAC address belongs to the downstream router, the destination MAC address belongs to the firewall INSIDE interface).
This image shows the capture of CAPO in Wireshark:

Key Points:
- The source sends a TCP SYN packet.
- A TCP RST arrives on the OUTSIDE interface.
- The source retransmits the TCP SYN packets.
- The MAC addresses are correct (on egress packets the firewall OUTSIDE is the source MAC, upstream router is the destination MAC).
Based on the 2 captures it can be concluded that:
- The TCP 3-way handshake between the client and the server does not get completed
- There is a TCP RST which arrives on the firewall egress interface
- The firewall 'talks' to the proper upstream and downstream devices (based on the MAC addresses)
Recommended Actions
The actions listed in this section have as a goal to further narrow down the issue.
Action 1. Check the source MAC address that sends the TCP RST.
Verify that the destination MAC seen in the TCP SYN packet is the same as the source MAC has seen in the TCP RST packet.
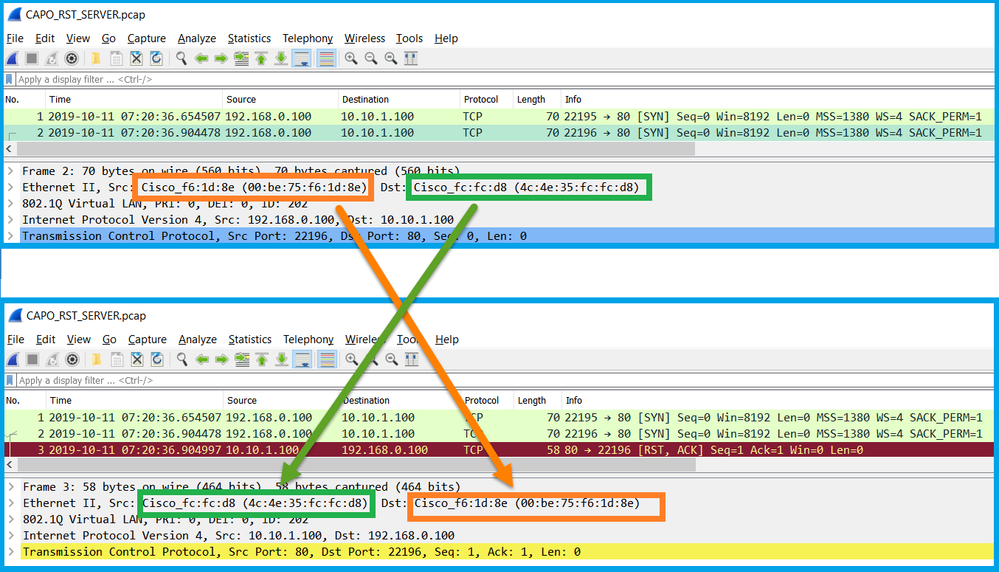
This check has as a goal to confirm 2 things:
- Verify that there is no asymmetric flow.
- Verify that the MAC belongs to the expected upstream device.
Action 2. Compare ingress and egress packets.
Visually compare the 2 packets on Wireshark to verify that the firewall does not modify/corrupt the packets. Some expected differences are highlighted.
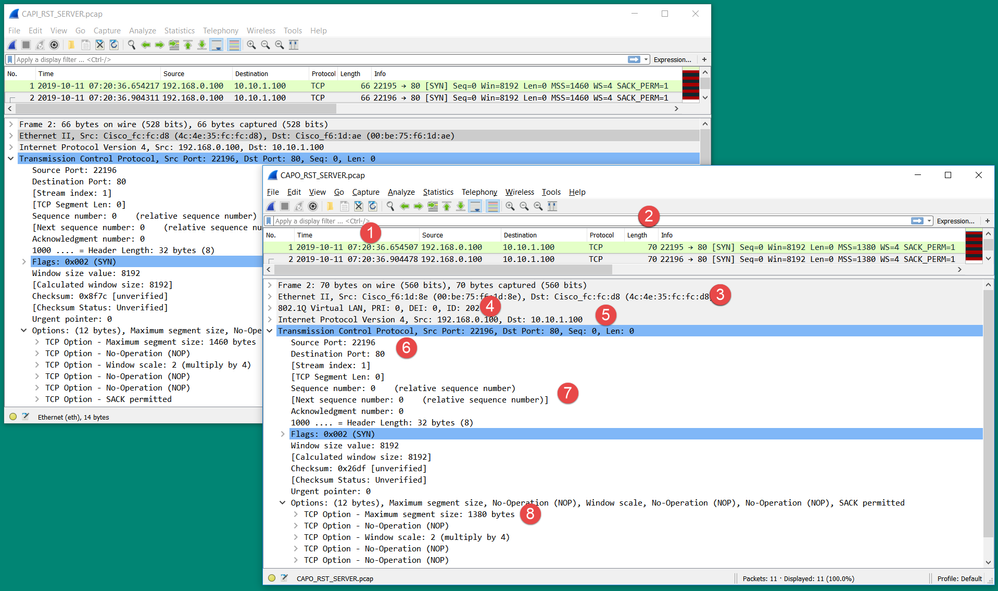
Key Points:
- Timestamps are different. On the other hand, the difference must be small and reasonable. This depends on the features and policy checks applied to the packet as well as the load on the device.
- The length of the packets differ especially if there is a dot1Q header added/removed by the firewall on one side only.
- The MAC addresses are different.
- A dot1Q header can be in place if the capture was taken on a subinterface.
- The IP address(es) are different in case NAT or Port Address Translation (PAT) is applied to the packet.
- The source or destination ports are different in case NAT or PAT is applied to the packet.
- If you disable the Wireshark Relative Sequence Number option you see that the TCP sequence numbers/acknowledgment numbers are modified by the firewall due to Initial Sequence Number (ISN) randomization.
- Some TCP options can be overwritten. For example, the firewall by default changes the TCP Maximum Segment Size (MSS) to 1380 in order to avoid packet fragmentation in the transit path.
Action 3. Take a capture at the destination.
If possible, take a capture at the destination itself. If this is not possible take a capture as close to the destination as possible. The goal here is to verify who sends the TCP RST (is the destination server or is some other device in the path?).
Case 3. TCP 3-Way Handshake + RST from One Endpoint
This image shows the topology:

Problem Description: HTTP does not work
Affected Flow:
Src IP: 192.168.0.100
Dst IP: 10.10.1.100
Protocol: TCP 80
Capture Analysis
Enable captures on the FTD LINA engine.
firepower# capture CAPI int INSIDE match ip host 192.168.0.100 host 10.10.1.100
firepower# capture CAPO int OUTSIDE match ip host 192.168.0.100 host 10.10.1.100

Captures - Non-functional scenario:
There are a couple of different ways this issue can manifest in captures.
3.1 - TCP 3-way Handshake + Delayed RST from the Client
Both the firewall captures CAPI and CAPO contain the same packets, as shown in the image.

Key Points:
- The TCP 3-way handshake goes through the firewall.
- The server retransmits the SYN/ACK.
- The client retransmits the ACK.
- After ~20 sec the client gives up and sends a TCP RST.
Recommended Actions
The actions listed in this section have as a goal to further narrow down the issue.
Action 1. Take captures as close to the two endpoints as possible.
The firewall captures indicate that the client ACK was not processed by the server. This is based on these facts:
- The server retransmits the SYN/ACK.
- The client retransmits the ACK.
- The client sends a TCP RST or FIN/ACK before any data.
Capture on the server shows the problem. The client ACK from the TCP 3-way handshake never arrived:

3.2 - TCP 3-way Handshake + Delayed FIN/ACK from Client + Delayed RST from the Server
Both the firewall captures CAPI and CAPO contain the same packets, as shown in the image.

Key Points:
- The TCP 3-way handshake goes through the firewall.
- After ~5 sec the client sends a FIN/ACK.
- After ~20 sec the server gives up and sends a TCP RST.
Based on this capture it can be concluded that although there is a TCP 3-way handshake through the firewall it seems that it never actually gets completed on one endpoint (the retransmissions indicate this).
Recommended Actions
Same as in case 3.1
3.3 - TCP 3-way Handshake + Delayed RST from the Client
Both the firewall captures CAPI and CAPO contain the same packets, as shown in the image.

Key Points:
- The TCP 3-way handshake goes through the firewall.
- After ~20 sec the client gives up and sends a TCP RST.
Based on these captures it can be concluded that:
- After 5-20 seconds one endpoint gives up and decides to terminate the connection.
Recommended Actions
Same as in case 3.1
3.4 - TCP 3-way Handshake + Immediate RST from the Server
Both firewall captures CAPI and CAPO contain these packets, as shown in the image.

Key Points:
- The TCP 3-way handshake goes through the firewall.
- There is a TCP RST from the server a few milliseconds after the ACK packet.
Recommended Actions
Action: Take captures as close to the server as possible.
An immediate TCP RST from the server could indicate a malfunctioning server or a device in the path that sends the TCP RST. Take a capture on the server itself and determine the source of the TCP RST.
Case 4. TCP RST from the Client
This image shows the topology:

Problem Description: HTTP does not work.
Affected Flow:
Src IP: 192.168.0.100
Dst IP: 10.10.1.100
Protocol: TCP 80
Capture Analysis
Enable captures on FTD LINA engine.
firepower# capture CAPI int INSIDE match ip host 192.168.0.100 host 10.10.1.100
firepower# capture CAPO int OUTSIDE match ip host 192.168.0.100 host 10.10.1.100

Captures - Non-functional scenario:
These are the CAPI contents.
firepower# show capture CAPI

14 packets captured

   1: 12:32:22.860627   192.168.0.100.47078 > 10.10.1.100.80: S 4098574664:4098574664(0) win 8192 <mss 1460,nop,wscale 2,nop,nop,sackOK>
   2: 12:32:23.111307   192.168.0.100.47079 > 10.10.1.100.80: S 2486945841:2486945841(0) win 8192 <mss 1460,nop,wscale 2,nop,nop,sackOK>
   3: 12:32:23.112390   192.168.0.100.47079 > 10.10.1.100.80: R 3000518858:3000518858(0) win 0
   4: 12:32:25.858109   192.168.0.100.47078 > 10.10.1.100.80: S 4098574664:4098574664(0) win 8192 <mss 1460,nop,wscale 2,nop,nop,sackOK>
   5: 12:32:25.868698   192.168.0.100.47078 > 10.10.1.100.80: R 1386249853:1386249853(0) win 0
   6: 12:32:26.108118   192.168.0.100.47079 > 10.10.1.100.80: S 2486945841:2486945841(0) win 8192 <mss 1460,nop,wscale 2,nop,nop,sackOK>
   7: 12:32:26.109079   192.168.0.100.47079 > 10.10.1.100.80: R 3000518858:3000518858(0) win 0
   8: 12:32:26.118295   192.168.0.100.47079 > 10.10.1.100.80: R 3000518858:3000518858(0) win 0
   9: 12:32:31.859925   192.168.0.100.47078 > 10.10.1.100.80: S 4098574664:4098574664(0) win 8192 <mss 1460,nop,nop,sackOK>
  10: 12:32:31.860902   192.168.0.100.47078 > 10.10.1.100.80: R 1386249853:1386249853(0) win 0
  11: 12:32:31.875229   192.168.0.100.47078 > 10.10.1.100.80: R 1386249853:1386249853(0) win 0
  12: 12:32:32.140632   192.168.0.100.47079 > 10.10.1.100.80: R 3000518858:3000518858(0) win 0
  13: 12:32:32.159995   192.168.0.100.47079 > 10.10.1.100.80: S 2486945841:2486945841(0) win 8192 <mss 1460,nop,nop,sackOK>
  14: 12:32:32.160956   192.168.0.100.47079 > 10.10.1.100.80: R 3000518858:3000518858(0) win 0
14 packets shown
These are the CAPO contents:
firepower# show capture CAPO

11 packets captured

   1: 12:32:22.860780   802.1Q vlan#202 P0 192.168.0.100.47078 > 10.10.1.100.80: S 1386249852:1386249852(0) win 8192 <mss 1380,nop,wscale 2,nop,nop,sackOK>
   2: 12:32:23.111429   802.1Q vlan#202 P0 192.168.0.100.47079 > 10.10.1.100.80: S 3000518857:3000518857(0) win 8192 <mss 1380,nop,wscale 2,nop,nop,sackOK>
   3: 12:32:23.112405   802.1Q vlan#202 P0 192.168.0.100.47079 > 10.10.1.100.80: R 3514091874:3514091874(0) win 0
   4: 12:32:25.858125   802.1Q vlan#202 P0 192.168.0.100.47078 > 10.10.1.100.80: S 1386249852:1386249852(0) win 8192 <mss 1380,nop,wscale 2,nop,nop,sackOK>
   5: 12:32:25.868729   802.1Q vlan#202 P0 192.168.0.100.47078 > 10.10.1.100.80: R 2968892337:2968892337(0) win 0
   6: 12:32:26.108240   802.1Q vlan#202 P0 192.168.0.100.47079 > 10.10.1.100.80: S 3822259745:3822259745(0) win 8192 <mss 1380,nop,wscale 2,nop,nop,sackOK>
   7: 12:32:26.109094   802.1Q vlan#202 P0 192.168.0.100.47079 > 10.10.1.100.80: R 40865466:40865466(0) win 0
   8: 12:32:31.860062   802.1Q vlan#202 P0 192.168.0.100.47078 > 10.10.1.100.80: S 4294058752:4294058752(0) win 8192 <mss 1380,nop,nop,sackOK>
   9: 12:32:31.860917   802.1Q vlan#202 P0 192.168.0.100.47078 > 10.10.1.100.80: R 1581733941:1581733941(0) win 0
  10: 12:32:32.160102   802.1Q vlan#202 P0 192.168.0.100.47079 > 10.10.1.100.80: S 4284301197:4284301197(0) win 8192 <mss 1380,nop,nop,sackOK>
  11: 12:32:32.160971   802.1Q vlan#202 P0 192.168.0.100.47079 > 10.10.1.100.80: R 502906918:502906918(0) win 0
11 packets shown
The firewall logs show:
firepower# show log | i 47741
Oct 13 2019 13:57:36: %FTD-6-302013: Built inbound TCP connection 4869 for INSIDE:192.168.0.100/47741 (192.168.0.100/47741) to OUTSIDE:10.10.1.100/80 (10.10.1.100/80)
Oct 13 2019 13:57:36: %FTD-6-302014: Teardown TCP connection 4869 for INSIDE:192.168.0.100/47741 to OUTSIDE:10.10.1.100/80 duration 0:00:00 bytes 0 TCP Reset-O from INSIDE
Oct 13 2019 13:57:39: %FTD-6-302013: Built inbound TCP connection 4870 for INSIDE:192.168.0.100/47741 (192.168.0.100/47741) to OUTSIDE:10.10.1.100/80 (10.10.1.100/80)
Oct 13 2019 13:57:39: %FTD-6-302014: Teardown TCP connection 4870 for INSIDE:192.168.0.100/47741 to OUTSIDE:10.10.1.100/80 duration 0:00:00 bytes 0 TCP Reset-O from INSIDE
Oct 13 2019 13:57:45: %FTD-6-302013: Built inbound TCP connection 4871 for INSIDE:192.168.0.100/47741 (192.168.0.100/47741) to OUTSIDE:10.10.1.100/80 (10.10.1.100/80)
Oct 13 2019 13:57:45: %FTD-6-302014: Teardown TCP connection 4871 for INSIDE:192.168.0.100/47741 to OUTSIDE:10.10.1.100/80 duration 0:00:00 bytes 0 TCP Reset-O from INSIDE
These logs indicate that there is a TCP RST which arrives on firewall INSIDE interface
CAPI capture in Wireshark:
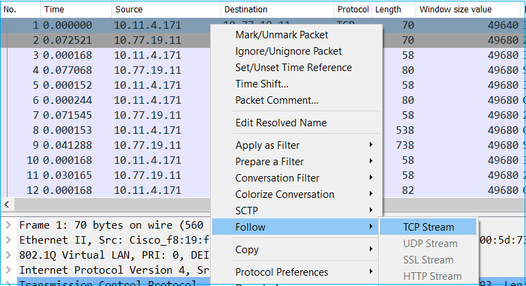
Follow the first TCP stream, as shown in the image.

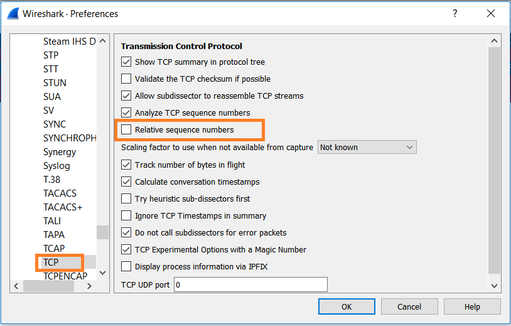
Under Wireshark, navigate to Edit > Preferences > Protocols > TCP and unselect the Relative sequence numbers option as shown in the image.
This image shows the contents of the first flow in CAPI capture:
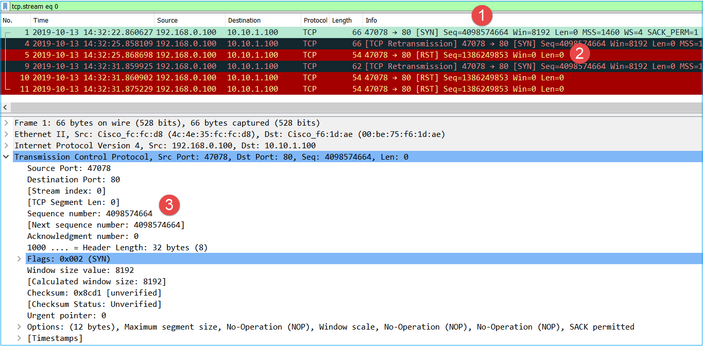
Key Points:
- The client sends a TCP SYN packet.
- The client sends a TCP RST packet.
- The TCP SYN packet has a Sequence Number value equal to 4098574664.
The same flow in CAPO capture contains:

Key Points:
- The client sends a TCP SYN packet. The firewall randomizes the ISN.
- The client sends a TCP RST packet.
Based on the two captures it can be concluded that:
- There is no TCP 3-way handshake between the client and the server.
- There is a TCP RST which comes from the client. The TCP RST sequence number value in CAPI capture is 1386249853.
Recommended Actions
The actions listed in this section have as a goal to further narrow down the issue.
Action 1. Take a capture on the client.
Based on the captures collected on the firewall there is a strong indication of an asymmetric flow. This is based on the fact that the client sends a TCP RST with a value of 1386249853 (the randomized ISN):

Key Points:
- The client sends a TCP SYN packet. The sequence number is 4098574664 and is the same as the one seen on firewall INSIDE interface (CAPI)
- There is a TCP SYN/ACK with ACK number 1386249853 (which is expected due to ISN randomization). This packet was not seen in the firewall captures
- The client sends a TCP RST since it expected a SYN/ACK with ACK number value of 4098574665, but it received value of 1386249853
This can be visualized as:

Action 2. Check the routing between the Client and the Firewall.
Confirm that:
- The MAC addresses seen in the captures are the expected ones.
- Ensure that the routing between the firewall and the client is symmetric.
There are scenarios where the RST comes from a device that sits between the firewall and the client while there is an asymmetric routing in the internal network. A typical case is shown in the image:

In this case, the capture has this content. Notice the difference between the source MAC address of the TCP SYN packet vs the source MAC address of the TCP RST and the destination MAC address of the TCP SYN/ACK packet:
firepower# show capture CAPI detail
   1: 13:57:36.730217 4c4e.35fc.fcd8 00be.75f6.1dae 0x0800 Length: 66
      192.168.0.100.47740 > 10.10.1.100.80: S [tcp sum ok] 3045001876:3045001876(0) win 8192 <mss 1460,nop,wscale 2,nop,nop,sackOK> (DF) (ttl 127, id 25661)
   2: 13:57:36.981104 4c4e.35fc.fcd8 00be.75f6.1dae 0x0800 Length: 66
      192.168.0.100.47741 > 10.10.1.100.80: S [tcp sum ok] 3809380540:3809380540(0) win 8192 <mss 1460,nop,wscale 2,nop,nop,sackOK> (DF) (ttl 127, id 25662)
   3: 13:57:36.981776 00be.75f6.1dae a023.9f92.2a4d 0x0800 Length: 66
      10.10.1.100.80 > 192.168.0.100.47741: S [tcp sum ok] 1304153587:1304153587(0) ack 3809380541 win 8192 <mss 1380,nop,wscale 8,nop,nop,sackOK> (DF) (ttl 127, id 23339)
   4: 13:57:36.982126 a023.9f92.2a4d 00be.75f6.1dae 0x0800 Length: 54
      192.168.0.100.47741 > 10.10.1.100.80: R [tcp sum ok] 3809380541:3809380541(0) ack 1304153588 win 8192 (ttl 255, id 48501)
...
Case 5. Slow TCP Transfer (Scenario 1)
Problem Description:
SFTP transfer between hosts 10.11.4.171 and 10.77.19.11 is slow. Although the minimum bandwidth (BW) between the 2 hosts is 100 Mbps the transfer speed does not go beyond 5 Mbps.
At the same time, the transfer speed between hosts 10.11.2.124 and 172.25.18.134 is quite higher.
Background Theory:
The maximum transfer speed for a single TCP flow is determined by the Bandwidth Delay Product (BDP). The formula used is shown in the image:

For more details about the BDP check the resources here:
- Why Your Application only Uses 10Mbps Even the Link is 1Gbps?
- BRKSEC-3021 - Advanced - Maximizing Firewall Performance
Scenario 1. Slow Transfer
This image shows the topology:

Affected Flow:
Src IP: 10.11.4.171
Dst IP: 10.77.19.11
Protocol: SFTP (FTP over SSH)
Capture Analysis
Enable captures on FTD LINA engine:
firepower# capture CAPI int INSIDE buffer 33554432 match ip host 10.11.4.171 host 10.77.19.11
firepower# capture CAPO int OUTSIDE buffer 33554432 match ip host 10.11.4.171 host 10.77.19.11
Warning: LINA captures on FP1xxx and FP21xx captures affect the transfer rate of traffic that goes through the FTD. Do not enable LINA captures on FP1xxx and FP21xxx platforms when you troubleshoot performance (slow transfer through the FTD) issues. Instead use SPAN or a HW Tap device in addition to captures on the source and destination hosts. The issue is documented in Cisco bug ID CSCvo30697.
firepower# capture CAPI type raw-data trace interface inside match icmp any any
WARNING: Running packet capture can have an adverse impact on performance.
Recommended Actions
The actions listed in this section have as a goal to further narrow down the issue.
Round Trip Time (RTT) Calculation
First, identify the transfer flow and follow it:
Change the Wireshark View to show the Seconds Since the Previous Displayed Packet. This eases the calculation of the RTT:
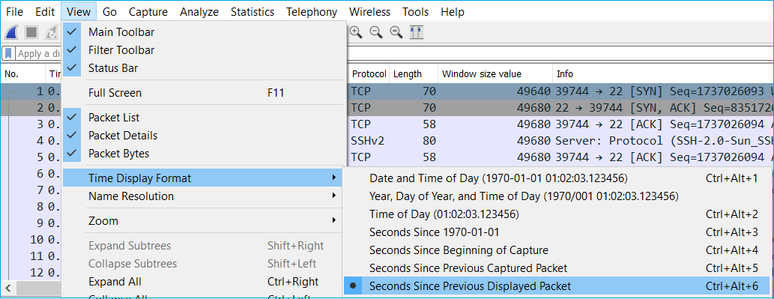
The RTT can be calculated by addition of the time values between 2 packet exchanges (one towards the source and one towards the destination). In this case, packet #2 shows the RTT between the firewall and the device who sent the SYN/ACK packet (server). Packet #3 shows the RTT between the firewall and the device who sent the ACK packet (client). The addition of the 2 numbers provides a good estimate about the end-to-end RTT:

RTT ≈ 80 msec
TCP Window Size Calculation
Expand a TCP packet, expand the TCP header, select Calculated window size and select Apply as Column:
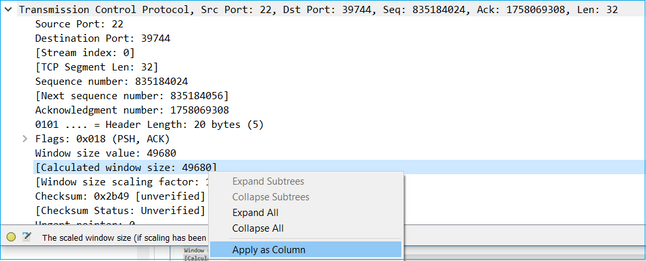
Check the Calculated window size value column to see what the maximum window size value was during the TCP session. You can also select on the column name and sort the values.
If you test a file download (server > client) you must check the values advertised by the server. The maximum window size value advertised by the server determines the maximum transfer speed achieved.
In this case, the TCP window size is ≈ 50000 Bytes

Based on these values and with the use of the Bandwidth Delay Product formula you get the maximum theoretical bandwidth that can be achieved under these conditions: 50000*8/0.08 = 5 Mbps maximum theoretical bandwidth.
This matches what the client experiences in this case.
Check closely the TCP 3-way handshake. Both sides, and more importantly the server, advertise a window scale value of 0 which means 2^0 = 1 (no windows scaling). This affects negatively the transfer rate:
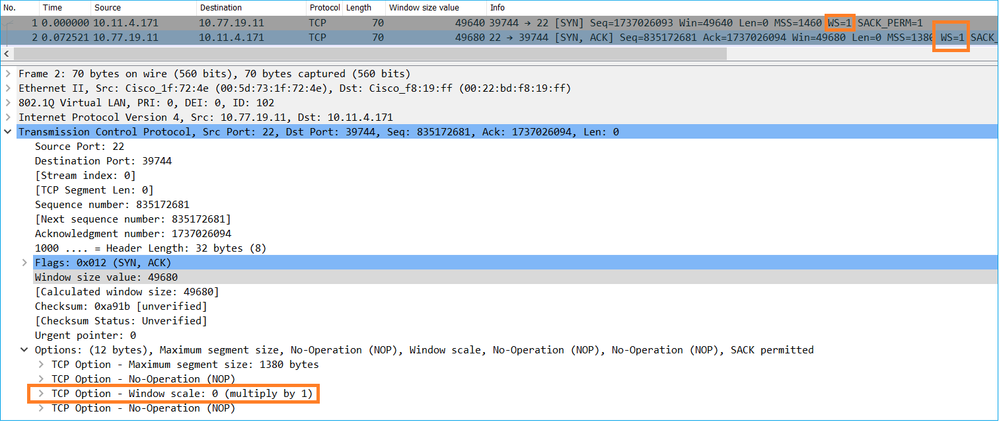
At this point, there is a need to take a capture on the server, confirm that it is the one who advertises window scale = 0 and reconfigure it (check the server documentation for how to do this).
Scenario 2. Fast Transfer
Now let’s examine the good scenario (fast transfer through the same network):
Topology:

The flow of interest:
Src IP: 10.11.2.124
Dst IP: 172.25.18.134
Protocol: SFTP (FTP over SSH)
Enable Captures on FTD LINA engine
firepower# capture CAPI int INSIDE buffer 33554432 match ip host 10.11.2.124 host 172.25.18.134
firepower# capture CAPO int OUTSIDE buffer 33554432 match ip host 10.11.2.124 host 172.25.18.134
Round Trip Time (RTT) Calculation: In this case, the RTT is ≈ 300 msec.

TCP Window Size Calculation: The server advertises a TCP window scale factor of 7.
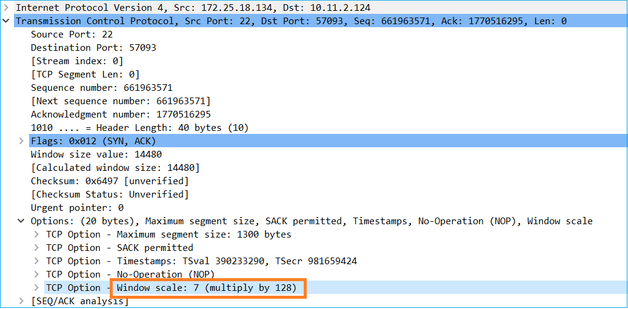
The server’s TCP window size is ≈ 1600000 Bytes:

Based on these values the Bandwidth Delay Product formula gives:
1600000*8/0.3 = 43 Mbps maximum theoretical transfer speed
Case 6. Slow TCP Transfer (Scenario 2)
Problem Description: FTP file transfer (download) through the firewall is slow.
This image shows the Topology:

Affected Flow:
Src IP: 192.168.2.220
Dst IP: 192.168.1.220
Protocol: FTP
Capture Analysis
Enable captures on the FTD LINA engine.
firepower# capture CAPI type raw-data buffer 33554432 interface INSIDE match tcp host 192.168.2.220 host 192.168.1.220
firepower# cap CAPO type raw-data buffer 33554432 interface OUTSIDE match tcp host 192.168.2.220 host 192.168.1.220
Select an FTP-DATA packet and follow the FTP Data Channel on FTD INSIDE capture (CAPI):

The FTP-DATA stream content:
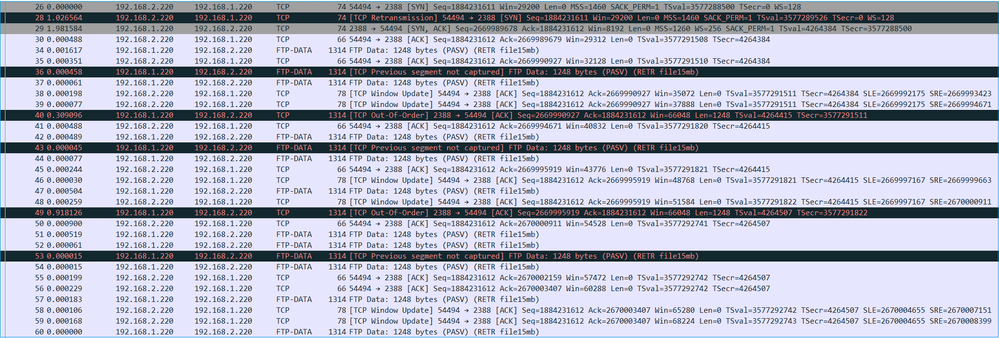
The CAPO capture content:

Key Points:
- There are TCP Out-Of-Order (OOO) packets.
- There is a TCP Retransmission.
- There is an indication of a packet loss (dropped packets).
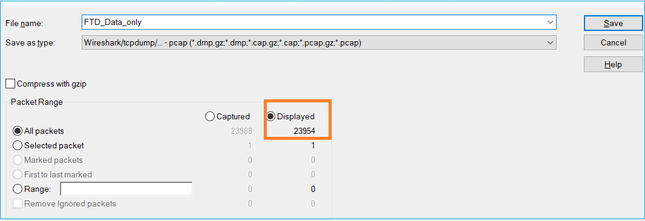
Tip: Save the captures as you navigate to File > Export Specified Packets. Then save only the Displayed packet range
Recommended Actions
The actions listed in this section have as a goal to further narrow down the issue.
Action 1. Identify the packet loss location.
In cases like this, you must take simultaneous captures and use the divide and conquer methodology to identify the network segment(s) that cause packet loss. From the firewall point of view there are 3 main scenarios:
- The packet loss is caused by the firewall itself.
- The packet loss is caused downstream to the firewall device (direction from server to client).
- The packet loss is caused upstream to the firewall device (direction from the client to server).
Packet loss caused by the Firewall: In order to identify if the packet loss is caused by the firewall there is a need to compare the ingress capture to the egress capture. There are quite many ways to compare 2 different captures. This section demonstrates one way to do this task.
Procedure to Compare 2 Captures in order to Identify the Packet Loss
Step 1. Ensure that the 2 captures contain packets from the same time window. This means there must be no packets in one capture that were captured before or after the other capture. There are a few ways to do this:
- Check the first and last packet IP identification (ID) values.
- Check the first and last packet timestamp values.
In this example you can see that the first packets of each capture have the same IP ID values:
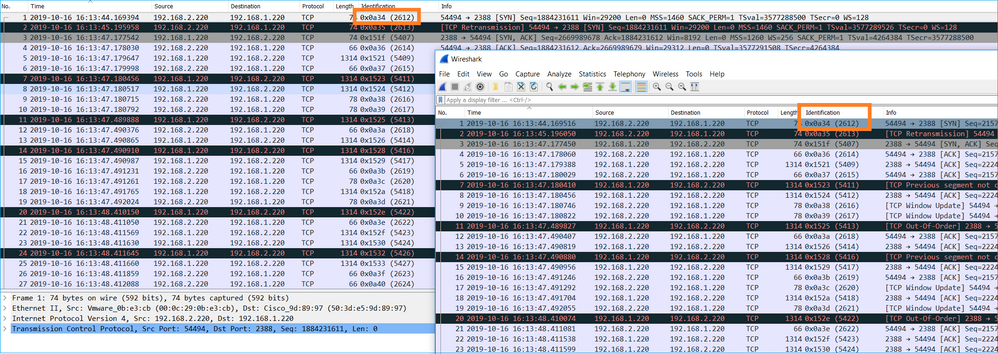
In case they are not the same then:
- Compare the Timestamps from the first packet of each capture.
- From the capture with the latest Timestamp get a filter from it change the Timestamp filter from == to >= (the first packet) and <= (the last packet), e.g:
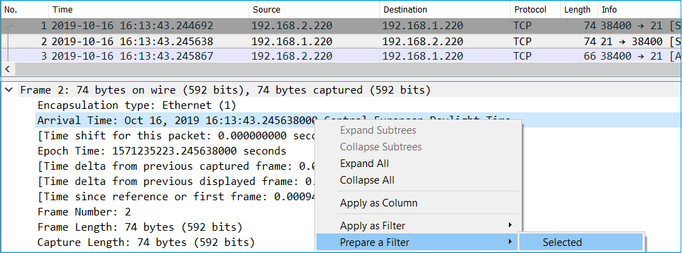
(frame.time >= "Oct 16, 2019 16:13:43.244692000") &&(frame.time <= "Oct 16, 2019 16:20:21.785130000")
3. Export the specified packets to a new capture, select File > Export Specified Packets and then save the Displayed packets. At this point, both captures must contain packets that cover the same time window. You can now start the comparison of the 2 captures.
Step 2. Specify which packet field is used for the comparison between the 2 captures. Example of fields that can be used:
- IP Identification
- RTP Sequence Number
- ICMP Sequence Number
Create a text version of each capture which contains the field for each packet that you specified in step 1. In order to do this, leave only the column of interest, for example, if you want to compare packets based on IP Identification then modify the capture as shown in the image.

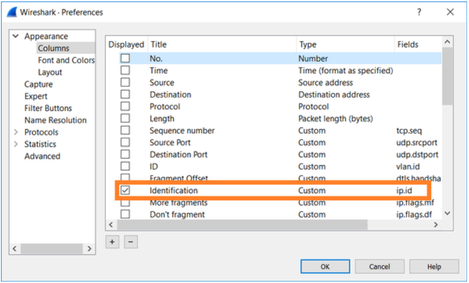
The result:
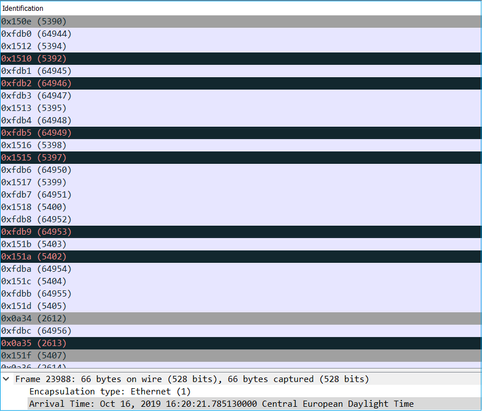
Step 3. Create a text version of the capture (File > Export Packet Dissections > As Plain Text...), as shown in the image:
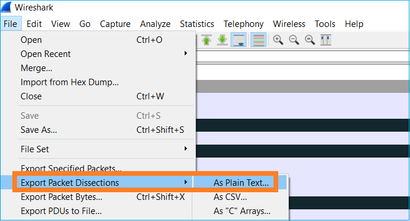
Uncheck the Include column headings and Packet details options to export only the values of the displayed field, as shown in the image:

Step 4. Sort the packets in the files. You can use the Linux sort command to do this:
# sort CAPI_IDs > file1.sorted
# sort CAPO_IDs > file2.sorted
Step 5. Use a text comparison tool (for example, WinMerge) or the Linux diff command to find the differences between the 2 captures.
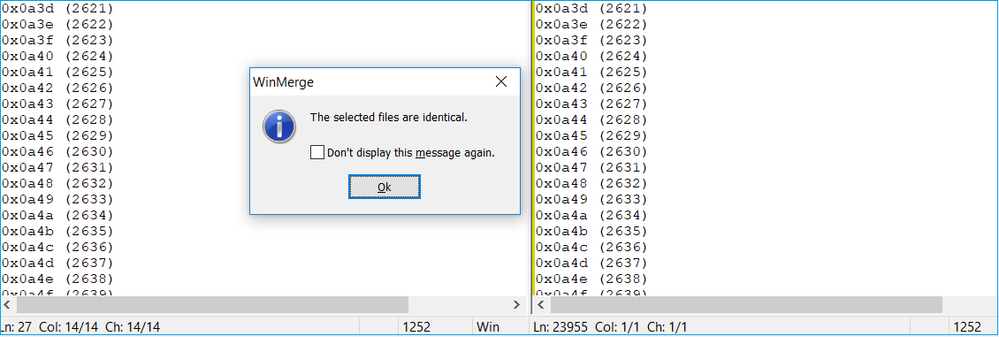
In this case, CAPI and CAPO capture for the FTP Data traffic are identical. This proves that the packet loss was not caused by the firewall.
Identify upstream/downstream packet loss.

Key Points:
1. This packet is a TCP Retransmission. Specifically, it is a TCP SYN packet sent from the client to the server for FTP Data in Passive Mode. Since the client resends the packet and you can see the initial SYN (packet #1) the packet was lost upstream to the firewall.

In this case, there is the possiblity that the SYN packet made it to the server, but the SYN/ACK packet was lost on the way back:

2. There is a packet from the server and Wireshark identified that the previous segment was not seen/captured. Since the non-captured packet was sent from the server to the client and was not seen in the firewall capture that means the packet was lost between the server and the firewall.

This indicates that there is packet loss between the FTP server and the firewall.
Action 2. Take Additional Captures.
Take additional captures along with captures at the endpoints. Try to apply the divide and conquer method to isolate further the problematic segment that causes the packet loss.
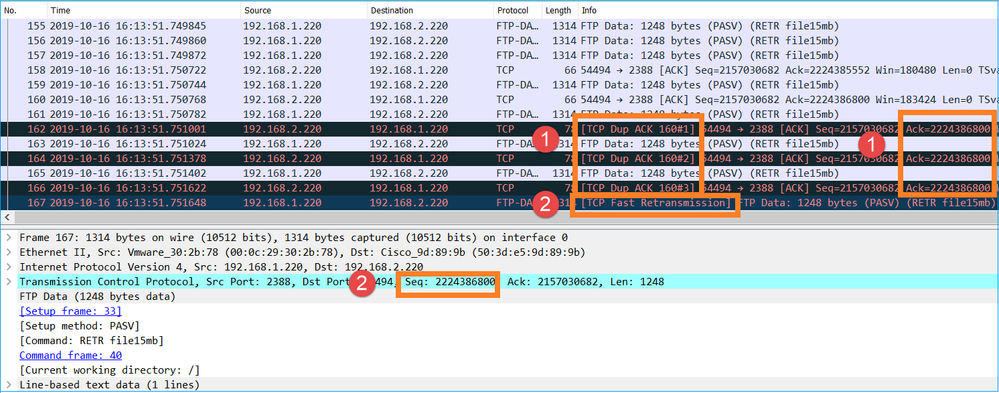
Key Points:
- The receiver (the FTP client in this case) tracks the incoming TCP sequence numbers. If it detects that a packet was missed (an expected sequence number was skipped) then it generates an ACK packet with the ACK='expected sequence number that was skipped'. In this example the Ack=2224386800.
- The Dup ACK triggers a TCP Fast Retransmission (retransmission within 20 msec after a Duplicate ACK is received).
What do Duplicate ACKs mean?
- A few duplicate ACKs but no actual retransmissions indicate that more likely there are packets that arrive out of order.
- Duplicate ACKs followed by actual retransmissions indicate that there is some amount of packet loss.
Action 3. Calculate the firewall processing time for transit packets.
Apply the same capture on 2 different interfaces:
firepower# capture CAPI buffer 33554432 interface INSIDE match tcp host 192.168.2.220 host 192.168.1.220
firepower# capture CAPI interface OUTSIDE
Export the capture check the time difference between ingress vs egress packets
Case 7. TCP Connectivity Problem (Packet Corruption)
Problem Description:
Wireless client (192.168.21.193) tries to connect to a destination server (192.168.14.250 - HTTP) and there are 2 different scenarios:
- When the client connects to Access Point (AP) 'A' then the HTTP connection does not work.
- When the client connects to Access Point (AP) 'B' then the HTTP connection works.
This image shows the topology:

Affected Flow:
Src IP: 192.168.21.193
Dst IP: 192.168.14.250
Protocol: TCP 80
Capture Analysis
Enable captures on FTD LINA engine:
firepower# capture CAPI int INSIDE match ip host 192.168.21.193 host 192.168.14.250
firepower# capture CAPO int OUTSIDE match ip host 192.168.21.193 host 192.168.14.250
Captures - Functional Scenario:
As a baseline, it is always very useful to have captures from a known-good scenario.
This image shows the capture taken on NGFW INSIDE interface

This image shows the capture taken on NGFW OUTSIDE interface.

Key Points:
- The 2 captures are almost identical (consider the ISN randomization).
- There are no indications of a packet loss.
- No Out-Of-Order (OOO) packets
- There are 3 HTTP GET Requests. The first one gets a 404 ‘Not Found’, the second one gets a 200 ‘OK’ and the third one gets a 304 ‘Not Modified’ redirection message.
Captures - Known-faulty Scenario:
The ingress capture (CAPI) contents.

Key Points:
- There is a TCP 3-way handshake.
- There are TCP retransmissions and indications of a packet loss.
- There is a packet (TCP ACK) that is identified by Wireshark as Malformed.
This image shows the egress capture (CAPO) contents.

Key Points:
The 2 captures are almost identical (consider the ISN randomization):
- There is a TCP 3-way handshake.
- There are TCP retransmissions and indications of a packet loss.
- There is a packet (TCP ACK) that is identified by Wireshark as Malformed.
Check the malformed packet:
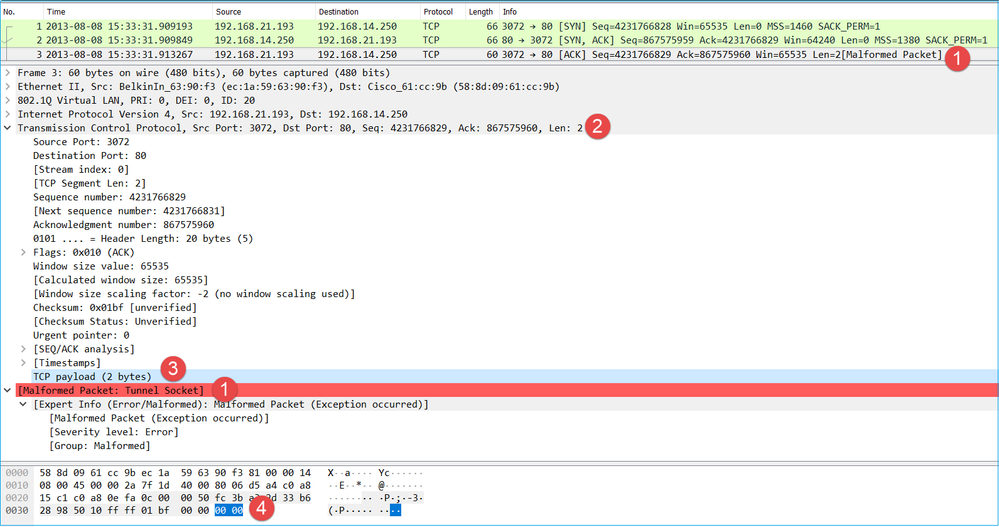
Key Points:
- The packet is identified as a Malformed by Wireshark.
- It has a length of 2 Bytes.
- There is a TCP payload of 2 Bytes.
- The payload is 4 extra zeroes (00 00).
Recommended Actions
The actions listed in this section have as a goal to further narrow down the issue.
Action 1. Take additional captures. Include captures at the endpoints and if possible, try to apply the divide and conquer method to isolate the source of the packet corruption, for example:

In this case, the 2 extra Bytes were added by the switch 'A' interface driver and the solution was to replace the switch that causes the corruption.
Case 8. UDP Connectivity Problem (Missing Packets)
Problem Description: Syslog (UDP 514) messages are not seen on the destination Syslog server.
This image shows the topology:

Affected Flow:
Src IP: 192.168.1.81
Dst IP: 10.10.1.73
Protocol: UDP 514
Capture Analysis
Enable captures on FTD LINA engine:
firepower# capture CAPI int INSIDE trace match udp host 192.168.1.81 host 10.10.1.73 eq 514
firepower# capture CAPO int OUTSIDE match udp host 192.168.1.81 host 10.10.1.73 eq 514
FTD captures show no packets:
firepower# show capture
capture CAPI type raw-data trace interface INSIDE [Capturing - 0 bytes]
  match udp host 192.168.1.81 host 10.10.1.73 eq syslog
capture CAPO type raw-data interface OUTSIDE [Capturing - 0 bytes]
  match udp host 192.168.1.81 host 10.10.1.73 eq syslog
Recommended Actions
The actions listed in this section have as a goal to further narrow down the issue.
Action 1. Check the FTD connection table.
To check a specific connection you can use this syntax:
firepower# show conn address 192.168.1.81 port 514
10 in use, 3627189 most used
Inspect Snort:
        preserve-connection: 6 enabled, 0 in effect, 74 most enabled, 0 most in effect

UDP INSIDE  10.10.1.73:514 INSIDE  192.168.1.81:514, idle 0:00:00, bytes 480379697, flags -oN1
Key Points:
- The ingress and egress interfaces are the same (U-turn).
- The number of Bytes has a significantly large value (~5 GBytes).
- The flag ‘o’ denotes flow offload (HW accelerated flow). This is the reason why the FTD captures do not show any packets. Flow offload is only supported on 41xx and 93xx platforms. In this case, the device is a 41xx.
Action 2. Take chassis-level captures.
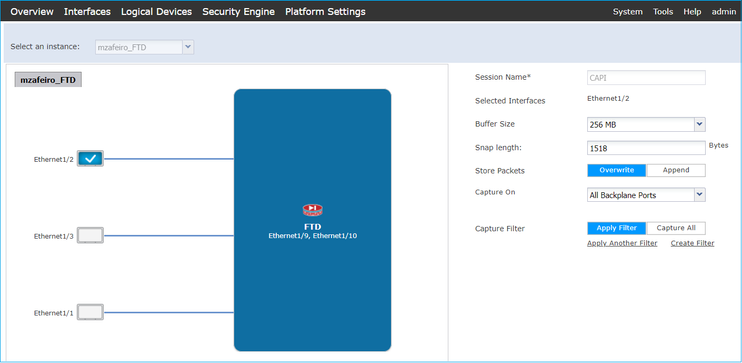
Connect to the Firepower chassis manager and enable capture on the ingress interface (E1/2 in this case) and backplane interfaces (E1/9 and E1/10), as shown in the image:

After a few seconds:

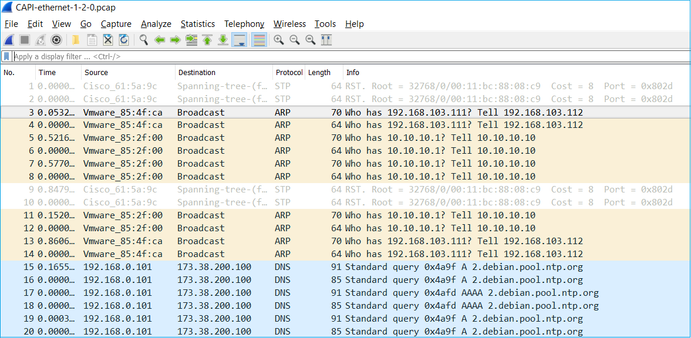
Tip: In Wireshark exclude the VN-tagged packets to eliminate the packet duplication at the physical interface level
Before:
After:
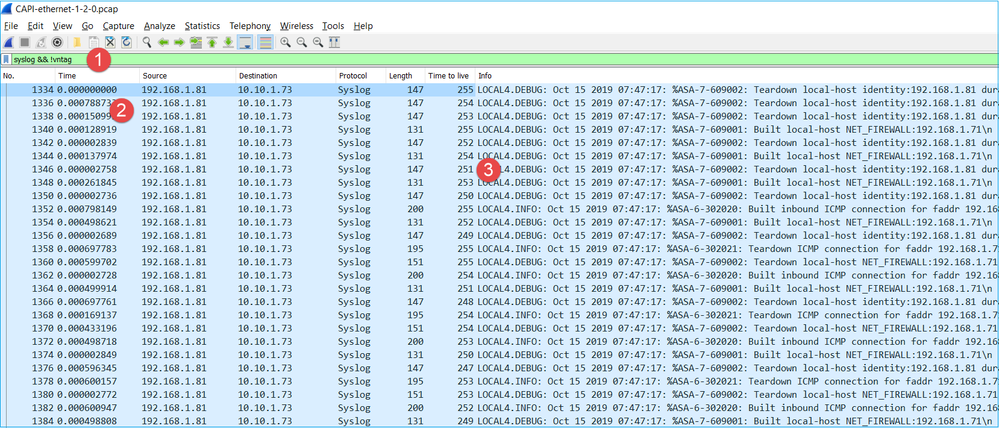
Key Points:
- A display filter is applied to remove packet duplicates and show only syslogs.
- The diff between the packets is at the microsecond level. This indicates a very high packet rate.
- The Time to Live (TTL) value decreases continuously. This indicates a packet loop.

Action 3. Use packet-tracer.
Since the packets do not traverse the firewall LINA engine you cannot do a live trace (capture w/trace), but you can trace an emulated packet with packet-tracer:
firepower# packet-tracer input INSIDE udp 10.10.1.73 514 192.168.1.81 514

Phase: 1
Type: CAPTURE
Subtype:
Result: ALLOW
Config:
Additional Information:
MAC Access list

Phase: 2
Type: ACCESS-LIST
Subtype:
Result: ALLOW
Config:
Implicit Rule
Additional Information:
MAC Access list

Phase: 3
Type: FLOW-LOOKUP
Subtype:
Result: ALLOW
Config:
Additional Information:
Found flow with id 25350892, using existing flow

Phase: 4
Type: SNORT
Subtype:
Result: ALLOW
Config:
Additional Information:
Snort Verdict: (fast-forward) fast forward this flow

Phase: 5
Type: ROUTE-LOOKUP
Subtype: Resolve Egress Interface
Result: ALLOW
Config:
Additional Information:
found next-hop 192.168.1.81 using egress ifc  INSIDE

Phase: 6
Type: ADJACENCY-LOOKUP
Subtype: next-hop and adjacency
Result: ALLOW
Config:
Additional Information:
adjacency Active
next-hop mac address a023.9f92.2a4d hits 1 reference 1

Phase: 7
Type: CAPTURE
Subtype:
Result: ALLOW
Config:
Additional Information:
MAC Access list

Result:
input-interface: INSIDE
input-status: up
input-line-status: up
output-interface: INSIDE
output-status: up
output-line-status: up
Action: allow
Action 4. Confirm the FTD routing.
Check the firewall routing table to see if there are any routing issues:
firepower# show route 10.10.1.73

Routing entry for 10.10.1.0 255.255.255.0
  Known via "eigrp 1", distance 90, metric 3072, type internal
  Redistributing via eigrp 1
  Last update from 192.168.2.72 on OUTSIDE, 0:03:37 ago
  Routing Descriptor Blocks:
  * 192.168.2.72, from 192.168.2.72, 0:02:37 ago, via OUTSIDE
      Route metric is 3072, traffic share count is 1
      Total delay is 20 microseconds, minimum bandwidth is 1000000 Kbit
      Reliability 255/255, minimum MTU 1500 bytes
      Loading 29/255, Hops 1
Key Points:
- The route points towards the correct egress interface.
- The route was learned a few minutes ago (0:02:37).
Action 5. Confirm the connection uptime.
Check the connection uptime to see when this connection was established:
firepower# show conn address 192.168.1.81 port 514 detail
21 in use, 3627189 most used
Inspect Snort:
        preserve-connection: 19 enabled, 0 in effect, 74 most enabled, 0 most in effect
Flags: A - awaiting responder ACK to SYN, a - awaiting initiator ACK to SYN,
       b - TCP state-bypass or nailed,
       C - CTIQBE media, c - cluster centralized,
       D - DNS, d - dump, E - outside back connection, e - semi-distributed,
       F - initiator FIN, f - responder FIN,
       G - group, g - MGCP, H - H.323, h - H.225.0, I - initiator data,
       i - incomplete, J - GTP, j - GTP data, K - GTP t3-response
       k - Skinny media, L - decap tunnel, M - SMTP data, m - SIP media
       N - inspected by Snort (1 - preserve-connection enabled, 2 - preserve-connection in effect)
       n - GUP, O - responder data, o - offloaded,
       P - inside back connection, p - passenger flow
       q - SQL*Net data, R - initiator acknowledged FIN,
       R - UDP SUNRPC, r - responder acknowledged FIN,
       T - SIP, t - SIP transient, U - up,
       V - VPN orphan, v - M3UA W - WAAS,
       w - secondary domain backup,
       X - inspected by service module,
       x - per session, Y - director stub flow, y - backup stub flow,
       Z - Scansafe redirection, z - forwarding stub flow

UDP INSIDE: 10.10.1.73/514 INSIDE: 192.168.1.81/514,
    flags -oN1, idle 0s, uptime 3m49s, timeout 2m0s, bytes 4801148711
Key Point:
- The connection was established ~4 minutes ago (this is before the EIGRP route installation in the routing table)
Action 6. Clear the established connection.
In this case, the packets match an established connection and are routed to a wrong egress interface; this causes a loop. This is because of the firewall order of operations:
- Established connection lookup (this takes priority over the global routing table lookup).
- Network Address Translation (NAT) lookup - UN-NAT (destination NAT) phase takes precedence over PBR and route lookup.
- Policy-Based Routing (PBR)
- Global routing table lookup
Since the connection never times out (the Syslog client continuously sends packets while the UDP conn idle timeout is 2 minutes) there is a need to manually clear the connection:
firepower# clear conn address 10.10.1.73 address 192.168.1.81 protocol udp port 514
1 connection(s) deleted.
Verify that a new connection is established:
firepower# show conn address 192.168.1.81 port 514 detail | b 10.10.1.73.*192.168.1.81
UDP OUTSIDE: 10.10.1.73/514 INSIDE: 192.168.1.81/514,
    flags -oN1, idle 1m15s, uptime 1m15s, timeout 2m0s, bytes 408
Action 7. Configure floating conn timeout.
This is the proper solution to address the issue and avoid suboptimal routing, especially for UDP flows. Navigate to Devices > Platform Settings > Timeouts and set the value:

You can find more details about the floating conn timeout in the Command Reference:
Case 9. HTTPS Connectivity Problem (Scenario 1)
Problem Description: HTTPS communication between the client 192.168.201.105 and server 192.168.202.101 cannot be established
This image shows the topology:

Affected Flow:
Src IP: 192.168.201.111
Dst IP: 192.168.202.111
Protocol: TCP 443 (HTTPS)
Capture Analysis
Enable captures on FTD LINA engine:
The IP used in the OUTSIDE capture is different due to the Port-Address Translation configuration.
firepower# capture CAPI int INSIDE match ip host 192.168.201.111 host 192.168.202.111
firepower# capture CAPO int OUTSIDE match ip host 192.168.202.11 host 192.168.202.111
This image shows the capture taken on NGFW INSIDE interface:

Key Points:
- There is a TCP 3-way handshake.
- SSL Negotiation starts. The client sends a Client Hello message.
- There is a TCP ACK sent to the client.
- There is a TCP RST sent to the client.
This image shows the capture taken on NGFW OUTSIDE interface.

Key Points:
- There is a TCP 3-way handshake.
- SSL Negotiation starts. The client sends a Client Hello message.
- There are TCP Retransmissions sent from the firewall towards the server.
- There is a TCP RST sent to the server.
Recommended Actions
The actions listed in this section have as a goal to further narrow down the issue.
Action 1. Take additional captures.
A capture taken on the server reveals that the server received the TLS Client Hellos with corrupted TCP checksum and silently drops them (there is no TCP RST or any other reply packet towards the client):

When you put everything together:
In this case, to understand, there is a need to enable on Wireshark the Validate the TCP checksum if possible option. Navigate to Edit > Preferences > Protocols > TCP, as shown in the image.
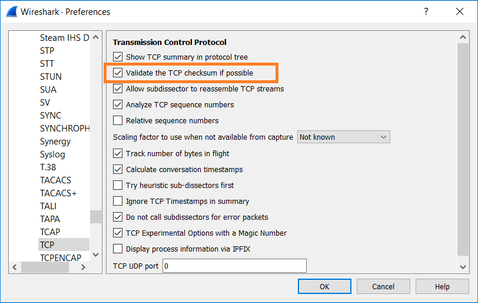
In this case, it is helpful to put the captures side-by-side in order to get the full picture:

Key Points:
- There is a TCP 3-way handshake. The IP IDs are the same. This means the flow was not proxied by the firewall.
- A TLS Client Hello comes from the client with IP ID 12083. The packet is proxied by the firewall (the firewall, in this case, was configured with TLS Decryption Policy) and the IP ID is changed to 52534. Additionally, the packet TCP checksum gets corrupted (due to a software defect that later got fixed).
- The firewall is in TCP Proxy mode and sends an ACK to the client (which spoofs the server).
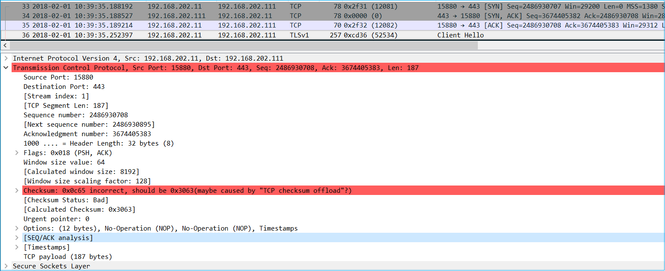
- The firewall does not receive any TCP ACK packet from the server and retransmits the TLS Client Hello message. This is again due to TCP Proxy mode that the firewall activated.
- After ~30 seconds the firewall gives up and sends a TCP RST towards the client.
- The firewall sends a TCP RST towards the server.
For reference:
Firepower TLS/SSL Handshake Processing
Case 10. HTTPS Connectivity Problem (Scenario 2)
Problem Description: FMC Smart License registration fails.

This image shows the topology:

Affected Flow:
Src IP: 192.168.0.100
Dst: tools.cisco.com
Protocol: TCP 443 (HTTPS)
Capture Analysis
Enable capture on the FMC management interface:

Try to register again. Once the Error message appears press CTRL-C to stop the capture:
root@firepower:/Volume/home/admin# tcpdump -i eth0 port 443 -s 0 -w CAP.pcap
HS_PACKET_BUFFER_SIZE is set to 4.
tcpdump: listening on eth0, link-type EN10MB (Ethernet), capture size 262144 bytes
^C264 packets captured				<- CTRL-C
264 packets received by filter
0 packets dropped by kernel
root@firepower:/Volume/home/admin#
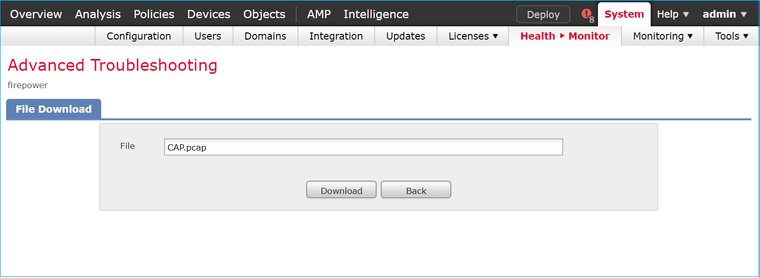
Collect the capture from the FMC (System > Health > Monitor, select the device and select Advanced Troubleshooting), as shown in the image:
The image shows the FMC capture on Wireshark:

Tip: In order to check for all new TCP sessions that were captured, use the tcp.flags==0x2 display filter on Wireshark. This filters all the TCP SYN packets that were captured.

Tip: Apply as Column the Server Name field from the SSL Client Hello.
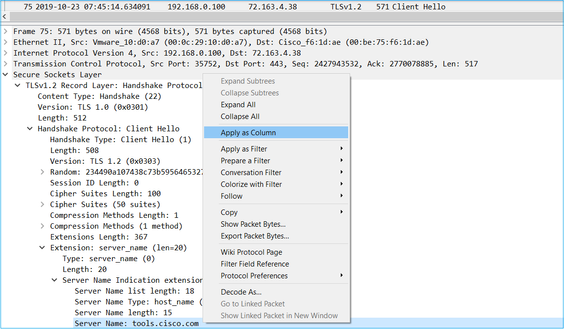
Tip: Apply this display filter to see only the Client Hello messages ssl.handshake.type == 1

Note: At the time of this writing, the Smart Licensing portal (tools.cisco.com) uses these IPs: 72.163.4.38, 173.37.145.8
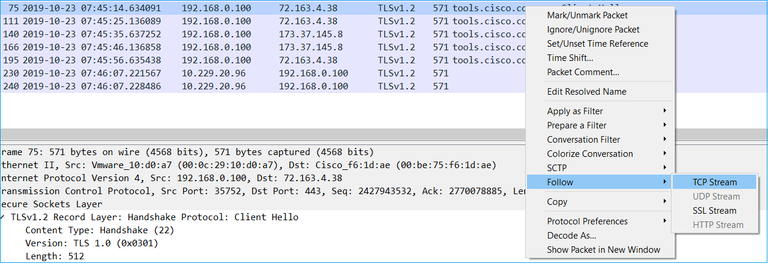
Follow one of the TCP flows (Follow > TCP Stream), as shown in the image.
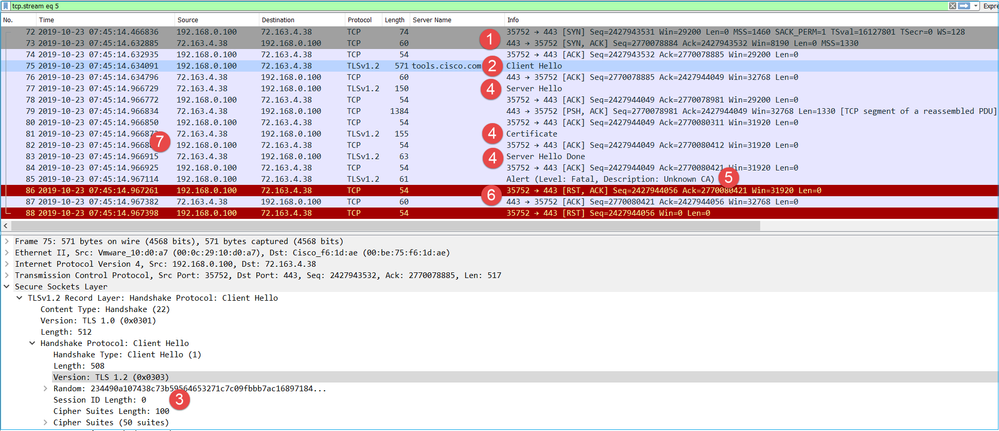
Key Points:
- There is a TCP 3-way handshake.
- The client (FMC) sends an SSL Client Hello message towards the Smart Licensing portal.
- The SSL Session ID is 0. This means that it is not a resumed session.
- The destination server replies with Server Hello, Certificate and Server Hello Done message.
- The client sends an SSL Fatal Alert which regards an ‘Unknown CA’.
- The client sends a TCP RST to close the session.
- The whole TCP session duration (from establishment to closure) was ~0.5 sec.
Select the Server Certificate and expand the issuer field to see the commonName. In this case the Common Name reveals a device that does Man-in-the-middle (MITM).
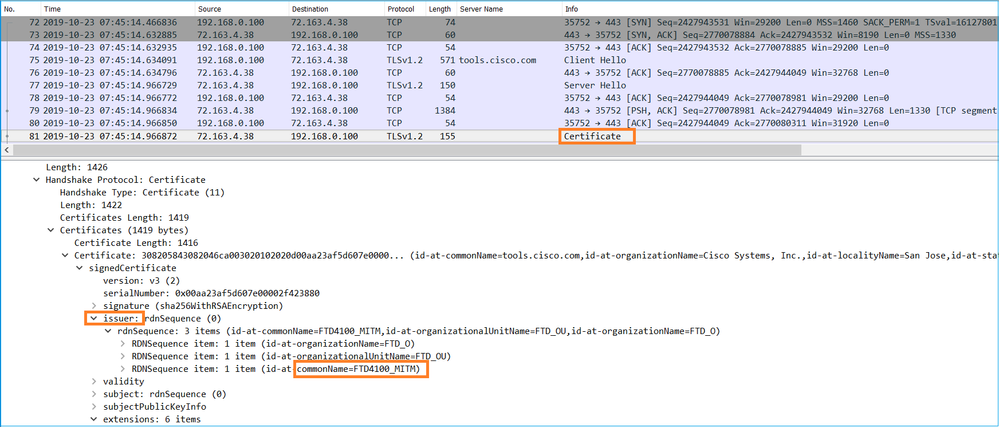
This is shown in this image:

Recommended Actions
The actions listed in this section have as a goal to further narrow down the issue.
Action 1. Take additional captures.
Take captures on the transit firewall device:

CAPI shows:
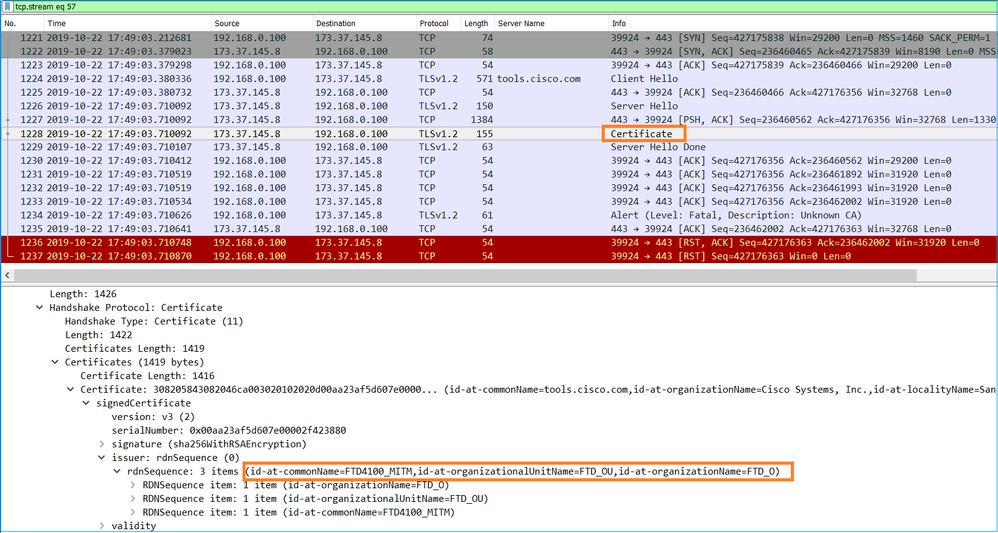
CAPO shows:
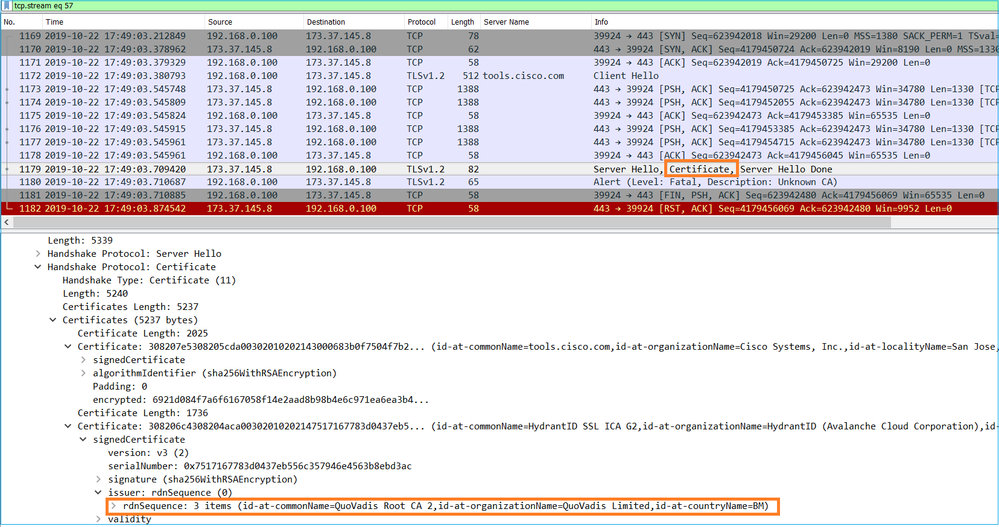
These captures prove that the transit firewall modifies the server certificate (MITM)
Action 2. Check the device logs.
You can collect the FMC TS bundle as described in this document:
In this case, the /dir-archives/var-log/process_stdout.log file show messages like this:
SOUT: 10-23 05:45:14 2019-10-23 05:45:36 sla[10068]: *Wed .967 UTC: CH-LIB-ERROR: ch_pf_curl_send_msg[494],
failed to perform, err code 60, err string "SSL peer certificate or SSH remote key was not OK"
...
SOUT: 10-23 05:45:14 2019-10-23 05:45:36 sla[10068]: *Wed .967 UTC: CH-LIB-TRACE: ch_pf_curl_is_cert_issue[514],
cert issue checking, ret 60, url "https://tools.cisco.com/its/
Recommended Solution
Disable the MITM for the specific flow so that FMC can successfully register to the Smart Licensing cloud.
Case 11. IPv6 Connectivity Problem
Problem Description: Internal hosts (located behind the firewall’s INSIDE interface) cannot communicate with external hosts (hosts located behind firewall’s OUTSIDE interface).
This image shows the topology:

Affected Flow:
Src IP: fc00:1:1:1::100
Dst IP: fc00:1:1:2::2
Protocol: any
Capture Analysis
Enable captures on FTD LINA engine.
firepower# capture CAPI int INSIDE match ip any6 any6
firepower# capture CAPO int OUTSIDE match ip any6 any6

Captures - Non-functional Scenario
These captures were taken in parallel with an ICMP connectivity test from IP fc00:1:1:1::100 (inside router) to IP fc00:1:1:2::2 (upstream router).
The capture on firewall INSIDE interface contains:

Key Points:
- The router sends an IPv6 Neighbor Solicitation message and asks for the MAC address of the upstream device (IP fc00:1:1:1::1).
- The firewall replies with an IPv6 Neighbor Advertisement.
- The router sends an ICMP Echo Request.
- The firewall sends an IPv6 Neighbor Solicitation message and asks for the MAC address of the downstream device (fc00:1:1:1::100).
- The router replies with an IPv6 Neighbor Advertisement.
- The router sends additional IPv6 ICMP Echo Requests.
The capture on firewall OUTSIDE interface contains:

Key Points:
- The firewall sends an IPv6 Neighbor Solicitation message which asks for the MAC address of the upstream device (IP fc00:1:1:2::2).
- The router replies with an IPv6 Neighbor Advertisement.
- The firewall sends an IPv6 ICMP Echo Request.
- The upstream device (router fc00:1:1:2::2) sends an IPv6 Neighbor Solicitation message which asks for the MAC address of the IPv6 address fc00:1:1:1::100.
- The firewall sends an additional IPv6 ICMP Echo Request.
- The upstream router sends an additional IPv6 Neighbor Solicitation message which asks for the MAC address of the IPv6 address fc00:1:1:1::100.
Point 4 is very interesting. Normally the upstream router asks for the MAC of the firewall OUTSIDE interface (fc00:1:1:2::2), but instead, it asks for the fc00:1:1:1::100. This is an indication of a misconfiguration.
Recommended Actions
The actions listed in this section have as a goal to further narrow down the issue.
Action 1. Check the IPv6 Neighbor Table.
The firewall IPv6 Neighbor Table is properly populated.
firepower# show ipv6 neighbor | i fc00
fc00:1:1:2::2                              58 4c4e.35fc.fcd8  STALE OUTSIDE
fc00:1:1:1::100                            58 4c4e.35fc.fcd8  STALE INSIDE
Action 2. Check the IPv6 Configuration.
This is the firewall configuration.
firewall# show run int e1/2
!
interface Ethernet1/2
 nameif INSIDE
 cts manual
  propagate sgt preserve-untag
  policy static sgt disabled trusted
 security-level 0
 ip address 192.168.0.1 255.255.255.0
 ipv6 address fc00:1:1:1::1/64
 ipv6 enable

firewall# show run int e1/3.202
!
interface Ethernet1/3.202
 vlan 202
 nameif OUTSIDE
 cts manual
  propagate sgt preserve-untag
  policy static sgt disabled trusted
 security-level 0
 ip address 192.168.103.96 255.255.255.0
 ipv6 address fc00:1:1:2::1/64
 ipv6 enable
The upstream device configuration reveals the misconfiguration:
Router# show run interface g0/0.202
!
interface GigabitEthernet0/0.202
 encapsulation dot1Q 202
 vrf forwarding VRF202
 ip address 192.168.2.72 255.255.255.0
 ipv6 address FC00:1:1:2::2/48
Captures - Functional Scenario
The subnet mask change (from /48 to /64) fixed the issue. This is the CAPI capture in the functional scenario.

Key Point:
- The router sends an IPv6 Neighbor Solicitation message which asks for the MAC address of the upstream device (IP fc00:1:1:1::1).
- The firewall replies with an IPv6 Neighbor Advertisement.
- The router sends ICMP Echo Requests and gets Echo Replies.
CAPO contents:

Key Points:
- The firewall sends an IPv6 Neighbor Solicitation message which asks for the MAC address of the upstream device (IP fc00:1:1:2::2).
- The firewall replies with an IPv6 Neighbor Advertisement.
- The firewall sends an ICMP Echo Request.
- The router sends an IPv6 Neighbor Solicitation message which asks for the MAC address of the downstream device (IP fc00:1:1:1::1).
- The firewall replies with an IPv6 Neighbor Advertisement.
- The firewall sends ICMP Echo Requests and gets Echo Replies.
Case 12. Intermittent Connectivity Problem (ARP Poisoning)
Problem Description: Internal hosts (192.168.0.x/24) have intermittent connectivity issues with hosts in the same subnet
This image shows the topology:

Affected Flow:
Src IP: 192.168.0.x/24
Dst IP: 192.168.0.x/24
Protocol: any
The ARP cache of an internal host seems to be poisoned:
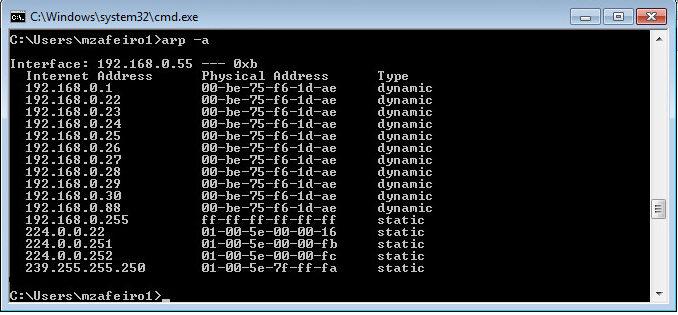
Capture Analysis
Enable a capture on FTD LINA engine
This capture only captures ARP packets on the INSIDE interface:
firepower# capture CAPI_ARP interface INSIDE ethernet-type arp

Captures - Non-functional Scenario:
The capture on the firewall INSIDE interface contains.
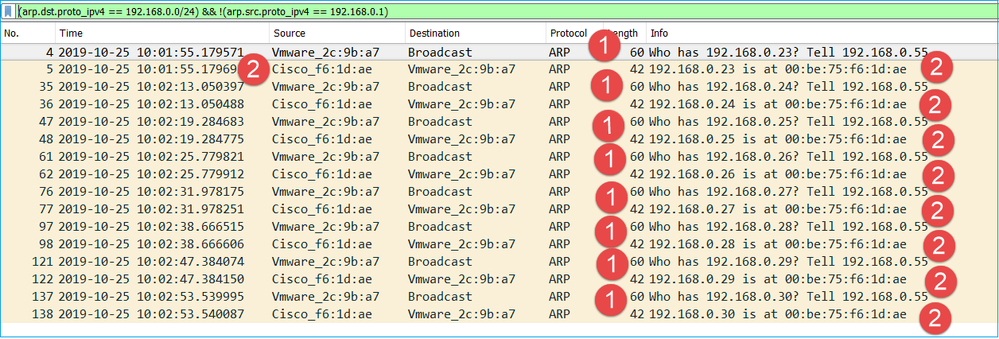
Key Points:
- The firewall receives various ARP requests for IPs within 192.168.0.x/24 network
- The firewall replies to all of them (proxy-ARP) with its own MAC address
Recommended Actions
The actions listed in this section have as a goal to further narrow down the issue.
Action 1. Check the NAT configuration.
With regard to the NAT configuration, there are cases where the no-proxy-arp keyword can prevent the earlier behavior:
firepower# show run nat
nat (INSIDE,OUTSIDE) source static NET_1.1.1.0 NET_2.2.2.0 destination static NET_192.168.0.0 NET_4.4.4.0 no-proxy-arp
Action 2. Disable the proxy-arp functionality on the firewall interface.
If the ‘no-proxy-arp’ keyword does not solve the problem, try to disable proxy ARP on the interface itself. In case of FTD, at the time of this writing, you have to use FlexConfig and deploy the command (specify the appropriate interface name).
sysopt noproxyarp INSIDE
Case 13. Identify SNMP Object Identifiers (OIDs) that cause CPU Hogs
This case demonstrates how certain SNMP OIDs for memory polling were identified as the root cause of CPU hogs (performance issue) based on the analysis of SNMP version 3 (SNMPv3) packet captures.
Problem Description: Overruns on data interfaces continuously increase. Further research revealed that there are also CPU hogs (caused by the SNMP process) which are the root cause of the interface overruns.
Next step in the troubleshoot process was to identify the root cause of the CPU hogs caused by the SNMP process and in particular, narrow down the scope of the issue to identify the SNMP Object Identifiers (OID) which, when polled, could potentially result in CPU hogs.
Currently, the FTD LINA engine does not provide a 'show' command for SNMP OIDs that are polled in real-time.
The list of SNMP OIDs for polling can be retrieved from the SNMP monitoring tool, however, in this case, there were these preventive factors:
- The FTD administrator did not have access to the SNMP monitoring tool
- SNMP version 3 with authentication and data encryption for privacy was configured on FTD
Capture Analysis
Since the FTD administrator had the credentials for the SNMP version 3 authentication and data encryption, this action plan was proposed:
- Take SNMP packet captures
- Save the captures and use Wireshark SNMP protocol preferences to specify the SNMP version 3 credentials to decrypt the SNMP version 3 packets. The decrypted captures are used for the analysis and retrieval of SNMP OIDs
Configure SNMP packet captures on the interface that is used in snmp-server host configuration:
firepower# show run snmp-server  | include host
snmp-server host management 192.168.10.10 version 3 netmonv3


firepower# show ip address management
System IP Address:
Interface                Name                   IP address      Subnet mask     Method
Management0/0            management             192.168.5.254   255.255.255.0   CONFIG
Current IP Address:
Interface                Name                   IP address      Subnet mask     Method
Management0/0            management             192.168.5.254   255.255.255.0   CONFIG

firepower# capture capsnmp interface management buffer 10000000 match udp host 192.168.10.10  host 192.168.5.254 eq snmp

firepower# show capture capsnmp

capture capsnmp type raw-data buffer 10000000 interface outside [Capturing - 9512 bytes]
  match udp host 192.168.10.10  host 192.168.5.254 eq snmp
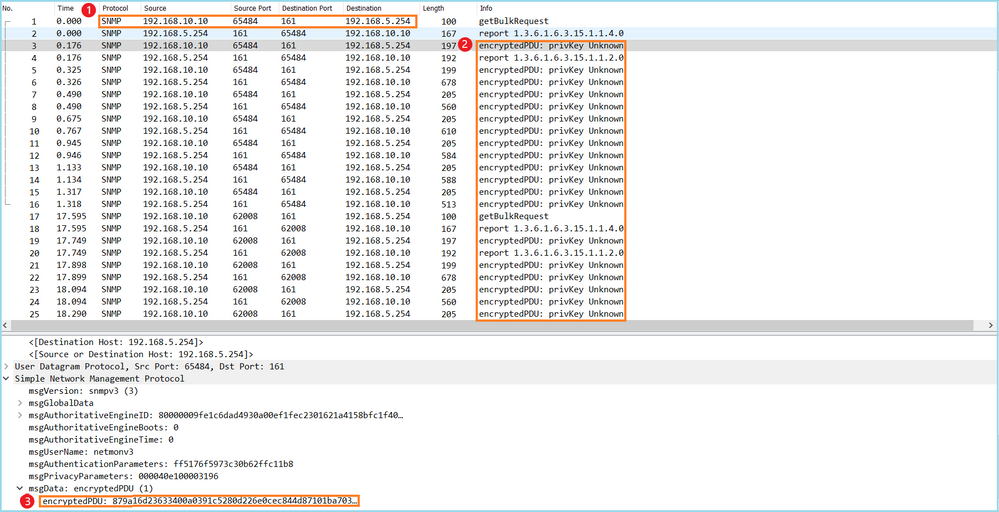
Key points:
- SNMP source and destination addresses/ports.
- The SNMP protocol PDU could not be decoded because privKey is unknown to Wireshark.
- The value of the encryptedPDU primitive.
Recommended Actions
The actions listed in this section have as a goal to further narrow down the issue.
Action 1. Decrypt the SNMP captures.
Save the captures and edit the Wireshark SNMP protocol preferences to specify the SNMP version 3 credentials to decrypt the packets.
firepower# copy /pcap capture: tftp:
Source capture name [capsnmp]?

Address or name of remote host []? 192.168.10.253

Destination filename [capsnmp]? capsnmp.pcap
!!!!!!
64 packets copied in 0.40 secs
Open the capture file on Wireshark, select an SNMP packet and navigate to Protocol Preferences > Users Table, as shown in the image:
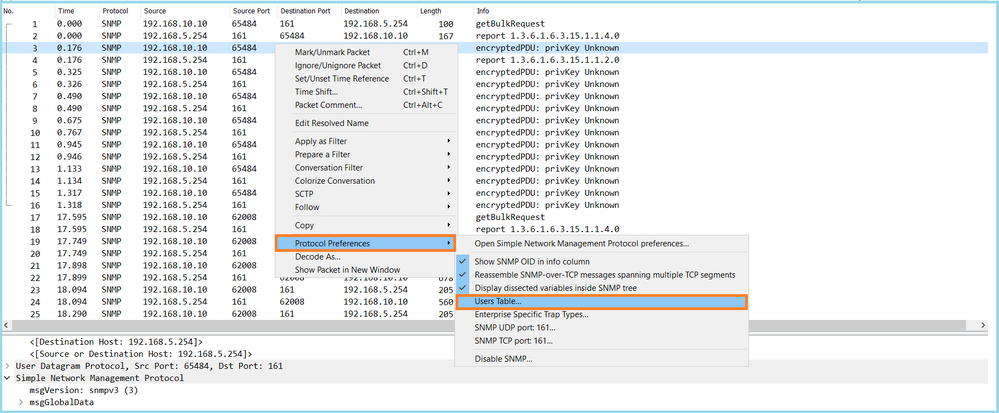
In the SNMP Users table the SNMP version 3 Username, Authentication model, Authentication Password, Privacy protocol and the Privacy password were specified (actual credentials are not shown below):
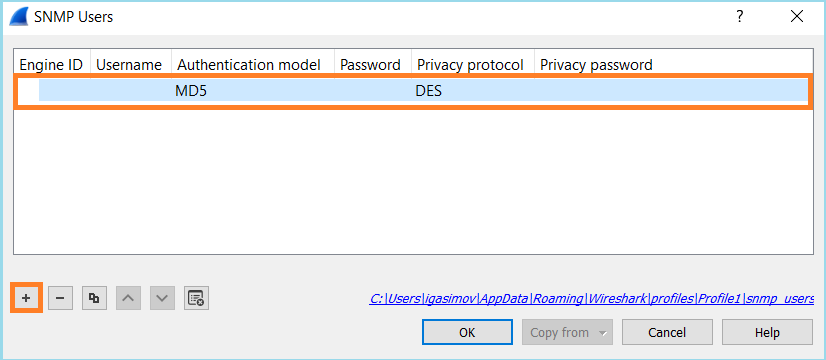
Once SNMP Users settings were applied Wireshark showed decrypted SNMP PDUs:
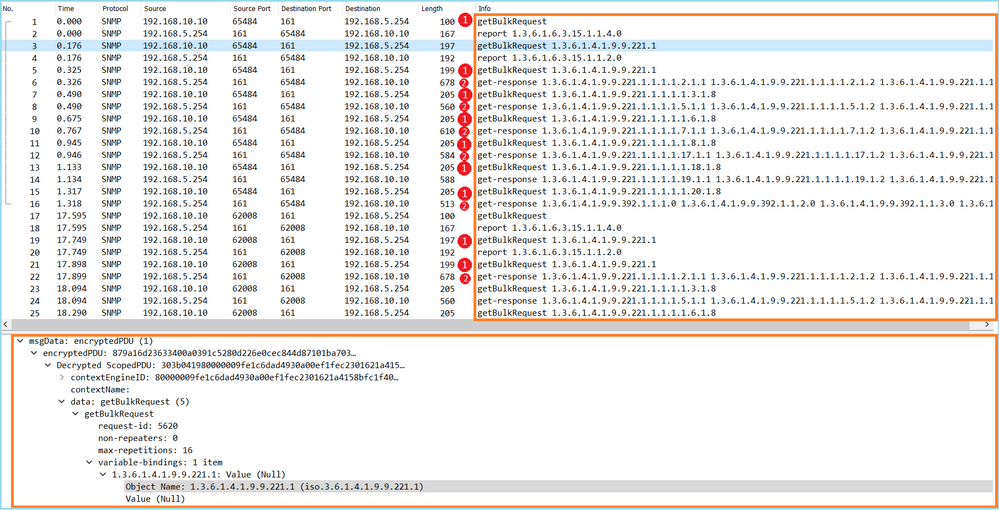
Key points:
- The SNMP monitoring tools used SNMP getBulkRequest to query and walk over the parent OID 1.3.6.1.4.1.9.9.221.1 and related OIDs.
- The FTD responded to each getBulkRequest with get-response that contain OIDs related to 1.3.6.1.4.1.9.9.221.1.
Action 2. Identify the SNMP OIDs.
SNMP Object Navigator showed that OID 1.3.6.1.4.1.9.9.221.1 belongs to the management information base (MIB) named CISCO-ENHANCED-MEMPOOL-MIB, as shown in the image:
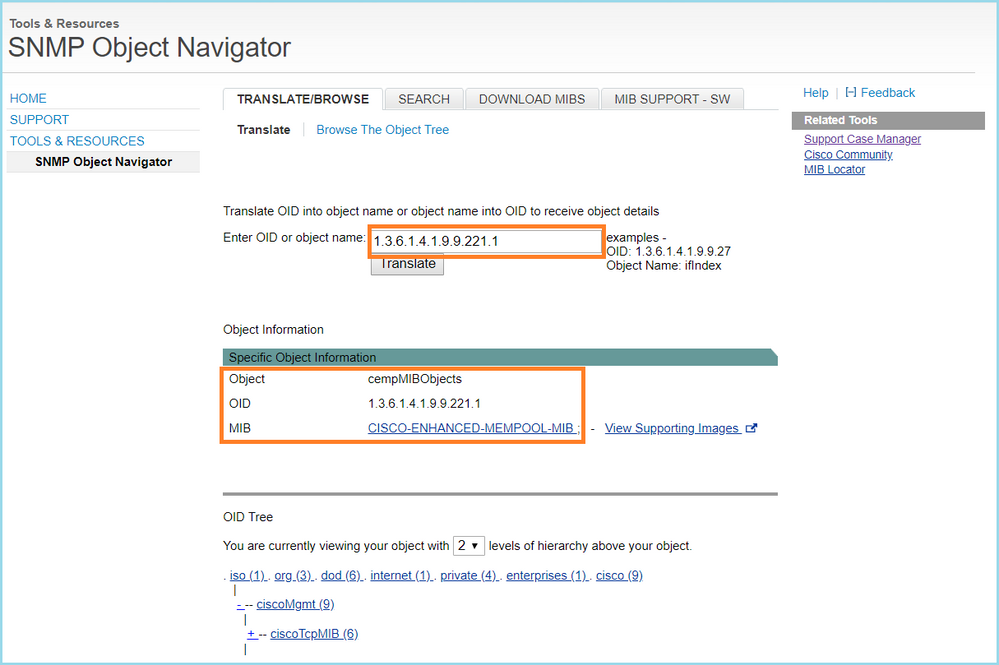
To display the OIDs in human-readable format in Wireshark:
- Download the MIB CISCO-ENHANCED-MEMPOOL-MIB and its dependencies, as shown in the image:
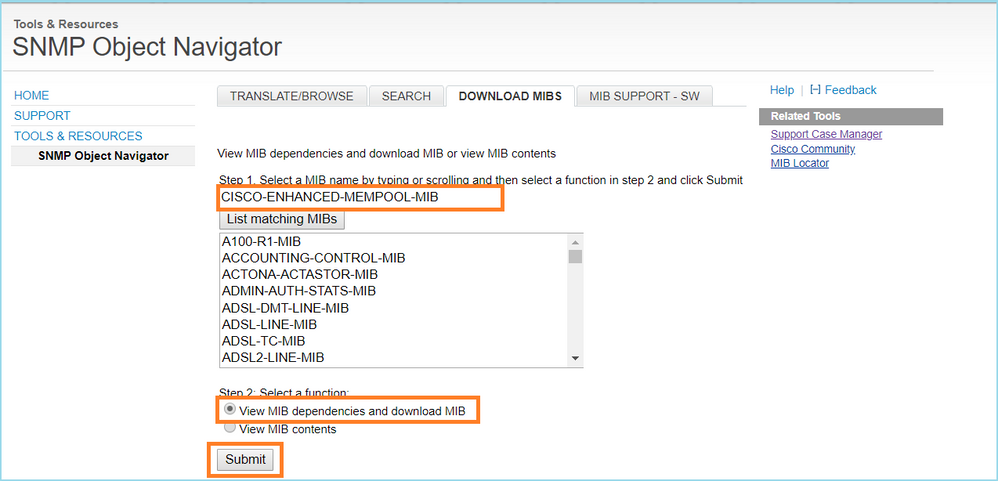
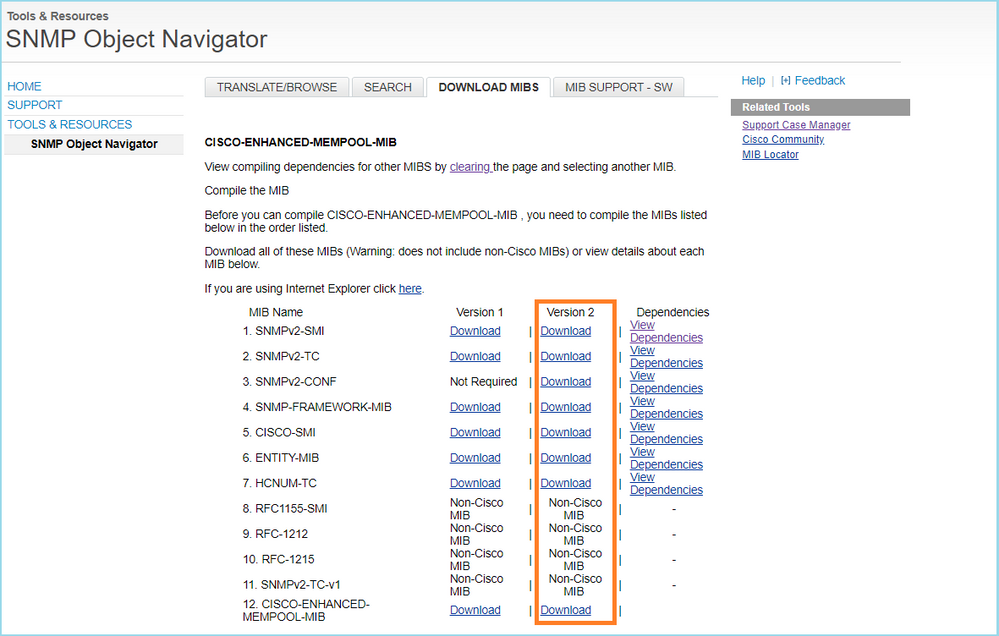
2. In Wireshark in Edit > Preferences > Name Resolution window the Enable OID Resolution is checked. In SMI (MIB and PIB paths) window specify the folder with the downloaded MIBs and in SMI (MIB and PIB modules). The CISCO-ENHANCED-MEMPOOL-MIB is added automatically to the list of modules:
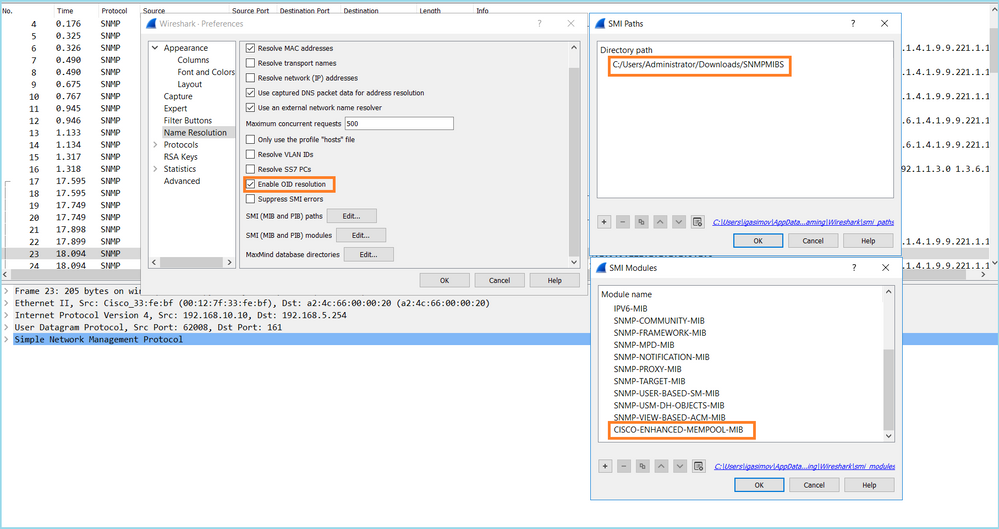
3. Once Wireshark is restarted, OID resolution is activated:
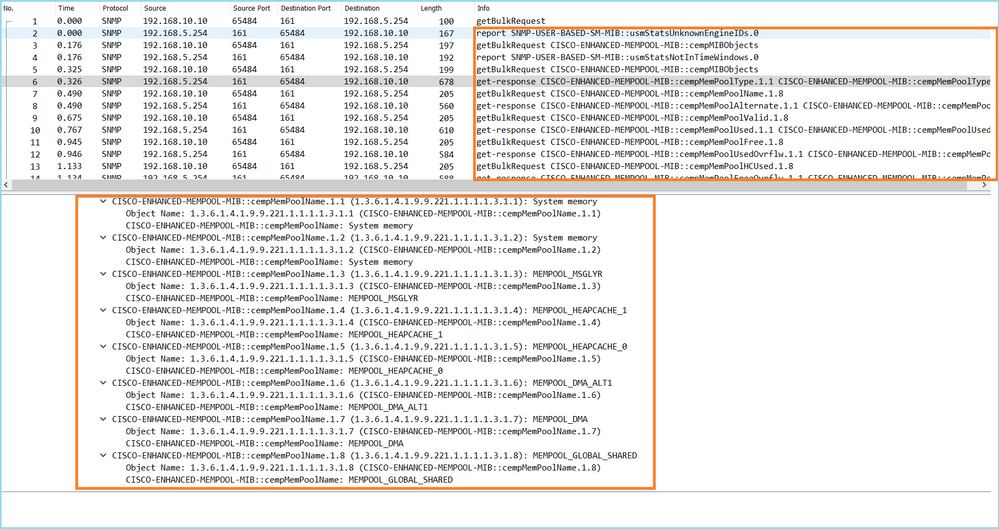
Based on the decrypted output of the capture file the SNMP monitoring tool was periodically (10 seconds interval) polling data about the utilization of memory pools on the FTD. As explained in the TechNote article ASA SNMP Polling for Memory-Related Statistics , polling the Global Shared Pool (GSP) utilization with SNMP results in high CPU usage. In this case from the captures, it was clear that the Global Shared Pool utilization was periodically polled as part of SNMP getBulkRequest primitive.
In order to minimize the CPU hogs caused by the SNMP process, it was recommended to follow the mitigation steps for the CPU Hogs for SNMP mentioned in the article and avoid to poll the OIDs related to GSP. Without the SNMP poll for the OIDs that relate to GSP no CPU hogs caused by the SNMP process were observed and the rate of overruns significantly decreased.
Related Information
Revision History
| Revision | Publish Date | Comments |
|---|---|---|
3.0 |
31-Jul-2024 |
Recertification, Alt Text, fixed headers, punctuation, and html SEO optimization. |
2.0 |
02-Jun-2023 |
Recertification |
1.0 |
21-Nov-2019 |
Initial Release |
Contributed by Cisco Engineers
- Mikis ZafeiroudisCustomer Delivery Engineering Technical Leader
- Ilkin GasimovCustomer Delivery Engineering Technical Leader
Contact Cisco
- Open a Support Case

- (Requires a Cisco Service Contract)
 Feedback