Introduction
This document describes how to configure Syslog within the Firepower Device Manager (FDM).
Prerequisites
Requirements
Cisco recommends that you have knowledge of these topics:
- Firepower Threat Defense
- Syslog Server running Syslog Software to collect data
Configurations
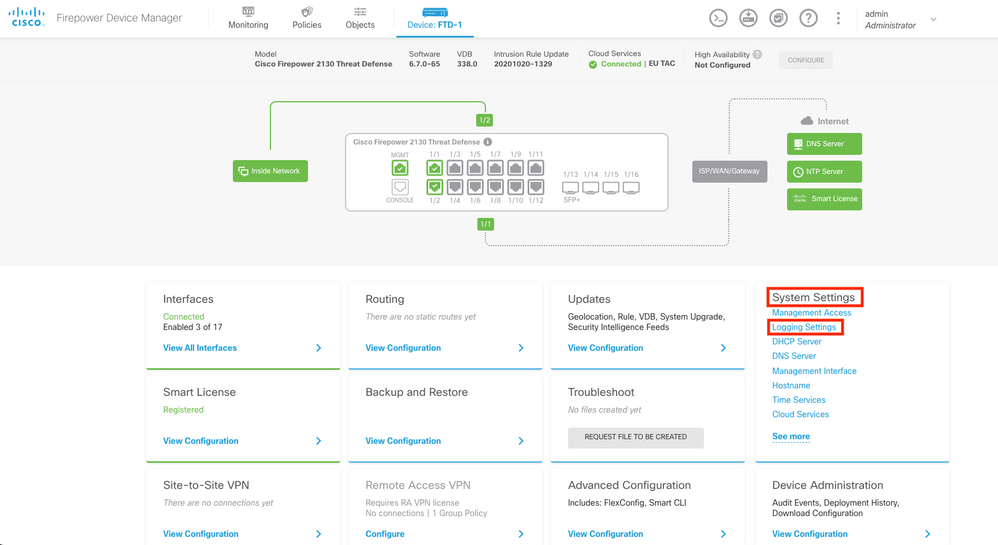
Step 1. From the Main Firepower Device Manager screen, select the Logging Settings under the System Settings in the lower right corner of the screen.
Step 2. On the System Settings screen, select the Logging Settings in the left menu.
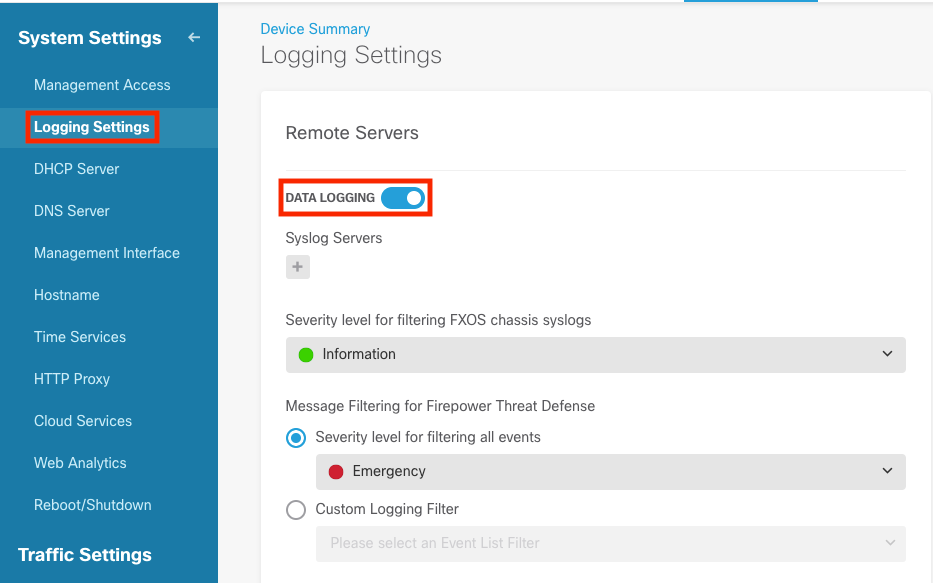
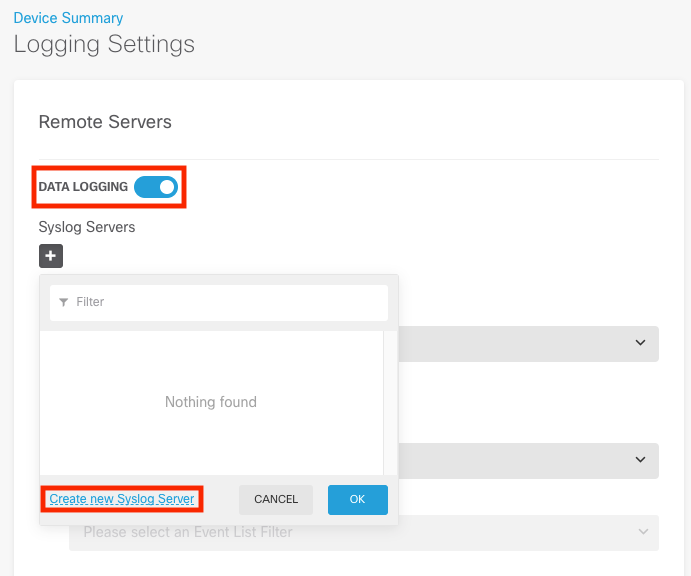
Step 3. Set the Data Logging toggle switch, select the + sign under Syslog Servers.
Step 4. Select Add Syslog Server. Alternatively, you can create the Syslog Server object in Objects - Syslog Servers.
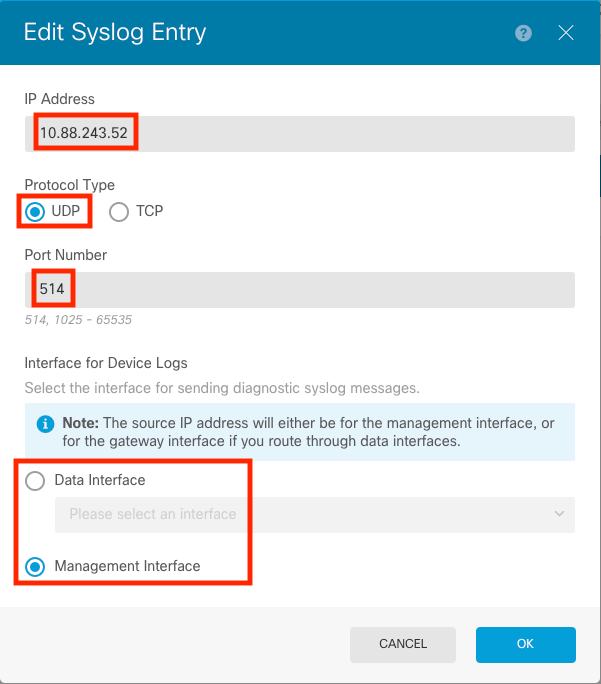
Step 5. Enter the IP address of your Syslog Server and port number. Select the radio button for Data Interface and click OK.
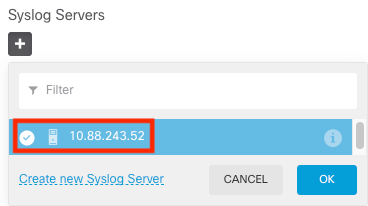
Step 6. Select the new Syslog server and click OK.
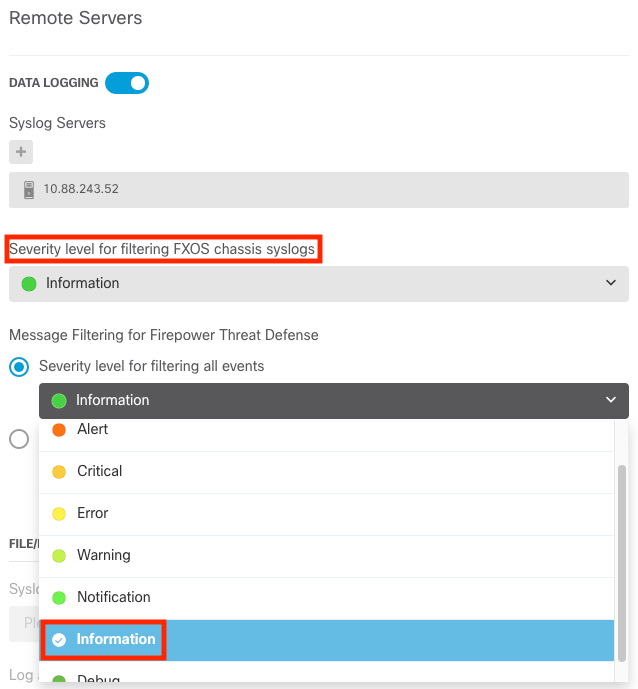
Step 7. Select the Severity level to filter with the all events radio button and select your desired logging level.
Step 8. Click Save at the bottom of the screen.

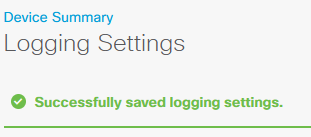
Step 9. Verify the settings were successful.
Step 10. Deploy the new settings.

And
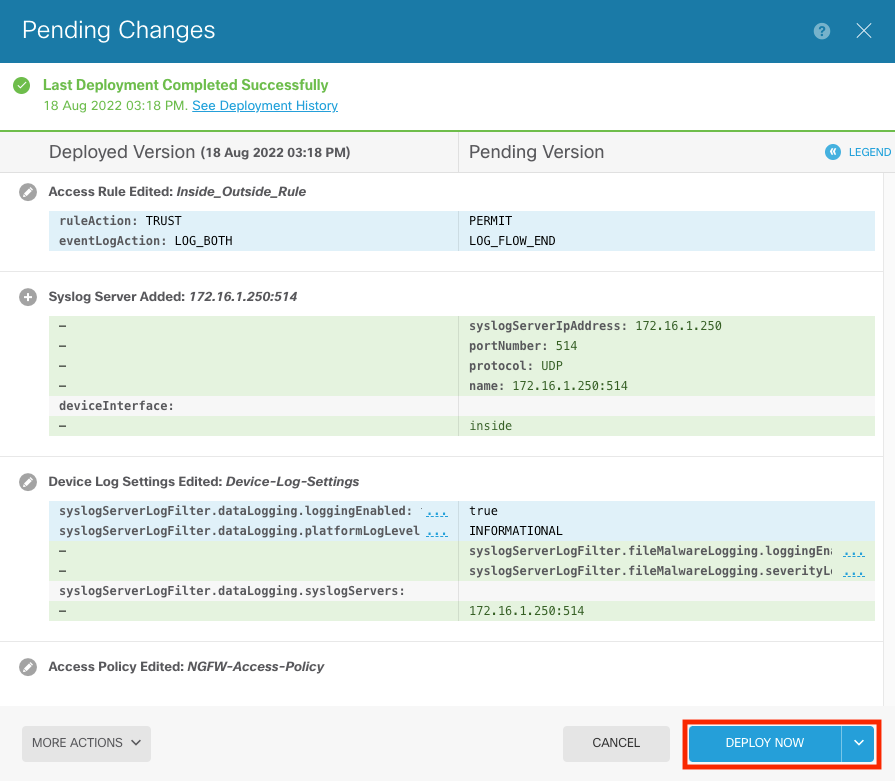
OPTIONAL.
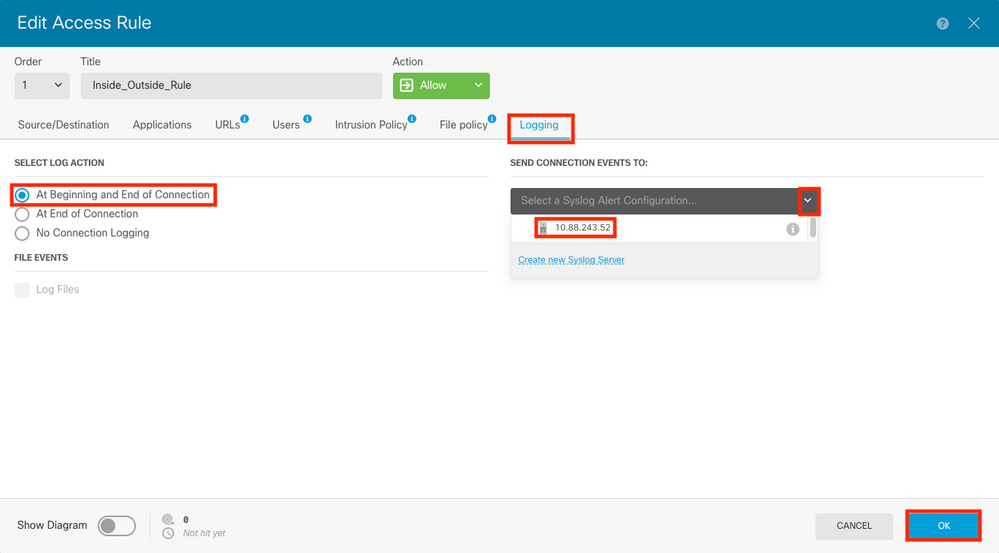
Additionally, the Access Control Policy access control rules can be set to log into the Syslog server:
Step 1. Click Policies at the top of the screen.

Step 2. Hover over the right side of the ACP rule to add logging and select the pencil icon.

Step 3. Select the Logging tab, Select the radio button for At End of Connection, Select the drop-down arrow under Select a Syslog Alert Configuration, select the Syslog Server and click OK.
Step 4. Deploy the configuration changes.
Verify
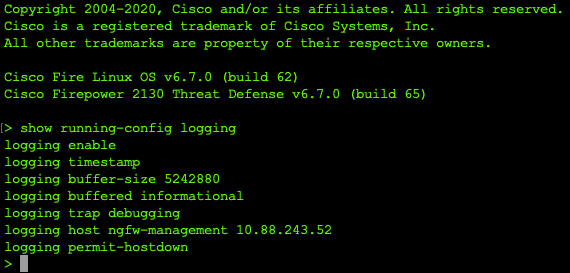
Step 1. After the task completes, verify the settings in the FTD CLI Clish Mode with the show running-config logging command.
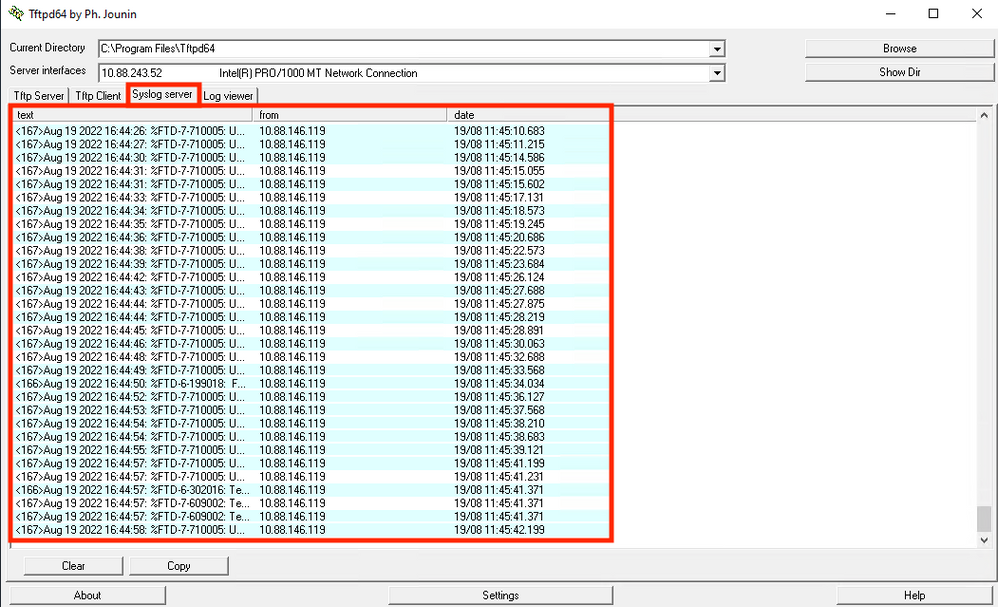
Step 2. Navigate to the Syslog server and verify that the Syslog server application accepts the Syslog messages.
Troubleshoot
Step 1. If the Syslog messages on the Syslog application produce any messages, perform a packet capture from the FTD CLI to check for packets. Enter the system support diagnostic-cli command at the clish prompt to change from Clish mode to Lina.

Step 2. Create one packet capture for your udp 514 (or tcp 1468 if you used tcp)
Step 3. Verify that the communication gets to the network interface card on the Syslog Server. Use Wireshark or another packet that captures the utility loaded. Double-click the interface in Wireshark for the Syslog Server to start packet capture.
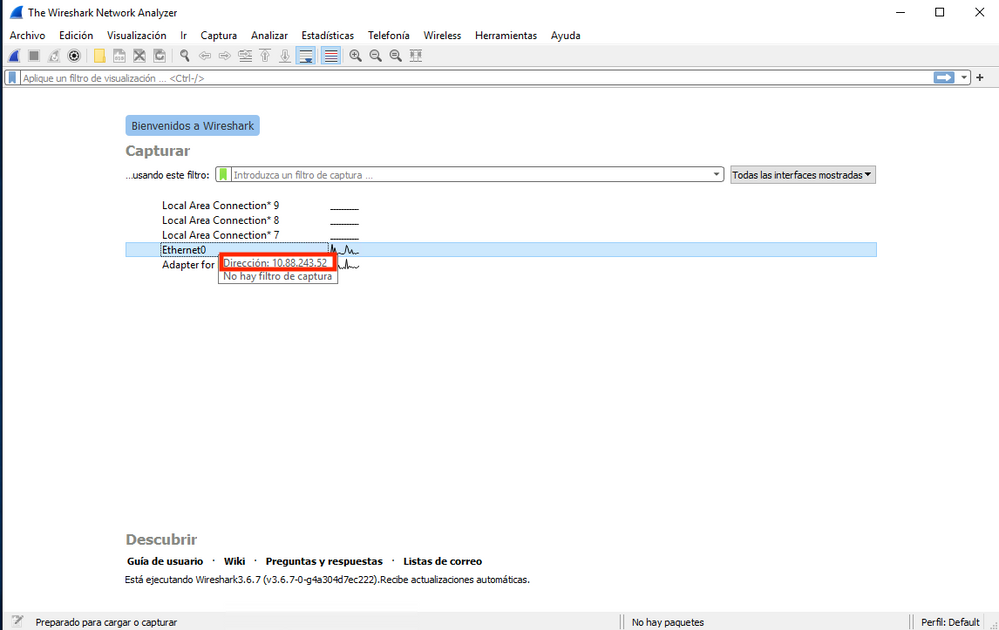
Step 4. Set a display filter in the top bar for udp 514; type udp.port==514 and select the arrow to the right of the bar. From the output, verify that the packets can make it to the Syslog Server.
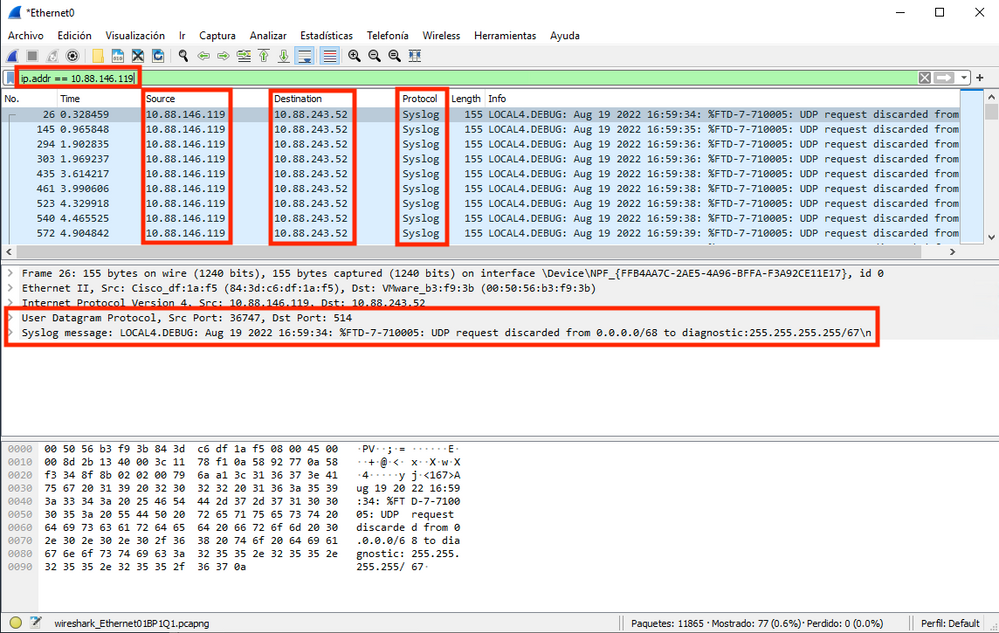
Step 5. If the Syslog Server Application does not show the data, troubleshoot the setting within the Syslog Server application. Make sure that the correct protocol is used, udp/tcp and the correct port, 514/1468.
Related Information


 Feedback