Introduction
This document describes the steps to generate the Debug Bundle file from Cisco Secure Endpoint Connector.
Prerequisites
Requirements
Cisco recommends that you have knowledge of Cisco Secure Endpoint Connector.
Components Used
The information used in the document is based on these software versions:
- Microsoft Windows Operative System
- Cisco Secure Endpoint Connector 6.3.7 and later
The information in this document was created from the devices in a specific lab environment. All of the devices used in this document started with a cleared (default) configuration. If your network is live, ensure that you understand the potential impact of any command.
Background Information
If you experience a performance issue with Cisco Secure Endpoint Connector in Microsoft Windows Operative System, you can contact the Cisco Technical Assistance Center (TAC). Cisco Technical Support Engineer proceeds to analyze the logs available in the Debug Bundle file in order to find the root issue.
Note: If you reboot the device, enable Debug mode from the IP Tray interface or it does not survive reboot. In case of a reboot, you can enable Debug mode from the policy configuration in the Secure Endpoint console.
Collect Debug Logs File in Cisco Secure Endpoint for Windows
Version 7.5.5 and lower
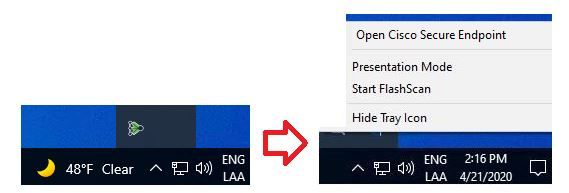
Step 1. Use the Tray Icon on the taskbar, select Open Cisco Secure Endpoint, as shown in the image.
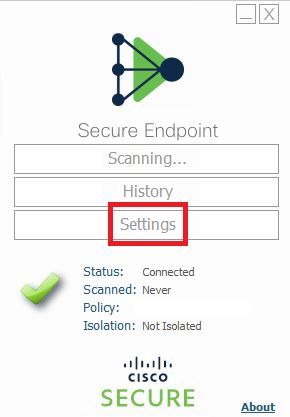
Step 2. Select the Settings option in Secure Endpoint Connector, as shown in the image.
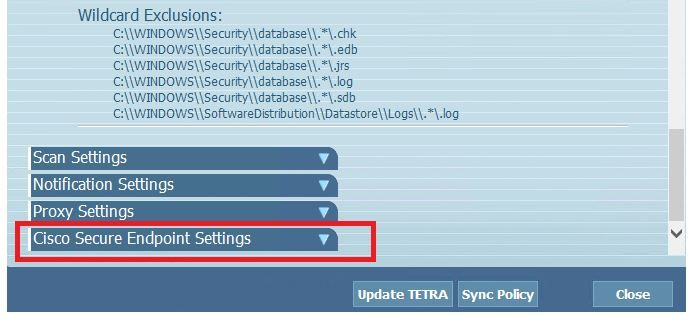
Step 3. Navigate to Settings and select the Cisco Secure Endpoint Connector Settings menu as shown in the image.
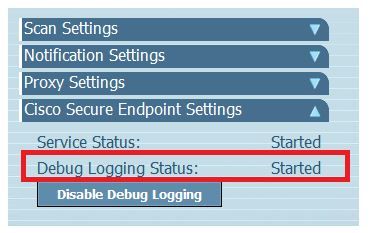
Step 4. Select Enable Debug Logging button, as shown in the image.

Step 4.1. Button name changes to Disable Debug Logging. Now you are in the Debug Mode, as shown in the image.
Step 5. Recreate the issue and let the device run for at least 30 minutes.
Step 6. After 30 minutes, open the Windows search, write Support Diagnostic Tool and the diagnostic tool appears. Execute the tool with Administrator privileges as shown in the image.
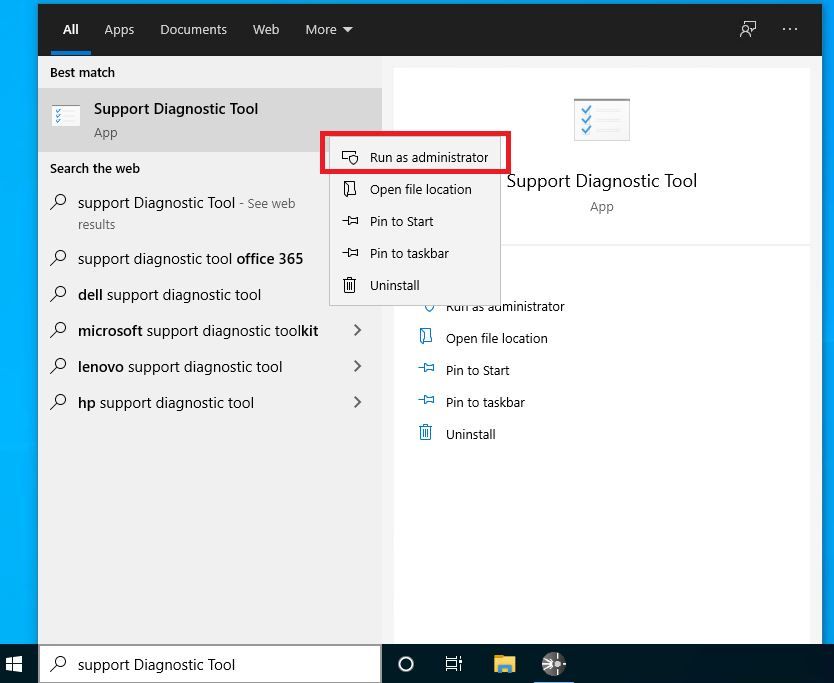
Note: From Secure Endpoint Connector v7.5.5, Windows account with administrator privileges is not required to open the Support Diagnostic Tool in order to collect the debug logs. Release Notes: "Updated support diagnostic tool so that it does not require elevated privileges".
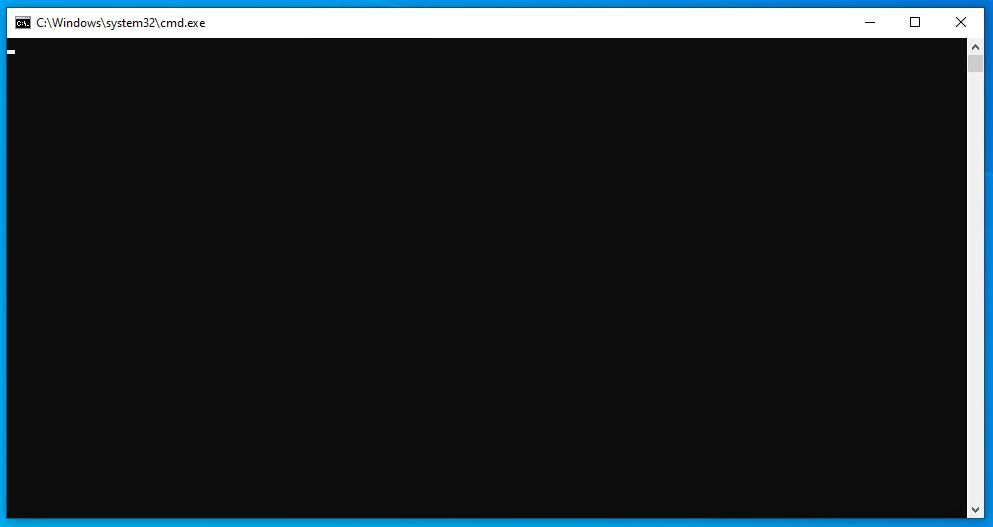
Step 7. The temporary Windows black screen appears, as shown in the image.

Note: Wait a few seconds, the Windows black screen is closed by itself.
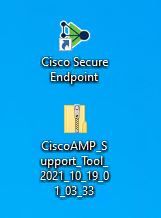
Step 8. After few minutes, the Debug Bundle file appears on the desktop, as shown in the image.
Step 9. Once you generate the Debug Bundle file, you can disable the Debug mode. Select Disable Debug Logging button, as shown in the image.
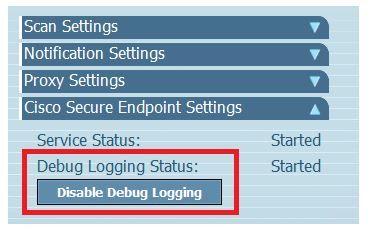
Step 9.1. Button name changes to Enable Debug Logging, as shown in the image.
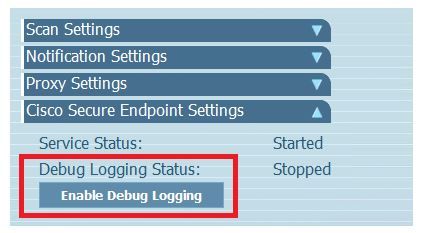
Note: Debug mode must be enabled only to collect the Debug Bundle file. Enabling Debug mode for a longer time can fill up the disk space.
Step 10. Once you collect the Debug Bundle file, please upload it on My Case in Cloud Apps
Note: Ensure that you reference the Service Request number.
Version 8.0.1 and Higher (Cisco Secure Client)
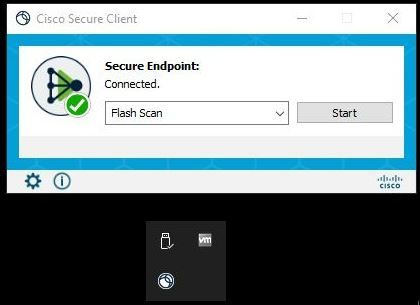
Step 1. Launch Tray Icon on the taskbar, as shown in the image.
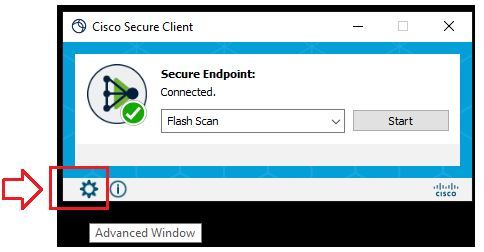
Step 2. Select the Advance Window option in Secure Endpoint Connector, as shown in the image.
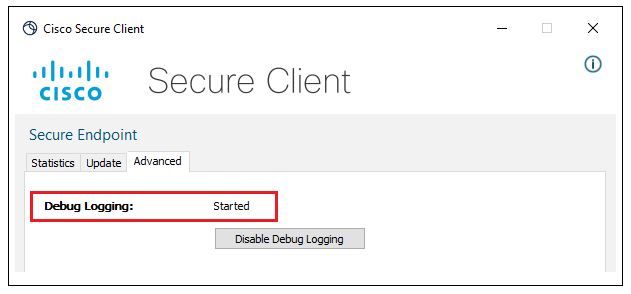
Step 3. Navigate to Advanced tab and select Enable Debug Logging button, as shown in the image.
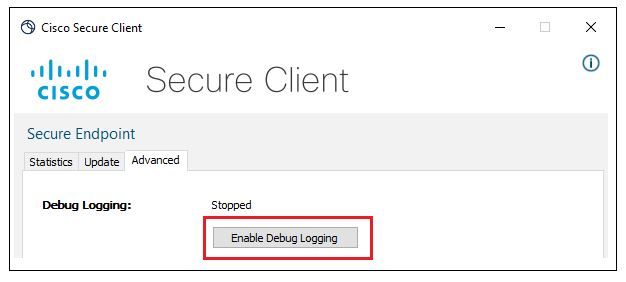
Step 4. Debug logging button name changes to Started. Now you are in the Debug Mode, as shown in the image.
Step 5. Recreate the issue and let the device run for at least 30 minutes.
Step 6. After 30 minutes, open the Windows search and write Support Diagnostic Tool.
- The diagnostic tool appears. Execute the tool with Administrator privileges.
- After few minutes, the Debug Bundle file appears on the desktop, as shown in the image.

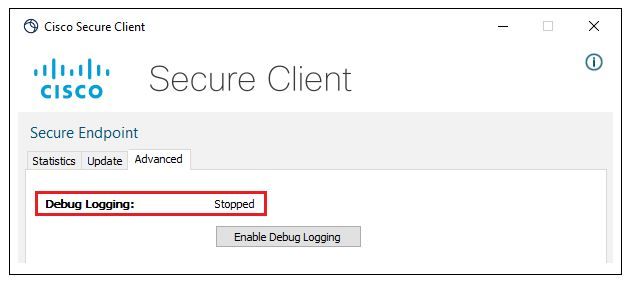
Step 7. Once you generate the Debug Bundle file, you can disable the Debug mode. Select Disable Debug Logging button. Debug logging button name changes to Stopped, as shown in the image.
Note: Debug mode must be enabled only to collect the Debug Bundle file. Enable Debug mode for a longer time can fill up the disk space.
Step 8. Once you collect the Debug Bundle file, please upload it on My Case in Cloud Apps
Note: Ensure that you reference the Service Request number.


 Feedback