Troubleshoot ASR 9000 Series Punt Fabric Data Path Failures
Available Languages
Download Options
Bias-Free Language
The documentation set for this product strives to use bias-free language. For the purposes of this documentation set, bias-free is defined as language that does not imply discrimination based on age, disability, gender, racial identity, ethnic identity, sexual orientation, socioeconomic status, and intersectionality. Exceptions may be present in the documentation due to language that is hardcoded in the user interfaces of the product software, language used based on RFP documentation, or language that is used by a referenced third-party product. Learn more about how Cisco is using Inclusive Language.
Introduction
This document describes punt fabric data path failure messages seen during Cisco Aggregation Services Router (ASR) 9000 Series operation.
The message appears in this format:
RP/0/RSP0/CPU0:Sep  3 13:49:36.595 UTC: pfm_node_rp[358]:
%PLATFORM-DIAGS-3-PUNT_FABRIC_DATA_PATH_FAILED: Set|online_diag_rsp[241782]|
System Punt/Fabric/data Path Test(0x2000004)|failure threshold is 3, (slot, NP)
failed: (0/7/CPU0, 1) (0/7/CPU0, 2) (0/7/CPU0, 3) (0/7/CPU0, 4) (0/7/CPU0, 5)
(0/7/CPU0, 6) (0/7/CPU0, 7)
This document is intended for anyone who wants to understand the error message, and the actions to take if the problem is seen.
Prerequisites
Requirements
Cisco recommends that you have a high-level knowledge of these topics:
- ASR 9000 Line Cards
- Fabric Cards
- Route Processors
- Chassis Architecture
However, this document does not require readers to be familiar with hardware details. The necessary background information is provided before the error message is explained. This document describes the error on both Trident- and Typhoon-based line cards. See Understand ASR 9000 Series Line Card Types for an explanation of those terms.
Components Used
This document is not restricted to specific software and hardware versions.
The information in this document was created from the devices in a specific lab environment. All of the devices used in this document started with a cleared (default) configuration. If your network is live, ensure that you understand the potential impact of any command.
How to Use this Document
Consider these suggestions about how to use this document in order to glean essential details and as a reference guide in the troubleshooting process:
- When there is no urgency to root cause a punt fabric data path failure, read all sections of this document. This document builds the necessary background needed in order to isolate a faulty component when such an error occurs.
- Use the FAQ section if you have a specific question in mind for which a quick answer is needed. If the question is not included in the FAQ section, then check if the main document addresses the question.
- Use all of the sections from Analyze Faults on in order to isolate the problem to a faulty component when a router experiences a fault or in order to check if it is a known issue.
Background Information
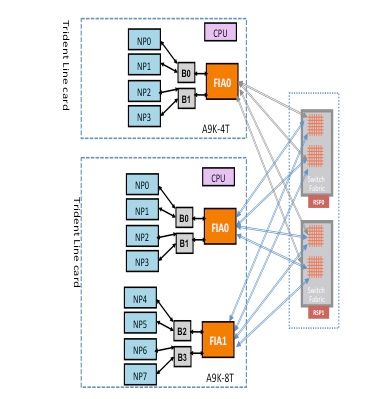
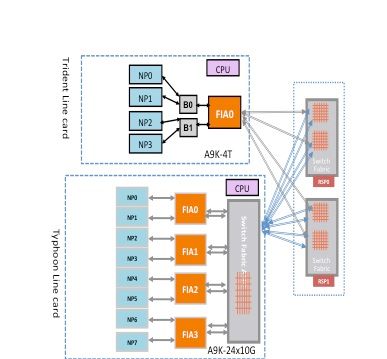
A packet can traverse either two hops or three hops through the switch fabric based upon the line card type. Typhoon generation line cards add an extra switch fabric element, while Trident-based line cards switch all traffic with the fabric on the route processor card only. These diagrams show fabric elements for both of these line card types, as well as fabric connectivity to the route processor card:
Punt Fabric Diagnostic Packet Path
The diagnostic application that runs on the route processor card CPU injects diagnostic packets destined to each Network Processor (NP) periodically. The diagnostic packet is looped back inside the NP, and reinjected towards the route processor card CPU that sourced the packet. This periodic health check of every NP with a unique packet per NP by the diagnostic application on the route processor card provides an alert for any functional errors on the data path during router operation. It is essential to note that the diagnostic application on both the active route processor and the standby route processor injects one packet per NP periodically and maintains a per NP success or failure count. When a threshold of dropped diagnostic packets is reached, the application raises a fault.
Conceptual View of Diagnostic Path
Before the document describes the diagnostic path on Trident- and Typhoon-based line cards, this section provides a general outline of the fabric diagnostic path from both the active and standby route processor cards towards the NP on the line card.
Packet Path Between the Active Route Processor Card and the Line Card
Diagnostic packets injected from the active route processor into the fabric towards the NP are treated as unicast packets by the switch fabric. With unicast packets, the switch fabric chooses the outgoing link based on the current traffic load of the link, which helps to subject diagnostic packets to the traffic load on the router. When there are multiple outgoing links towards the NP, the switch fabric ASIC chooses a link that is currently the least loaded.
This diagram depicts the diagnostic packet path sourced from the active route processor.
Note: The first link that connects the Fabric Interface ASIC (FIA) on the line card to the Crossbar (XBAR) on the route processor card is chosen all of the time for packets destined to the NP. Response packets from the NP are subjected to a link-load distribution algorithm (if the line card is Typhoon-based). This means that the response packet from the NP towards the active route processor can choose any of the fabric links that connect line cards to the route processor card based on the fabric link load.

Packet Path Between the Standby Route Processor Card and the Line Card
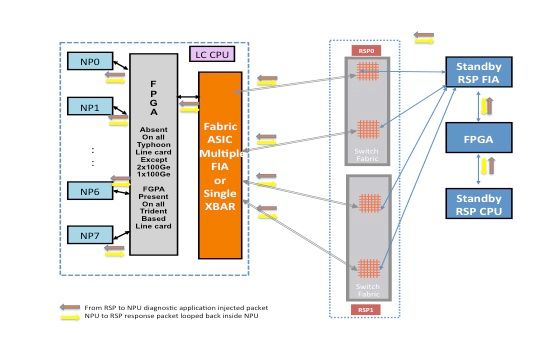
Diagnostic packets injected from the standby route processor into the fabric towards the NP are treated as multicast packets by the switch fabric. Although it is a multicast packet, there is no replication inside the fabric. Every diagnostic packet sourced from the standby route processor still reaches only one NP at a time. The response packet from the NP towards the route processor is also a multicast packet over the fabric with no replication. Hence, the diagnostic application on the standby route processor receives a single response packet from the NPs, one packet at a time. The diagnostic application tracks every NP in the system, because it injects one packet per NP, and expects responses from every NP, one packet at a time. With a multicast packet, the switch fabric chooses the outgoing link based on a field value in the packet header, which helps to inject diagnostic packets over every fabric link between the route processor card and the line card. The standby route processor tracks the NP health over every fabric link that connects between the route processor card and the line card slot.
The previous diagram depicts the diagnostic packet path sourced from the standby route processor. Notice that, unlike the active route processor case, all links that connect the line card to the XBAR on the route processor are exercised. The response packets from the NP take the same fabric link that was used by the packet in the route processor to the line card direction. This test ensures that all links that connect the standby route processor to the line card are monitored continuously.
Punt Fabric Diagnostic Packet Path on the Trident-Based Line Card
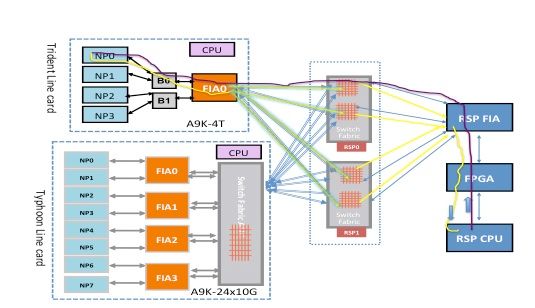
This diagram depicts the route processor sourced diagnostic packets destined to an NP that is looped back towards the route processor. It is important to note the data path links and ASICs that are common to all NPs, as well as links and components that are specific to a subset of NPs. For example, the Bridge ASIC 0 (B0) is common to NP0 and NP1, while FIA0 is common to all NPs. On the route processor end, all links, data path ASICs, and the Field-Programmable Gate Array (FPGA) are common to all line cards, and hence to all NPs in a chassis.
Punt Fabric Diagnostic Packet Path on the Typhoon-Based Line Card
This diagram depicts route processor card sourced diagnostic packets destined to an NP that is looped back towards the route processor. It is important to note the data path links and ASICs that are common to all NPs as well as links and components that are specific to a subset of NPs. For example, FIA0 is common to NP0 and NP1. On the route processor card end, all links, data path ASICs, and the FGPA are common to all line cards, and hence to all NPs in a chassis.
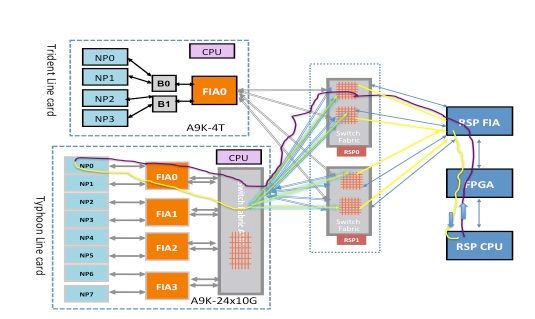
Punt Fabric Diagnostic Packet Path on the Tomahawk-, Lightspeed-, and LightspeedPlus-Based Line Card
On Tomahawk line cards there is 1:1 connectivity between the FIA and the NP.
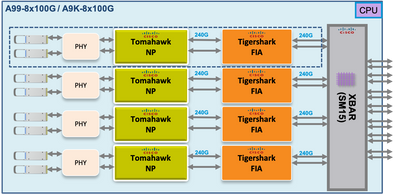
On Lightspeed and LightspeedPlus line cards the FIA is integrated in the NP chip.
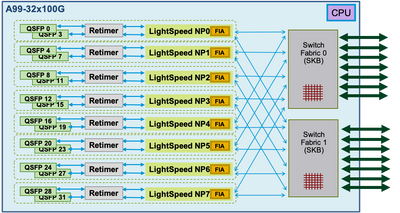
The next few sections attempt to depict the packet path to every NP. This is necessary in order to understand the punt fabric data path error message, and also in order to locate the failure point.
Punt Fabric Diagnostic Alarm and Failure Reporting
The failure to get responses from an NP in an ASR 9000-based router results in an alarm. The decision to raise an alarm by the online diagnostic application that executes on the route processor occurs when there are three consecutive failures. The diagnostic application maintains a three packets failure window for every NP. The active route processor and standby route processor diagnose independently and in parallel. The active route processor, standby route processor, or both route processor cards could report the error. The location of the fault and packet loss determine which route processor reports the alarm.
The default frequency of the diagnostic packet towards each NP is one packet per 60 seconds or one per minute.
Here is the alarm message format:
RP/0/RSP0/CPU0:Sep  3 13:49:36.595 UTC: pfm_node_rp[358]:
%PLATFORM-DIAGS-3-PUNT_FABRIC_DATA_PATH_FAILED: Set|online_diag_rsp[241782]|
System Punt/Fabric/data Path Test(0x2000004)|failure threshold is 3, (slot, NP)
failed: (0/7/CPU0, 1) (0/7/CPU0, 2) (0/7/CPU0, 3) (0/7/CPU0, 4) (0/7/CPU0, 5)
(0/7/CPU0, 6) (0/7/CPU0, 7)
The message shows a failure to reach NP 1, 2, 3, 4, 5, 6, and 7 on line card 0/7/cpu0 from the route processor 0/rsp0/cpu0.
From the list of online diagnostic tests, you can see the attributes of the punt fabric loopback test with this command:
RP/0/RSP0/CPU0:iox(admin)#show diagnostic content location 0/RSP0/CPU0


RP 0/RSP0/CPU0:

  Diagnostics test suite attributes:
    M/C/* - Minimal bootup level test / Complete bootup level test / NA
    B/O/* - Basic ondemand test / not Ondemand test / NA
    P/V/* - Per port test / Per device test / NA
    D/N/* - Disruptive test / Non-disruptive test / NA
      S/* - Only applicable to standby unit / NA
      X/* - Not a health monitoring test / NA
      F/* - Fixed monitoring interval test / NA
      E/* - Always enabled monitoring test / NA
      A/I - Monitoring is active / Monitoring is inactive
                                                         Test Interval   Thre-
 ID   Test Name                          Attributes     (day hh:mm:ss.ms shold)
  ==== ================================== ============ ================= =====
    1) PuntFPGAScratchRegister ---------- *B*N****A       000 00:01:00.000 1
    2) FIAScratchRegister --------------- *B*N****A       000 00:01:00.000 1
    3) ClkCtrlScratchRegister ----------- *B*N****A       000 00:01:00.000 1
    4) IntCtrlScratchRegister ----------- *B*N****A       000 00:01:00.000 1
    5) CPUCtrlScratchRegister ----------- *B*N****A       000 00:01:00.000 1
    6) FabSwitchIdRegister -------------- *B*N****A       000 00:01:00.000 1
    7) EccSbeTest ----------------------- *B*N****I       000 00:01:00.000 3
    8) SrspStandbyEobcHeartbeat --------- *B*NS***A       000 00:00:05.000 3
    9) SrspActiveEobcHeartbeat ---------- *B*NS***A       000 00:00:05.000 3
   10) FabricLoopback ------------------- MB*N****A       000 00:01:00.000 3
   11) PuntFabricDataPath --------------- *B*N****A       000 00:01:00.000 3
   12) FPDimageVerify ------------------- *B*N****I       001 00:00:00.000 1

RP/0/RSP0/CPU0:ios(admin)#
The output shows the PuntFabricDataPath test frequency is one packet every minute, and the failure threshold is three, which implies that the loss of three consecutive packets is not tolerated and results in an alarm. The test attributes shown are default values. In order to change defaults, enter the diagnostic monitor interval and diagnostic monitor threshold commands in the administration configuration mode.
Trident-Based Line Card Diagnostic Packet Path
NP0 Diagnostic Failure
Fabric Diagnostic Path
This diagram depicts the packet path between the route processor CPU and the line card NP0. The link that connects B0 and NP0 is the only link specific to NP0. All of the other links fall in the common path.
Make note of the packet path from the route processor towards NP0. Although there are four links to use for packets destined towards NP0 from the route processor, the first link between the route processor and the line card slot is used for the packet from the route processor towards the line card. The returned packet from NP0 can be sent back to the active route processor over any of the two fabric link paths between the line card slot and the active route processor. The choice of which one of the two links to use depends on the link load at that time. The response packet from NP0 towards the standby route processor uses both links, but one link at a time. The choice of the link is based on the header field that the diagnostic application populates.

NP0 Diagnostic Failure Analysis
Single Fault Scenario
If a single Platform Fault Manager (PFM) punt fabric data path failure alarm with only NP0 in the failure message is detected, the fault is only on the fabric path that connects the route processor and the line card NP0. This is a single fault. If the fault is detected to more than one NP, refer to the Multiple Fault Scenario section.
RP/0/RSP0/CPU0:Sep  3 13:49:36.595 UTC: pfm_node_rp[358]:
%PLATFORM-DIAGS-3-PUNT_FABRIC_DATA_PATH_FAILED: Set|online_diag_rsp[241782]|
System Punt/Fabric/data Path Test(0x2000004)|failure threshold is 3, (slot, NP)
failed: (0/7/CPU0, 0)
Note: This section of the document applies to any line card slot in a chassis, regardless of chassis type. Hence, this can be applied to all line card slots.
As illustrated in the previous data path diagram, the fault has to be in one or more of these locations:
- Link that connects NP0 and B0
- Inside B0 queues directed towards NP0
- Inside NP0
Multiple Fault Scenario
Multiple NP faults
When other faults are observed on NP0 or the fault PUNT_FABRIC_DATA_PATH_FAILED is also reported by other NPs on the same line card, then fault isolation is done by correlating all the faults. For example, if both the PUNT_FABRIC_DATA_PATH_FAILED fault and the LC_NP_LOOPBACK_FAILED fault occur on NP0, then the NP has stopped processing packets. Refer to the NP LoopBack Diagnostic Path section in order to understand the loopback fault. This could be an early indication of a critical failure inside NP0. However, if only one of the two faults occurs, then the fault is localized to either the punt fabric data path or on the line card CPU to the NP path.
If more than one NP on a line card has a punt fabric data path fault, then you must walk up the tree path of fabric links in order to isolate a faulty component. For example, if both NP0 and NP1 have a fault, then the fault has to be in B0 or the link that connects B0 and FIA0. It is less likely that both NP0 and NP1 encounter a critical internal error at the same time. Although it is less likely, it is possible for NP0 and NP1 to encounter a critical error fault due to the incorrect processing of a particular kind of packet or a bad packet.
Both Route Processor Cards Report a Fault
If both the active and standby route processor cards report a fault to one or more NPs on a line card, then check all of the common links and components on the data path between the affected NPs and both the route processor cards.
NP1 Diagnostic Failure
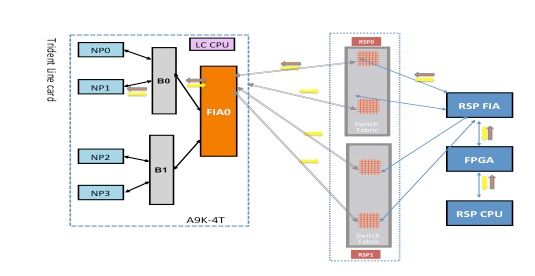
This diagram depicts the packet path between the route processor card CPU and the line card NP1. The link that connects Bridge ASIC 0 (B0) and NP1 is the only link specific to NP1. All of the other links fall in the common path.
Make note of the packet path from the route processor card towards NP1. Although there are four links to use for packets destined towards NP0 from the route processor, the first link between the route processor and the line card slot is used for the packet from the route processor towards the line card. The returned packet from NP1 can be sent back to the active route processor over any of the two fabric link paths between the line card slot and the active route processor. The choice of which one of the two links to use depends on the link load at that time. The response packet from NP1 towards the standby route processor uses both links, but one link at a time. The choice of the link is based on the header field that the diagnostic application populates.
Fabric Diagnostic Path
NP1 Diagnostic Failure Analysis
Refer to the NP0 Diagnostic Failure Analysis section, but apply the same reasoning for NP1 (instead of NP0).
NP2 Diagnostic Failure
This diagram depicts the packet path between the route processor card CPU and the line card NP2. The link that connects B1 and NP2 is the only link specific to NP2. All of the other links fall in the common path.
Make note of the packet path from the route processor card towards NP2. Although there are four links to use for packets destined towards NP2 from the route processor, the first link between the route processor and the line card slot is used for the packet from the route processor towards the line card. The returned packet from NP2 can be sent back to the active route processor over any of the two fabric link paths between the line card slot and the active route processor. The choice of which one of the two links to use depends on the link load at that time. The response packet from NP2 towards the standby route processor uses both links, but one link at a time. The choice of the link is based on the header field that the diagnostic application populates.
Fabric Diagnostic Path
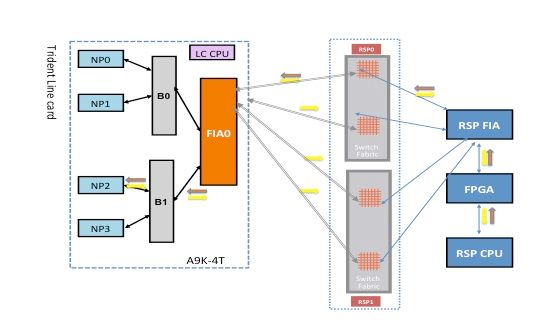
NP2 Diagnostic Failure Analysis
Refer to the NP0 Diagnostic Failure Analysis section, but apply the same reasoning for NP2 (instead of NP0).
NP3 Diagnostic Failure
This diagram depicts the packet path between the route processor card CPU and the line card NP3. The link that connects Bridge ASIC 1 (B1) and NP3 is the only link specific to NP3. All of the other links fall in the common path.
Make note of the packet path from the route processor card towards NP3. Although there are four links to use for packets destined towards NP3 from the route processor, the first link between the route processor and the line card slot is used for the packet from the route processor towards the line card. The returned packet from NP3 can be sent back to the active route processor over any of the two fabric link paths between the line card slot and the active route processor. The choice of which one of the two links to use depends on the link load at that time. The response packet from NP3 towards the standby route processor uses both links, but one link at a time. The choice of the link is based on the header field that the diagnostic application populates.
Fabric Diagnostic Path
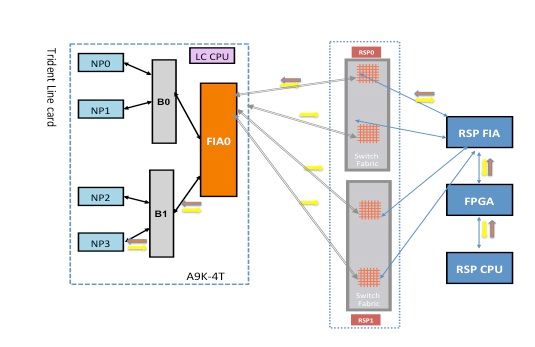
NP3 Diagnostic Failure Analysis
Refer to the NP0 Diagnostic Failure Analysis section, but apply the same reasoning for NP3 (instead of NP0).
Typhoon-Based Line Card Diagnostic Packet Path
This section provides two examples in order to establish background for fabric punt packets with Typhoon-based line cards. The first example uses NP1, and the second example uses NP3. The description and analysis can be extended to other NPs on any Typhoon-based line card.
Typhoon NP1 Diagnostic Failure
The next diagram depicts the packet path between the route processor card CPU and the line card NP1. The link that connects FIA0 and NP1 is the only link specific to the NP1 path. All of the other links between the line card slot and the route processor card slot fall in the common path. The links that connect the fabric XBAR ASIC on the line card to the FIAs on the line card are specific to a subset of NPs. For example, both links between FIA0 and the local fabric XBAR ASIC on the line card are used for traffic to NP1.
Make note of the packet path from the route processor card towards NP1. Although there are eight links to use for packets destined towards NP1 from the route processor card, a single path between the route processor card and the line card slot is used. The returned packet from NP1 can be sent back to the route processor card over eight fabric link paths between the line card slot and the route processor. Each of these eight links is exercised one at a time when the diagnostic packet is destined back to the route processor card CPU.
Fabric Diagnostic Path
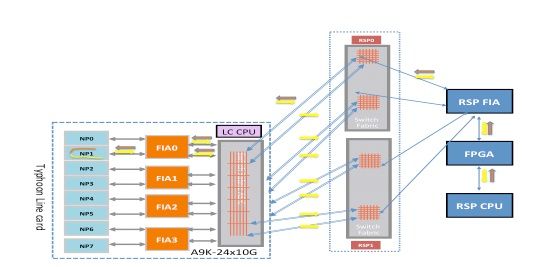
Typhoon NP3 Diagnostic Failure
This diagram depicts the packet path between the route processor card CPU and the line card NP3. The link that connects FIA1 and NP3 is the only link specific to the NP3 path. All of the other links between the line card slot and the route processor card slot fall in the common path. The links that connect the fabric XBAR ASIC on the line card to the FIAs on the line card are specific to a subset of NPs. For example, both links between FIA1 and the local fabric XBAR ASIC on the line card are used for traffic to NP3.
Make note of the packet path from the route processor card towards NP3. Although there are eight links to use for packets destined towards NP3 from the route processor card, a single path between the route processor card and the line card slot is used. The returned packet from NP1 can be sent back to the route processor card over eight fabric link paths between the line card slot and the route processor. Each of these eight links is exercised one at a time when the diagnostic packet is destined back to the route processor card CPU.
Fabric Diagnostic Path
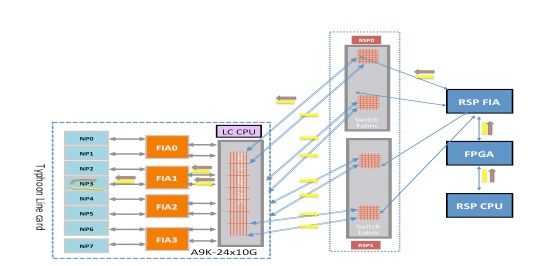
Tomahawk-Based Line Card Diagnostic Packet Path
Due to the 1:1 connectivity between the FIA and NP, the only traffic that traverses FIA0 is to/from NP0.
Lightspeed- and LightspeedPlus-Based Line Card Diagnostic Packet Path
As the FIA is integrated in the NP chip, the only traffic that traverses FIA0 is to/from NP0.
Analyze Faults
This section categorizes faults into hard and transient cases, and lists the steps used in order to identify if a fault is a hard or transient fault. Once the fault type is determined, the document specifies the commands that can be executed on the router in order to understand the fault and what corrective actions are needed.
Transient Fault
If a set PFM message is followed by clear PFM message, then a fault has occurred, and the router has corrected the fault itself. Transient faults can occur due to environmental conditions and recoverable faults in hardware components. Sometimes it can be difficult to associate transient faults to any particular event.
An example of a transient fabric fault is listed here for clarity:
RP/0/RSP0/CPU0:Feb  5 05:05:44.051 : pfm_node_rp[354]:
%PLATFORM-DIAGS-3-PUNT_FABRIC_DATA_PATH_FAILED : Set|online_diag_rsp[237686]|
System Punt/Fabric/data Path Test(0x2000004)|failure threshold is 3, (slot, NP)
failed: (0/2/CPU0, 0)

RP/0/RSP0/CPU0:Feb  5 05:05:46.051 : pfm_node_rp[354]:
%PLATFORM-DIAGS-3-PUNT_FABRIC_DATA_PATH_FAILED : Clear|online_diag_rsp[237686]|
System Punt/Fabric/data Path Test(0x2000004)|failure threshold is 3, (slot, NP)
failed: (0/2/CPU0, 0)
Transient Fault Corrective Actions
The suggested approach for transient errors is to only monitor for further occurrence of such errors. If a transient fault occurs more than once, then treat the transient fault as a hard fault, and use the recommendations and steps in order to analyze such faults described in the next section.
Hard Fault
If a set PFM message is not followed by a clear PFM message, then a fault has occurred and the router has not corrected the fault itself by the fault handling code, or the nature of the hardware fault is not recoverable. Hard faults can occur due to environmental conditions and unrecoverable faults in hardware components. The suggested approach for hard faults is to use the guidelines mentioned in the Analyze Hard Faults section.
An example of hard fabric fault is listed here for clarity. For this example message, there is not a corresponding clear PFM message.
RP/0/RSP0/CPU0:Feb  5 05:05:44.051 : pfm_node_rp[354]:
%PLATFORM-DIAGS-3-PUNT_FABRIC_DATA_PATH_FAILED : Set|online_diag_rsp[237686]|
System Punt/Fabric/data Path Test(0x2000004)|failure threshold is 3, (slot, NP)
failed: (0/2/CPU0, 0)
Hard Fault Corrective Actions
Under a hard fault scenario, collect all of the commands mentioned in the Data To Collect Before Service Request Creation section, and open a service request. In urgent cases, after you collect all of the troubleshooting command output, initiate a route processor card or a line card reload based on the fault isolation. After the reload, if the error is not recovered, initiate an Return Material Authorization (RMA).
Analyze Transient Faults
Complete these steps in order to analyze transient faults.
- Enter the
show logging | inc “PUNT_FABRIC_DATA_PATH"command in order to discover if the error occurred once or multiple times. - Enter the
show pfm location allcommand in order to determine the current status (SET or CLEAR). Is the error outstanding or cleared? If the error status changes between SET and CLEAR, then one or more faults within the fabric data path repeatedly occurs and is rectified either by software or hardware. - Provision either Simple Network Management Protocol (SNMP) traps or run a script that collects
show pfm location allcommand output, and searches for the error string periodically in order to monitor future occurrence of the fault (when the last status of the error is CLEAR, and no new faults occur).
Commands to Use
Enter these commands in order to analyze transient faults:
show logging | inc “PUNT_FABRIC_DATA_PATH”show pfm location all
Analyze Hard Faults
If you view the fabric data path links on a line card as a tree (where the details are described in the Background Information section), then you must infer - based upon the point of fault - whether one or more NPs are inaccessible. When multiple faults occur on multiple NPs, then use the commands listed in this section in order to analyze faults.
Commands to Use
Enter these commands in order to analyze hard faults:
show logging | inc “PUNT_FABRIC_DATA_PATH”
The output could contain one or more NPs (for example: NP2, NP3).show controller fabric fia link-status location <lc>
Since both NP2 and NP3 (in the Typhoon NP3 Diagnostic Failure section) receive and send through a single FIA, it is reasonable to infer that the fault is in an associated FIA on the path.show controller fabric crossbar link-status instance <0 and 1> location <LC or RSP>
If all NPs on the line card are not reachable for the diagnostic application, then it is reasonable to infer that the links that connect the line card slot to the route processor card could have a fault on any of the ASICs that forward traffic between the route processor card and the line card.show controller fabric crossbar link-status instance 0 location <lc>show controller fabric crossbar link-status instance 0 location 0/rsp0/cpu0show controller fabric crossbar link-status instance 1 location 0/rsp0/cpu0show controller fabric crossbar link-status instance 0 location 0/rsp1/cpu0show controller fabric crossbar link-status instance 1 location 0/rsp1/cpu0show controller fabric fia link-status location 0/rsp*/cpu0show controller fabric fia link-status location 0/rsp0/cpu0show controller fabric fia link-status location 0/rsp1/cpu0show controller fabric fia bridge sync-status location 0/rsp*/cpu0show controller fabric fia bridge sync-status location 0/rsp0/cpu0show controller fabric fia bridge sync-status location 0/rsp1/cpu0show tech fabric terminal
Note: If all of the NPs on all of the line cards report a fault, then the fault is most likely on the route processor card (active route processor card or standby route processor card). Refer to the link that connects the route processor card CPU to the FPGA and the route processor card FIA in the Background Information section.
Past Failures
Historically, 99 percent of faults are recoverable, and in most cases the software-initiated recovery action fixes the faults. However, in very rare cases, unrecoverable errors are seen that can only be fixed with the RMA of cards.
The next sections identify some past failures encountered in order to serve as guidance if similar errors are observed.
Transient Error Due to NP Oversubscription
These messages display if the error is due to NP oversubscription.
RP/0/RP1/CPU0:Jun 26 13:08:28.669 : pfm_node_rp[349]:
 %PLATFORM-DIAGS-3-PUNT_FABRIC_DATA_PATH_FAILED : Set|online_diag_rsp[200823]|
System Punt/Fabric/data Path Test(0x2000004)|failure threshold is 3, (slot, NP)
failed: (0/10/CPU0, 0)

RP/0/RP1/CPU0:Jun 26 13:09:28.692 : pfm_node_rp[349]:
%PLATFORM-DIAGS-3-PUNT_FABRIC_DATA_PATH_FAILED : Clear|online_diag_rsp[200823]|
System Punt/Fabric/data Path Test(0x2000004)|failure threshold is 3, (slot, NP)
failed: (0/10/CPU0,0)
Transient faults can be harder to confirm. One method to determine if an NP is currently oversubscribed or has been oversubscribed in the past is to check for a certain kind of drop inside the NP and for tail drops in the FIA. Ingress Front Direct Memory Access (IFDMA) drops inside the NP occur when the NP is oversubscribed and cannot keep up with incoming traffic. FIA tail drops occur when an egress NP asserts flow control (asks the ingress line card to send less traffic). Under the flow control scenario, the ingress FIA has tail drops.
Here is an example:
RP/0/RSP0/CPU0:RP/0/RSP0/CPU0:ASR9006-C#show controllers np counters all
Wed Feb 19 13:10:11.848 EST

Node: 0/1/CPU0:
----------------------------------------------------------------
Show global stats counters for NP0, revision v3

Read 93 non-zero NP counters:
Offset Counter                             FrameValue     Rate (pps)
-----------------------------------------------------------------------
 22 PARSE_ENET_RECEIVE_CNT                 46913080435     118335
 23 PARSE_FABRIC_RECEIVE_CNT               40175773071     5
 24 PARSE_LOOPBACK_RECEIVE_CNT             5198971143966   0
<SNIP>

Show special stats counters for NP0, revision v3

Offset Counter                                CounterValue
----------------------------------------------------------------------------
524032 IFDMA discard stats counters 0         8008746088           0   <<<<<
Here is an example:
RP/0/RSP0/CPU0:ASR9006-C#show controllers fabric fia drops ingress location 0/1/cPU0
Wed Feb 19 13:37:27.159 EST
********** FIA-0 **********
Category: in_drop-0
 DDR Rx FIFO-0 0
 DDR Rx FIFO-1 0
 Tail Drop-0 0   <<<<<<<
 Tail Drop-1 0   <<<<<<<
 Tail Drop-2 0   <<<<<<<
 Tail Drop-3 0   <<<<<<<
 Tail Drop DE-0 0
 Tail Drop DE-1 0
 Tail Drop DE-2 0
 Tail Drop DE-3 0
 Hard Drop-0 0
 Hard Drop-1 0
 Hard Drop-2 0
 Hard Drop-3 0
 Hard Drop DE-0 0
 Hard Drop DE-1 0
 Hard Drop DE-2 0
 Hard Drop DE-3 0
 WRED Drop-0 0
 WRED Drop-1 0
 WRED Drop-2 0
 WRED Drop-3 0
 WRED Drop DE-0 0
 WRED Drop DE-1 0
 WRED Drop DE-2 0
 WRED Drop DE-3 0
 Mc No Rep 0
Hard Fault due to NP Fast Reset
When PUNT_FABRIC_DATA_PATH_FAILED occurs, and if the failure is due to NP fast reset, then logs similar to what is listed here appear for a Typhoon-based line card. The health monitoring mechanism is available on Typhoon-based line cards, but not on Trident-based line cards.
LC/0/2/CPU0:Aug 26 12:09:15.784 CEST: prm_server_ty[303]:
prm_inject_health_mon_pkt : Error injecting health packet for NP0
status = 0x80001702

LC/0/2/CPU0:Aug 26 12:09:18.798 CEST: prm_server_ty[303]:
prm_inject_health_mon_pkt : Error injecting health packet for NP0
status = 0x80001702

LC/0/2/CPU0:Aug 26 12:09:21.812 CEST: prm_server_ty[303]:
prm_inject_health_mon_pkt : Error injecting health packet for NP0
status = 0x80001702

LC/0/2/CPU0:Aug 26 12:09:24.815 CEST:
prm_server_ty[303]: NP-DIAG health monitoring failure on NP0

LC/0/2/CPU0:Aug 26 12:09:24.815 CEST: pfm_node_lc[291]:
%PLATFORM-NP-0-NP_DIAG : Set|prm_server_ty[172112]|
Network Processor Unit(0x1008000)| NP diagnostics warning on NP0.

LC/0/2/CPU0:Aug 26 12:09:40.492 CEST: prm_server_ty[303]:
Starting  fast reset for NP 0 LC/0/2/CPU0:Aug 26 12:09:40.524 CEST:
prm_server_ty[303]: Fast Reset NP0  - successful auto-recovery of NP
For Trident-based line cards, this log is seen with a fast reset of an NP:
LC/0/1/CPU0:Mar 29 15:27:43.787 test:
pfm_node_lc[279]: Fast Reset initiated on NP3
Failures Between RSP440 Route Processors and Typhoon Line Cards
Cisco has fixed an issue where rarely fabric links between Route Switch Processor (RSP) 440 and Typhoon-based line cards across the backplane are retrained. Fabric links are retrained because the signal strength is not optimal. This issue is present in the base Cisco IOS® XR Software Releases 4.2.1, 4.2.2, 4.2.3, 4.3.0, 4.3.1, and 4.3.2. A Software Maintenance Update (SMU) for each of these releases is posted on Cisco Connection Online, and tracked with Cisco bug ID CSCuj10837 and Cisco bug ID CSCul39674.
When this issue occurs on the router, any of these scenarios can occur:
- The link goes down and comes up. (Transient)
- The link goes permanently down.
Cisco bug ID CSCuj10837 - Fabric Retrain Between RSP and LC (TX Direction)
In order to confirm, collect the ltrace outputs from LC and both the RSPs (show controller fabric crossbar ltrace location <>) and check if this output is seen in RSP ltraces:
SMU is already available
Here is an example:
RP/0/RSP0/CPU0:ios#show controllers fabric ltrace crossbar location 0/rsp0/cpu0 |
in link_retrain
     Oct  1 08:22:58.999 crossbar 0/RSP1/CPU0 t1  detail xbar_fmlc_handle_link_retrain:
     rcvd link_retrain for (1,1,0),(2,1,0),1.

RP/0/RSP0/CPU0:ios#show controllers fabric ltrace crossbar location 0/0/cpu0 |
in link_retrain
     Oct  1 08:22:58.967 crossbar 0/0/CPU0 t1   init xbar_trigger_link_retrain:
     destslot:0 fmlgrp:3 rc:0
     Oct  1 08:22:58.967 crossbar 0/0/CPU0 t1   detail xbar_pfm_alarm_callback:
     xbar_trigger_link_retrain(): (2,0,7) initiated
     Oct  1 08:22:58.969 crossbar 0/0/CPU0 t1   detail xbar_fmlc_handle_link_retrain:
rcvd link_retrain for (2,1,0),(2,2,0),0.
The term TX direction refers to the direction from the standpoint of the RSPs crossbar fabric interface towards a fabric crossbar interface on a Typhoon-based line card.
Cisco bug ID CSCuj10837 is characterized by the Typhoon line card's detection of a problem on the RX link from the RSP and initiation of a link retrain. Either side (LC or RSP) can initiate the retrain event. In the case of Cisco bug ID CSCuj10837, the LC initiates the retrain and can be detected by the init xbar_trigger_link_retrain: message in the traces on the LC.
RP/0/RSP0/CPU0:ios#show controllers fabric ltrace crossbar location 0/0/cpu0 |
in link_retrain
     Oct  1 08:22:58.967 crossbar 0/0/CPU0 t1   init xbar_trigger_link_retrain: destslot:
     0 fmlgrp:3 rc:0
When the LC initiates the retrain, the RSP reports a rcvd link_retrain in the trace output.
RP/0/RSP0/CPU0:ios#show controllers fabric ltrace crossbar location 0/rsp0/cpu0 |
in link_retrain
     Oct  1 08:22:58.999 crossbar 0/RSP1/CPU0 t1  detail xbar_fmlc_handle_link_retrain:
     rcvd link_retrain for (1,1,0),(2,1,0),1.
Cisco bug ID CSCul39674 - Fabric Retrain Between RSP and LC (RX Direction)
In order to confirm, collect the ltrace outputs from the line card and both the RSPs (show controller fabric crossbar ltrace location <>) and check if this output is seen in RSP ltraces:
Here is an example:
RP/0/RSP0/CPU0:asr9k-2#show controllers fabric ltrace crossbar  location 0/0/cpu0 |
in link_retrain
 Jan  8 17:28:39.215 crossbar 0/0/CPU0 t1     detail xbar_fmlc_handle_link_retrain:
 rcvd link_retrain for (0,1,0),(5,1,1),0.

RP/0/RSP0/CPU0:asr9k-2#show controllers fabric ltrace crossbar  location 0/rsp0/cpu0 |
in link_retrain
 Jan  8 17:28:39.207 crossbar 0/RSP1/CPU0 t1       init xbar_trigger_link_retrain:
 destslot:4 fmlgrp:3 rc:0
 Jan  8 17:28:39.207 crossbar 0/RSP1/CPU0 t1     detail xbar_pfm_alarm_callback:
 xbar_trigger_link_retrain(): (5,1,11) initiated
 Jan  8 17:28:39.256 crossbar 0/RSP1/CPU0 t1     detail xbar_fmlc_handle_link_retrain:
 rcvd link_retrain for (5,1,1),(0,1,0),0.
The term RX direction refers to the direction from the standpoint of the RSPs crossbar fabric interface from a fabric crossbar interface on a Typhoon-based line card.
Cisco bug ID CSCul39674 is characterized by the RSP's detection of a problem on the RX link from the Typhoon line card and initiation of a link retrain. Either side (LC or RSP) can initiate the retrain event. In the case of Cisco bug ID CSCul39674, the RSP initiates the retrain and can be detected by the init xbar_trigger_link_retrain: message in the traces on the RSP.
RP/0/RSP0/CPU0:asr9k-2#show controllers fabric ltrace crossbar  location 0/rsp0/cpu0 |
in link_retrain
 Jan  8 17:28:39.207 crossbar 0/RSP1/CPU0 t1 init xbar_trigger_link_retrain: destslot:4 fmlgrp:
 3 rc:0
When the RSP initiates the retrain, the LC reports a rcvd link_retrain event in the trace output.
RP/0/RSP0/CPU0:asr9k-2#show controllers fabric ltrace crossbar  location 0/0/cpu0 |
in link_retrain
 Jan  8 17:28:39.215 crossbar 0/0/CPU0 t1 detail xbar_fmlc_handle_link_retrain:
 rcvd link_retrain for (0,1,0),(5,1,1),0.
Fabric Retrain Differences in Release 4.3.2 and Later
Significant work has been done in order to decrease the time it takes to retrain a fabric link in Cisco IOS XR Release 4.3.2 and later. The fabric retrain now occurs in subsecond times and is imperceptible to traffic flows. In Cisco IOS XR Release 4.3.2, only these syslog message are seen when a fabric link retrain occurred.
%PLATFORM-FABMGR-5-FABRIC_TRANSIENT_FAULT :  Fabric backplane crossbar link
underwent link retraining to recover from a transient error: Physical slot 1
Failure Due to Fabric ASIC FIFO Overflow
Cisco has fixed an issue where the Fabric ASIC (FIA) could get reset due to an unrecoverable First In First Out (FIFO) overflow condition. This is addressed with Cisco bug ID CSCul66510. This problem only affects the Trident-based line cards and is only encountered in rare cases with heavy ingress path congestion. If this issue is encountered, this syslog message is displayed before the line card is reset to recover from the condition.
RP/0/RSP0/CPU0:asr9k-2#show log
   LC/0/3/CPU0:Nov 13 03:46:38.860 utc: pfm_node_lc[284]:
   %FABRIC-FIA-0-ASIC_FATAL_FAULT Set|fialc[159814]
                |Fabric Interface(0x1014000)|Fabric interface asic ASIC1 encountered fatal
                fault 0x1b - OC_DF_INT_PROT_ERR_0
   LC/0/3/CPU0:Nov 13 03:46:38.863 utc: pfm_node_lc[284]:
   %PLATFORM-PFM-0-CARD_RESET_REQ : pfm_dev_sm_perform_recovery_action,
   Card reset requested by: Process ID:159814 (fialc), Fault Sev: 0, Target node:
   0/3/CPU0, CompId: 0x10, Device Handle: 0x1014000, CondID: 2545, Fault Reason:
   Fabric interface asic ASIC1 encountered fatal fault 0x1b - OC_DF_INT_PROT_ERR_0
Failure Due to Heavy Virtual Output Queue (VOQ) Build-up from Fabric Congestion
Cisco has fixed an issue where extended heavy congestion could lead to fabric resource exhaustion and traffic loss. The traffic loss can even occur on unrelated flows. This problem is addressed with Cisco bug ID CSCug90300 and is resolved in Cisco IOS XR Release 4.3.2 and later. The fix is also delivered in Cisco IOS XR Release 4.2.3 CSMU#3, Cisco bug ID CSCui33805. This rare issue could be encountered on either Trident- or Typhoon-based line cards.
Relevant Commands
Gather output from these commands:
show tech-support fabricshow controller fabric fia bridge flow-control location <LC><=== Get this output for all LCsshow controllers fabric fia q-depth location <LC>
Here are some example outputs:
RP/0/RSP0/CPU0:asr9k-1#show controllers fabric fia q-depth location 0/6/CPU0
Sun Dec 29 23:10:56.307 UTC
********** FIA-0 **********
Category: q_stats_a-0
Voq       ddr            pri            pktcnt
11        0              2              7
********** FIA-0 **********
Category: q_stats_b-0
Voq       ddr            pri            pktcnt
********** FIA-1 **********
Category: q_stats_a-1
Voq       ddr            pri            pktcnt
11        0              0              2491
11        0              2              5701
********** FIA-1 **********
Category: q_stats_b-1
Voq       ddr            pri            pktcnt
RP/0/RSP0/CPU0:asr9k-1#
RP/0/RSP0/CPU0:asr9k-1#show controllers pm location 0/1/CPU0 | in "switch|if"

Sun Dec 29 23:37:05.621 UTC
Ifname(2): TenGigE0_1_0_2, ifh: 0x2000200 : <==Corresponding interface ten 0/1/0/2
iftype             0x1e
switch_fabric_port 0xb   <==== VQI 11
parent_ifh         0x0
parent_bundle_ifh  0x80009e0
RP/0/RSP0/CPU0:asr9k-1#
Under nomal conditions, it is very unlikely to see a VOQ with packets queued up. This command is a quick realtime snapshot of the FIA queues. It is common for this command to not show any packets queued at all.
Traffic Impact Due to Bridge/FPGA Soft Errors on Trident-Based Line Cards
Soft errors are nonpermanent errors that cause the state machine to be out of sync. These are seen as Cyclic Redundancy Check (CRC), Frame Check Sequence (FCS), or errored packets on the fabric side of the NP or on the ingress side of the FIA.
Here are some examples of how this issue can be seen:
RP/0/RSP0/CPU0:asr9k-1#show controllers fabric  fia drops ingress location 0/3/CPU0
Fri Dec  6 19:50:42.135 UTC
 ********** FIA-0 **********
Category: in_drop-0
                                DDR Rx FIFO-0                        0
                                DDR Rx FIFO-1                 32609856   <=== Errors

RP/0/RSP0/CPU0:asr9k-1#show controllers fabric  fia errors ingress location 0/3/CPU0
Fri Dec  6 19:50:48.934 UTC

 ********** FIA-0 **********
Category: in_error-0
                                 DDR Rx CRC-0                        0
                                 DDR Rx CRC-1                 32616455  <=== Errors
RP/0/RSP1/CPU0:asr9k-1#show controllers fabric fia bridge stats location 0/0/CPU0
Ingress Drop Stats (MC & UC combined)
**************************************
PriorityPacket               Error            Threshold
       Direction               Drops            Drops
--------------------------------------------------
LP      NP-3 to Fabric     0                   0
HP      NP-3 to Fabric    1750              0
RP/0/RSP1/CPU0:asr9k-1#
RP/0/RSP1/CPU0:asr9k-1#show controllers fabric fia bridge stats location 0/6/CPU0

Sat Jan  4 06:33:41.392 CST
  ********** FIA-0 **********
Category: bridge_in-0
                                  UcH Fr Np-0                 16867506
                                  UcH Fr Np-1                   115685
                                  UcH Fr Np-2                   104891
                                  UcH Fr Np-3                   105103
                                  UcL Fr Np-0               1482833391
                                  UcL Fr Np-1              31852547525
                                  UcL Fr Np-2               3038838776
                                  UcL Fr Np-3              30863851758
                                  McH Fr Np-0                   194999
                                  McH Fr Np-1                   793098
                                  McH Fr Np-2                   345046
                                  McH Fr Np-3                   453957
                                  McL Fr Np-0                 27567869
                                  McL Fr Np-1                 12613863
                                  McL Fr Np-2                   663139
                                  McL Fr Np-3                 21276923
                                 Hp ErrFrNp-0                        0
                                 Hp ErrFrNp-1                        0
                                 Hp ErrFrNp-2                        0
                                 Hp ErrFrNp-3                        0
                                 Lp ErrFrNp-0                        0
                                 Lp ErrFrNp-1                        0
                                 Lp ErrFrNp-2                        0
                                 Lp ErrFrNp-3                        0
                                 Hp ThrFrNp-0                        0
                                 Hp ThrFrNp-1                        0
                                 Hp ThrFrNp-2                        0
                                 Hp ThrFrNp-3                        0
                                 Lp ThrFrNp-0                        0
                                 Lp ThrFrNp-1                        0
                                 Lp ThrFrNp-2                        0
                                 Lp ThrFrNp-3                        0
  ********** FIA-0 **********
Category: bridge_eg-0
                                  UcH to Np-0                   779765
                                  UcH to Np-1                  3744578
                                  UcH to Np-2                   946908
                                  UcH to Np-3                  9764723
                                  UcL to Np-0               1522490680
                                  UcL to Np-1              32717279812
                                  UcL to Np-2               3117563988
                                  UcL to Np-3              29201555584
                                UcH ErrToNp-0                        0
                                UcH ErrToNp-1                        0
                                UcH ErrToNp-2                      129   <==============
                                UcH ErrToNp-3                        0
                                UcL ErrToNp-0                        0
                                UcL ErrToNp-1                        0
                                UcL ErrToNp-2                    90359   <==========
Commands to Gather for Bridge/FPGA Soft Errors on Trident-Based Line Cards
Gather output from these commands:
show tech-support fabricshow tech-support npshow controller fabric fia bridge stats location <>(get several times)
Recovery from Bridge/FPGA Soft Errors
The recovery method is to reload the affected line card.
RP/0/RSP0/CPU0:asr9k-1#hw-module location 0/6/cpu0 reload
Online Diagnostic Test Report
The show diagnostic result location <node> [test <test-id> detail] command provides a summary of all online diagnostic tests and failures as well as the last time stamp when a test passed. The Test-ID for the punt fabric data path failure is ten. A list of all of the tests along with frequency of test packets can be seen with the show diagnostic content location <node> command.
The output of the punt fabric data path test result is similar to this sample output:
RP/0/RSP0/CPU0:ios(admin)#show diagnostic result location 0/rsp0/cpu0  test 10 detail
Current bootup diagnostic level for RP 0/RSP0/CPU0: minimal
  Test results: (. = Pass, F = Fail, U = Untested)

  ___________________________________________________________________________
  10 ) FabricLoopback ------------------> .
          Error code ------------------> 0 (DIAG_SUCCESS)
          Total run count -------------> 357
          Last test execution time ----> Sat Jan 10 18:55:46 2009
          First test failure time -----> n/a
          Last test failure time ------> n/a
          Last test pass time ---------> Sat Jan 10 18:55:46 2009
          Total failure count ---------> 0
          Consecutive failure count ---> 0
Automatic Recovery Enhancements
As described in Cisco bug ID CSCuc04493, there is now a way to have the router automatically shut down all of the ports that are associated with the PUNT_FABRIC_DATA_PATH errors raised on Active RP/RSP.
The first method is tracked via Cisco bug ID CSCuc04493. For Version 4.2.3, this is included in Cisco bug ID CSCui33805. In this version, it is set to automatically shut down all of the ports that are associated with the NPs that are affected.
Here is an example that shows how the syslogs would appear:
RP/0/RSP0/CPU0:Jun 10 16:11:26 BKK: pfm_node_rp[359]:
 %PLATFORM-DIAGS-3-PUNT_FABRIC_DATA_PATH_FAILED : Set|online_diag_rsp[237686]|System
 Punt/Fabric/data Path Test(0x2000004)|failure threshold is 3, (slot, NP) failed:
 (0/1/CPU0, 0)
LC/0/1/CPU0:Jun 10 16:11:27 BKK: ifmgr[204]: %PKT_INFRA-LINK-3-UPDOWN : Interface
 TenGigE0/1/0/0, changed state to Down
LC/0/1/CPU0:Jun 10 16:11:27 BKK: ifmgr[204]: %PKT_INFRA-LINEPROTO-5-UPDOWN : Line
 protocol on Interface TenGigE0/1/0/0, changed state to Down
LC/0/1/CPU0:Jun 10 16:11:27 BKK: ifmgr[204]: %PKT_INFRA-LINK-3-UPDOWN : Interface
 TenGigE0/1/0/1, changed state to Down
LC/0/1/CPU0:Jun 10 16:11:27 BKK: ifmgr[204]: %PKT_INFRA-LINEPROTO-5-UPDOWN : Line
 protocol on Interface TenGigE0/1/0/1, changed state to Down
The controller indicates that the reason for the interface being down is due to DATA_PATH_DOWN. Here is an example:
RP/0/RSP0/CPU0:ASR9006-E#show controllers gigabitEthernet 0/0/0/13 internal
Wed Dec 18 02:42:52.221 UTC

Port Number       : 13
Port Type         : GE
Transport mode    : LAN
BIA MAC addr      : 6c9c.ed08.3cbd
Oper. MAC addr    : 6c9c.ed08.3cbd
Egress MAC addr   : 6c9c.ed08.3cbd
Port Available    : true
Status polling is : enabled
Status events are : enabled
I/F Handle        : 0x04000400
Cfg Link Enabled  : tx/rx enabled
H/W Tx Enable     : no
UDLF enabled      : no
SFP PWR DN Reason : 0x00000000
SFP Capability    : 0x00000024
MTU               : 1538
H/W Speed         : 1 Gbps
H/W Duplex        : Full
H/W Loopback Type : None
H/W FlowCtrl type : None
H/W AutoNeg Enable: Off
H/W Link Defects  : (0x00080000) DATA_PATH_DOWN  <<<<<<<<<<<
Link Up           : no
Link Led Status   : Link down -- Red
Input good underflow          : 0
Input ucast underflow         : 0
Output ucast underflow        : 0
Input unknown opcode underflow: 0
Pluggable Present   : yes
Pluggable Type      : 1000BASE-LX
Pluggable Compl.    : (Service Un) - Compliant
Pluggable Type Supp.: (Service Un) - Supported
Pluggable PID Supp. : (Service Un) - Supported
Pluggable Scan Flg: false
In Versions 4.3.1 and later, this behavior must be enabled. There is a new admin-config command that is used in order to accomplish this. As the default behavior is no longer to shut down the ports, this must be manually configured.
RP/0/RSP1/CPU0:ASR9010-A(admin-config)#fault-manager datapath port ?
 shutdown Enable auto shutdown
 toggle Enable auto toggle port status
On 64-bit Cisco IOS XR the configuration command is available in the XR VM (not in the Sysadmin VM):
RP/0/RSP0/CPU0:CORE-TOP(config)#fault-manager datapath port ?
shutdown Enable auto shutdown
toggle Enable auto toggle port status
Cisco bug ID CSCui15435 addresses the soft errors that are seen on the Trident-based line cards, as described in the Traffic Impact Due to Bridge/FPGA Soft Errors on Trident-Based Line Cards section. This uses a different detection method than the usual diagnostic method that is described in Cisco bug ID CSCuc04493.
This bug also introduced a new admin-config CLI command:
 (admin-config)#fabric fia soft-error-monitor <1|2> location <specific>

1 = shutdown the ports
2 = reload the linecard

Default behavior: no action is taken.
When this error is encountered, this syslog can be observed:
RP/0/RSP0/CPU0:Apr 30 22:17:11.351 : config[65777]: %MGBL-SYS-5-CONFIG_I : Configured
 from console by root
LC/0/2/CPU0:Apr 30 22:18:52.252 : pfm_node_lc[283]:
 %PLATFORM-BRIDGE-1-SOFT_ERROR_ALERT_1 : Set|fialc[159814]|NPU
 Crossbar Fabric Interface Bridge(0x1024000)|Soft Error Detected on Bridge instance 1
RP/0/RSP0/CPU0:Apr 30 22:21:28.747 : pfm_node_rp[348]:
 %PLATFORM-DIAGS-3-PUNT_FABRIC_DATA_PATH_FAILED : Set|online_diag_rsp[237686]|
System Punt/Fabric/data Path Test(0x2000004)|failure threshold is 3, (slot, NP) failed:
 (0/2/CPU0, 2) (0/2/CPU0, 3)
LC/0/2/CPU0:Apr 30 22:21:29.707 : ifmgr[194]: %PKT_INFRA-LINK-3-UPDOWN :
 Interface TenGigE0/2/0/2, changed state to Down
LC/0/2/CPU0:Apr 30 22:21:29.707 : ifmgr[194]: %PKT_INFRA-LINEPROTO-5-UPDOWN :
 Line protocol on Interface TenGigE0/2/0/2, changed state to Down
RP/0/RSP1/CPU0:Apr 30 22:21:35.086 : pfm_node_rp[348]:
 %PLATFORM-DIAGS-3-PUNT_FABRIC_DATA_PATH_FAILED :
 Set|online_diag_rsp[237646]|System Punt/Fabric/data Path Test(0x2000004)|failure
 threshold is 3, (slot, NP) failed: (0/2/CPU0, 2) (0/2/CPU0, 3)
When the affected ports are shut down, it allows the network redundency to take over and avoid a black-holing of traffic. In order to recover, the line card must be reloaded.
Frequently Asked Questions (FAQ)
Q. Does the primary or standby route processor card send the keepalives or online diagnostic packets to every NP in the system?
A. Yes. Both route processor cards send online diagnostic packets to every NP.
Q. Is the path the same when the route processor card one (RSP1) is active?
A. The diagnostic path is the same for RSP0 or RSP1. The path is dependent on the state of the RSP. Refer to the Punt Fabric Diagnostic Packet Path section of this document for more details.
Q. How often do RSPs send diagnostic packets, and how many diagnostic packets must be missed before an alarm is triggered?
A. Each RSP independently sends a diagnostic packet to every NP once per minute. Either RSP can trigger an alarm if three diagnostic packets are not acknowledged.
Q. How do you determine if an NP is or has been oversubscribed?
A. One way to check if an NP is currently oversubscribed or has been oversubscribed in the past is to check for a certain kind of drop inside the NP and for tail drops in the FIA. Ingress Front Direct Memory Access (IFDMA) drops inside the NP occur when the NP is oversubscribed and cannot keep up with incoming traffic. FIA tail drops occur when an egress NP asserts flow control (asks ingress line card to send less traffic). Under the flow control scenario, the ingress FIA has tail drops.
Q. How do you determine if an NP suffers a fault that requires it to be reset?
A. Typically, an NP fault is cleared by a fast reset. The reason for a fast reset is displayed in the logs.
Q. Is it possible to manually reset a NP?
A. Yes, from the line card KSH:
run attach 0/[x]/CPU0
#show_np -e [np#] -d fast_reset
Q. What displays if an NP has a non-recoverable hardware failure?
A. You see both a punt fabric data path failure for that NP as well as an NP loopback test failure. The NP loopback test failure message is discussed in the Appendix section of this document.
Q. Will a diagnostics packet that is sourced from one route processor card come back to the same one?
A. Since diagnostic packets are sourced from both route processor cards and tracked on a per route processor card basis, a diagnostic packet sourced from a route processor card is looped back to same route processor card by the NP.
Q. The Cisco bug ID CSCuj10837 SMU provides a fix for the fabric link retrain event. Is this the cause and solution for many punt fabric data path failures?
A. Yes, it is required to load the superseding SMU for Cisco bug ID CSCul39674 in order to avoid fabric link retrain events.
Q. How long does it take in order to retrain fabric links once the decision to do so is made?
A. The decision to retrain is made as soon as a link failure is detected. Before Release 4.3.2, the retrain could take several seconds. After Release 4.3.2, the retrain time has been significantly improved and takes less than a second.
Q. At what point is the decision to retrain a fabric link made?
A. As soon as the link fault is detected, the decision to retrain is made by the fabric ASIC driver.
Q. Is it only between the FIA on an active route processor card and the fabric that you use the first link, and then after that it is the least loaded link when there are multiple links available?
A. Correct. The first link that connects to the first XBAR instance on the active route processor is used in order to inject traffic into the fabric. The response packet from the NP can reach back to the active route processor card on any of all of the links that connect to the route processor card. The choice of the link depends on the link load.
Q. During the retrain, are all packets that are sent over that fabric link lost?
A. Yes, but with the enhancements in Release 4.3.2 and later, the retrain is virtually undetectible. However, in earlier code, it could take several seconds to retrain, which resulted in lost packets for that time frame.
Q. How frequently do you expect to see a XBAR fabric link retrain event after you upgrade to a release or SMU with the fix for Cisco bug ID CSCuj10837?
A. Even with the fix for Cisco bug ID CSCuj10837 it is still possible to see fabric link retrains due to Cisco bug ID CSCul39674. But once you have the fix for Cisco bug ID CSCul39674, fabric link retraining on the fabric backplane links between the RSP440 and Typhoon-based line cards should never occur. If it does, then raise a service request with the Cisco Technical Assistance Center (TAC) in order to troubleshoot the problem.
Q. Does Cisco bug ID CSCuj10837 and Cisco bug ID CSCul39674 affect the RP on the ASR 9922 with Typhoon-based line cards?
A. Yes
Q. Does Cisco bug ID CSCuj10837 and Cisco bug ID CSCul39674 affect the ASR-9001 and ASR-9001-S routers?
A. No
Q. If you encounter the failure of a slot that does not exist with this message, "PLATFORM-DIAGS-3-PUNT_FABRIC_DATA_PATH_FAILED : Set|online_diag_rsp[237686]|System Punt/Fabric/data Path Test(0x2000004)|failure threshold is 3, (slot, NP) failed: (8, 0)," in a 10-slot chassis, which slot has the issue?
A. In earlier releases, you must account for the physical and logical mappings as shown here. In this example, slot 8 corresponds to 0/6/CPU0.
For 9010 (10 slot chassis)
L            P
#0  --- #0
#1  --- #1
#2  --- #2
#3  --- #3
RSP0 --- #4
RSP1 --- #5
#4 --- #6
#5 --- #7
#6 --- #8
#7 --- #9

For 9006 (6 slot chassis)
L               P
RSP0 --- #0
RSP1 --- #1
#0 --- #2
#1 --- #3
#2 --- #4
#3 --- #5
Data to Collect Before Service Request Creation
Here are the minimum commands to collect output before any action is taken:
show loggingshow pfm location alladmin show diagn result loc 0/rsp0/cpu0 test 8 detailadmin show diagn result loc 0/rsp1/cpu0 test 8 detailadmin show diagn result loc 0/rsp0/cpu0 test 9 detailadmin show diagn result loc 0/rsp1/cpu0 test 9 detailadmin show diagn result loc 0/rsp0/cpu0 test 10 detailadmin show diagn result loc 0/rsp1/cpu0 test 10 detailadmin show diagn result loc 0/rsp0/cpu0 test 11 detailadmin show diagn result loc 0/rsp1/cpu0 test 11 detailshow controller fabric fia link-status location <lc>show controller fabric fia link-status location <both rsp>show controller fabric fia bridge sync-status location <both rsp>show controller fabric crossbar link-status instance 0 location <lc>show controller fabric crossbar link-status instance 0 location <both rsp>show controller fabric crossbar link-status instance 1 location <both rsp>show controller fabric ltrace crossbar location <both rsp>show controller fabric ltrace crossbar location <affected lc>show tech fabric location <fault showing lc> file <path to file>show tech fabric location <both rsp> file <path to file>
Useful Diagnostic Commands
Here is a list of commands that are useful for diagnostic purposes:
show diagnostic ondemand settingsshow diagnostic content location < loc >show diagnostic result location < loc > [ test {id|id_list|all} ] [ detail ]show diagnostic statusadmin diagnostic start location < loc > test {id|id_list|test-suite}admin diagnostic stop location < loc >- admin diagnostic ondemand iterations < iteration-count >
admin diagnostic ondemand action-on-failure {continue failure-count|stop}- admin-config#
[ no ] diagnostic monitor location < loc > test {id | test-name} [disable] - admin-config#
[ no ] diagnostic monitor interval location < loc > test {id | test-name} day hour:minute:second.millisec - admin-config#
[ no ] diagnostic monitor threshold location < loc > test {id | test-name} failure count
Conclusion
From the Cisco IOS XR Software Release 4.3.4 time frame, most issues related to punt fabric data path failures are addressed. For routers affected by Cisco bug ID CSCuj10837 and Cisco bug ID CSCul39674, load the superseding SMU for Cisco bug ID CSCul39674 in order to avoid fabric link retrain events.
The platform team has installed state-of-the-art fault handling so that the router recovers in subseconds if and when any data path recoverable failure occurs. However, this document is recommended in order to understand this problem, even if no such fault is observed.
Appendix
NP Loopback Diagnostic Path
The diagnostic application that executes on the line card CPU tracks the health of each NP with periodic checks of the working status of the NP. A packet is injected from the line card CPU destined to the local NP, which the NP should loop back and return to the line card CPU. Any loss in such periodic packets is flagged with a platform log message. Here is an example of such a message:
LC/0/7/CPU0:Aug 18 19:17:26.924 : pfm_node[182]:
%PLATFORM-PFM_DIAGS-2-LC_NP_LOOPBACK_FAILED : Set|online_diag_lc[94283]|
Line card NP loopback Test(0x2000006)|link failure mask is 0x8
This log message means this test failed to receive the loopback packet from NP3. The link failure mask is 0x8 (bit 3 is set), which indicates a failure between the line card CPU for slot 7 and NP3 on slot 7.
In order to obtain more details, collect the output of these commands:
admin show diagnostic result location 0/<x>/cpu0 test 9 detailshow controllers NP counter NP<0-3> location 0/<x>/cpu0
Fabric Debug Commands
The commands listed in this section apply to all Trident-based line cards as well as the Typhoon-based 100GE line card. The Bridge FPGA ASIC is not present on Typhoon-based line cards (except for the 100GE Typhoon-based line cards). So, the show controller fabric fia bridge commands do not apply to Typhoon-based line cards, except for the 100GE versions.
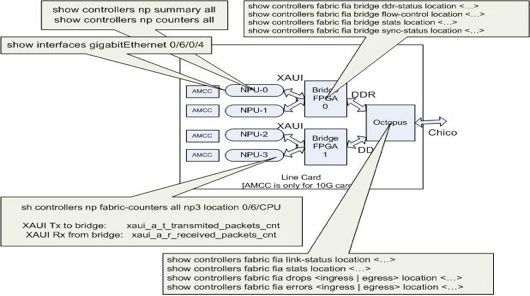
This pictorial representation helps to map each show command to the location in the data path. Use these show commands in order to isolate packet drops and faults.
Revision History
| Revision | Publish Date | Comments |
|---|---|---|
2.0 |
26-Jun-2023 |
Updated the Automatic Recovery Enhancements section for Cisco bug ID CSCuc04493 and updated the FAQ section. |
1.0 |
29-Oct-2013 |
Initial Release |
Contributed by Cisco Engineers
- Mahesh ShirshyadCisco TAC Engineer
- David PowersCisco TAC Engineer
- Jean-Christophe RodeCisco TAC Engineer
Contact Cisco
- Open a Support Case

- (Requires a Cisco Service Contract)
 Feedback